| Param | Original file | Final file |
|---|---|---|
| Filename | modeM0/AS1A14_060T01_9000006556_56459cztM0_level2.fits | modeM0/AS1A14_060T01_9000006556_56459cztM0_level2_quad_clean.evt |
| Size (bytes) | 695,882,880 | 80,089,920 |
| Size | 663.6 MB | 76.4 MB |
| Events in quadrant A | 4,842,560 | 555,782 |
| Events in quadrant B | 9,895,652 | 333,550 |
| Events in quadrant C | 4,784,758 | 550,842 |
| Events in quadrant D | 5,738,192 | 536,393 |
| Mode M0 | |||
|---|---|---|---|
| Quadrant | BADHDUFLAG | Total packets | Discarded packets |
| A | 0 | 18945 | 1 |
| B | 0 | 33884 | 1 |
| C | 0 | 18839 | 1 |
| D | 0 | 21665 | 1 |
| Mode M9 | |||
|---|---|---|---|
| Quadrant | BADHDUFLAG | Total packets | Discarded packets |
| A | 0 | 10 | 0 |
| B | 0 | 10 | 0 |
| C | 0 | 10 | 0 |
| D | 0 | 10 | 0 |
| Mode SS | |||
|---|---|---|---|
| Quadrant | BADHDUFLAG | Total packets | Discarded packets |
| A | 0 | 130 | 0 |
| B | 0 | 130 | 0 |
| C | 0 | 130 | 0 |
| D | 0 | 130 | 0 |
| Quadrant | Total seconds | Saturated seconds | Saturation percentage |
|---|---|---|---|
| A | 6427 | 584 | 9.086666% |
| B | 6427 | 3144 | 48.918625% |
| C | 6427 | 444 | 6.908355% |
| D | 6427 | 128 | 1.991598% |
Noise dominated data is calculated using 1-second bins in cleaned event files. If a bin has >2000 counts, and if more than 50% of those come from <1% of pixels, then it is considered to be noise-dominated and hence unusable.
| Quadrant | # 1 sec bins | Bins with >0 counts | Bins with >2000 counts | High rate bins dominated by noise | Noise dominated (total time) | Noise dominated (detector-on time) | Marked lightcurve |
|---|---|---|---|---|---|---|---|
| A | 7407 | 6428 | 532 | 532 | 7.18% | 8.28% |  |
| B | 7407 | 6428 | 2671 | 2671 | 36.06% | 41.55% |  |
| C | 7407 | 6428 | 440 | 440 | 5.94% | 6.85% |  |
| D | 7407 | 6428 | 115 | 115 | 1.55% | 1.79% | 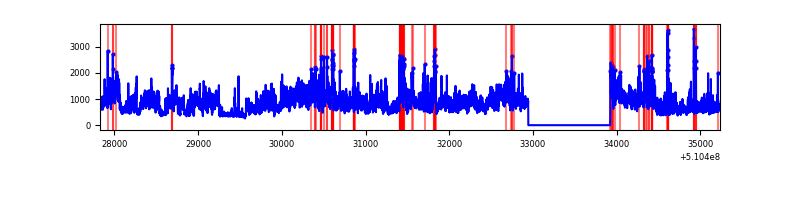 |
Top three noisy pixels from each quadrant. If the there are fewer than three noisy pixels in the level2.evt file, extra rows are filled as -1
| Pixel properties | Quadrant properties | ||||||
|---|---|---|---|---|---|---|---|
| Quadrant | DetID | PixID | Counts | Sigma | Mean | Median | Sigma |
| A | 12 | 3 | 1142541 | 7040.44 | 652 | 636 | 162.2 |
| A | 4 | 206 | 300612 | 1849.51 | 652 | 636 | 162.2 |
| A | 0 | 8 | 241658 | 1486.03 | 652 | 636 | 162.2 |
| B | 5 | 172 | 6659318 | 54165.37 | 570 | 550 | 122.9 |
| B | 4 | 206 | 425198 | 3454.28 | 570 | 550 | 122.9 |
| B | 0 | 63 | 301983 | 2451.99 | 570 | 550 | 122.9 |
| C | 12 | 254 | 1127243 | 6358.62 | 641 | 635 | 177.2 |
| C | 13 | 3 | 509965 | 2874.68 | 641 | 635 | 177.2 |
| C | 15 | 230 | 203853 | 1146.97 | 641 | 635 | 177.2 |
| D | 9 | 49 | 2349250 | 12859.85 | 645 | 618 | 182.6 |
| D | 2 | 249 | 340412 | 1860.53 | 645 | 618 | 182.6 |
| D | 7 | 96 | 111537 | 607.33 | 645 | 618 | 182.6 |
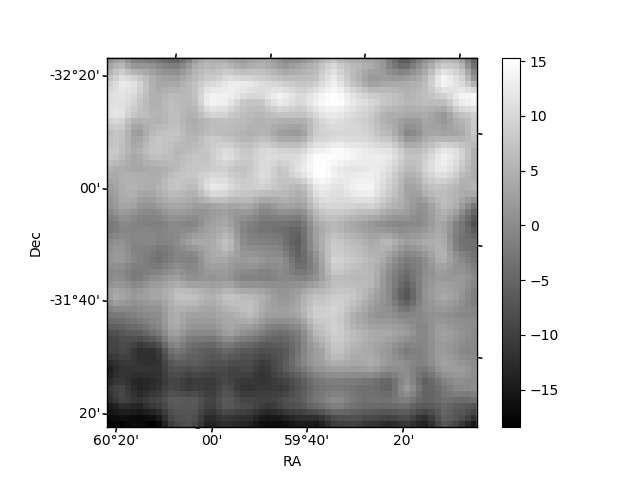
Histogram calculated using DETX and DETY for each event in the final _common_clean file
| Quadrant A |  |
 |
Quadrant B |
|---|---|---|---|
| Quadrant D | 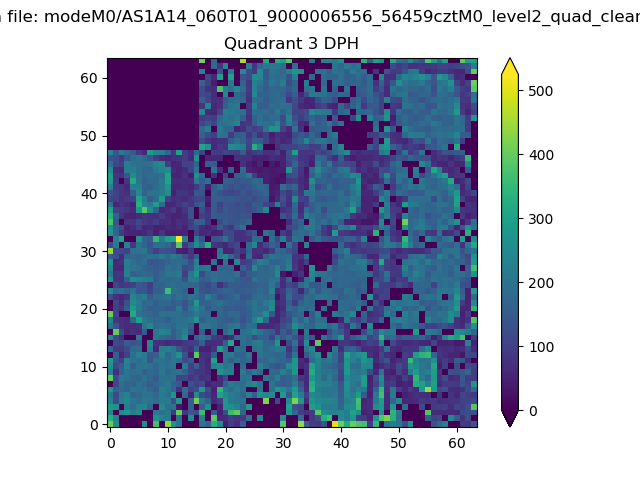 |
 |
Quadrant C |
| Plot type | Count rate plots | Images |
|---|---|---|
| Comparison with Poisson distribution Blue bars denote a histogram of data divided into 1 sec bins. Red curve is a Poisson curve with rate = median count rate of data. |
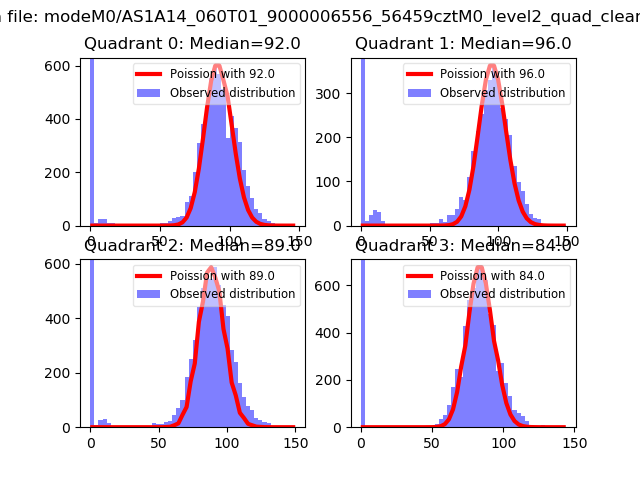 |
 |
| Quadrant-wise count rates Data is divided into 100 sec bins |
 |
|
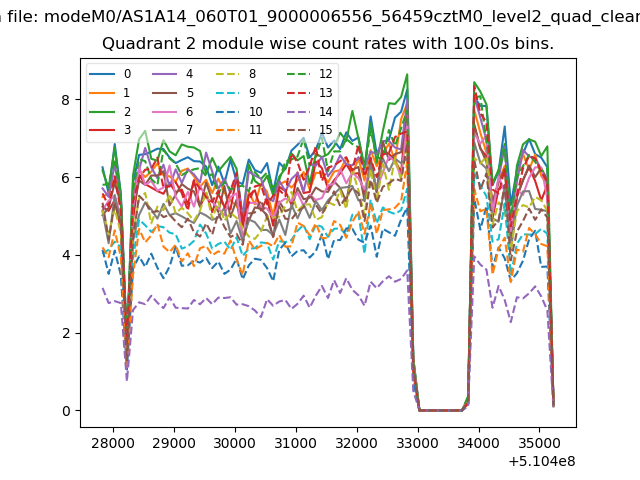
| Module-wise count rates for Quadrant A Data is divided into 100 sec bins |
 |
 |
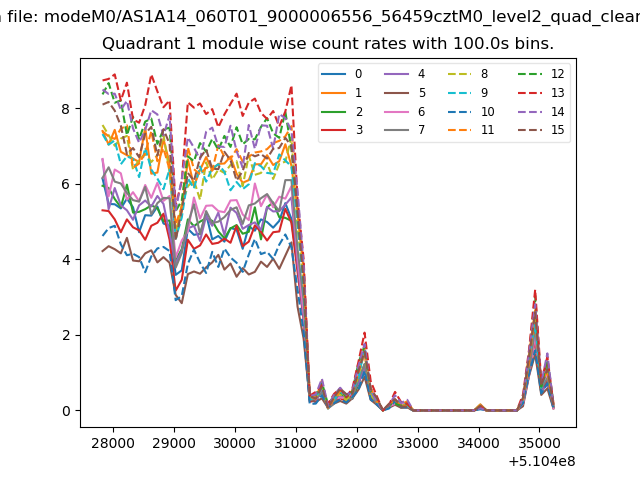
| Module-wise count rates for Quadrant B Data is divided into 100 sec bins |
 |
 |
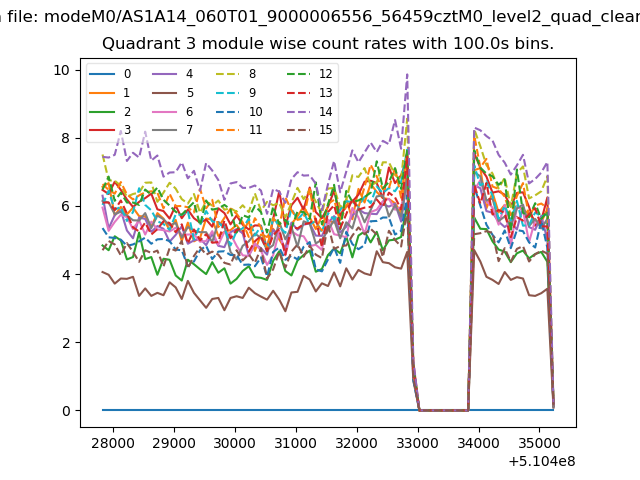
| Module-wise count rates for Quadrant C Data is divided into 100 sec bins |
 |
 |
| Module-wise count rates for Quadrant D Data is divided into 100 sec bins |
 |
 |
| Parameter | Plot |
|---|---|
| CZT HV Monitor | 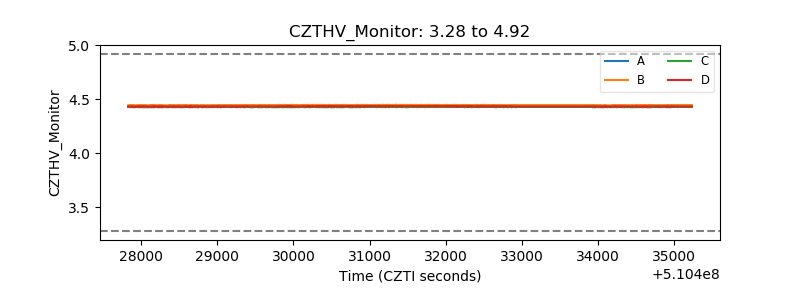 |
| D_VDD |  |
| Temperature 1 | 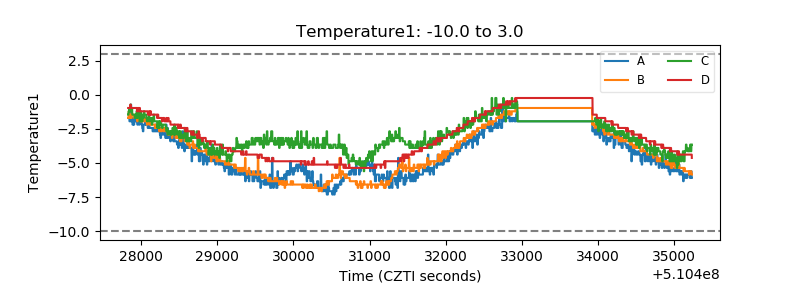 |
| Veto HV Monitor |  |
| Veto LLD |  |
| Alpha Counter | 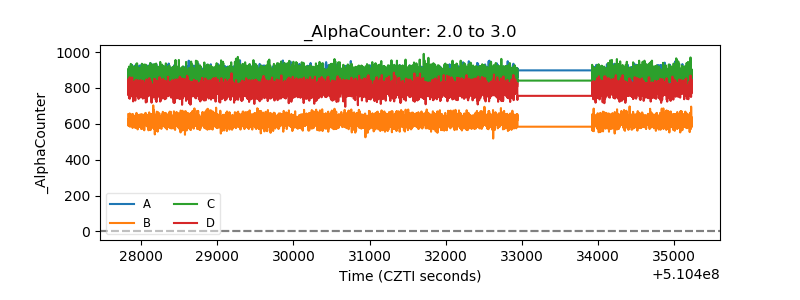 |
| _CPM_Rate | 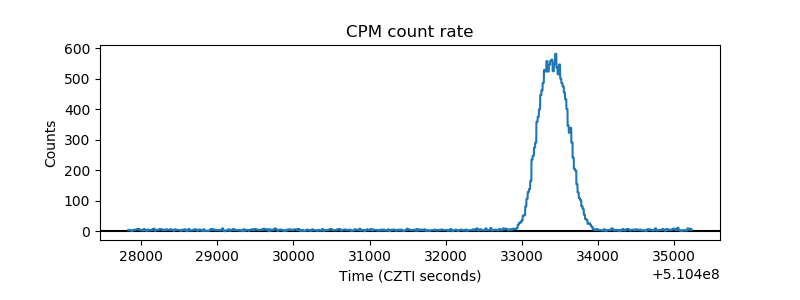 |
| CZT Counter | 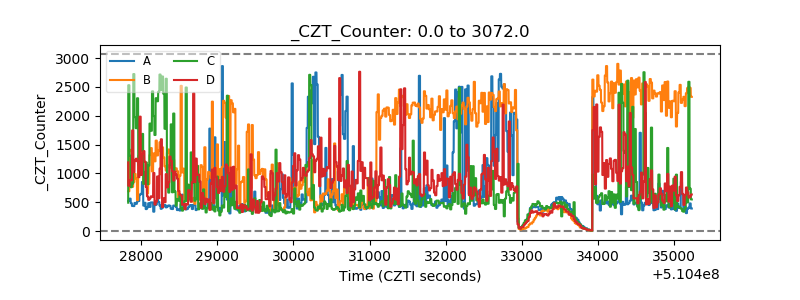 |
| +2.5 Volts monitor | 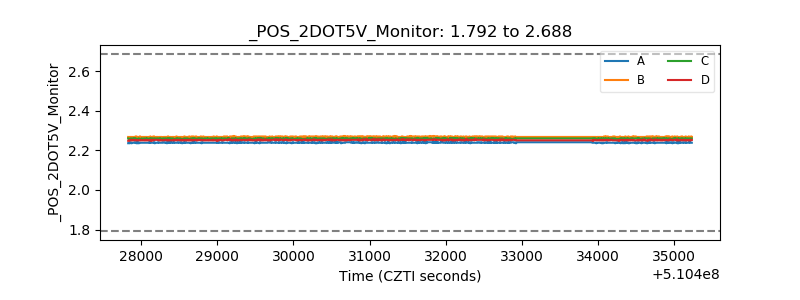 |
| +5 Volts monitor | 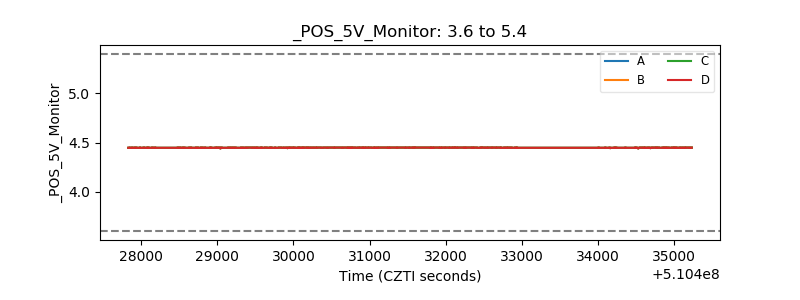 |
| _ROLL_ROT | 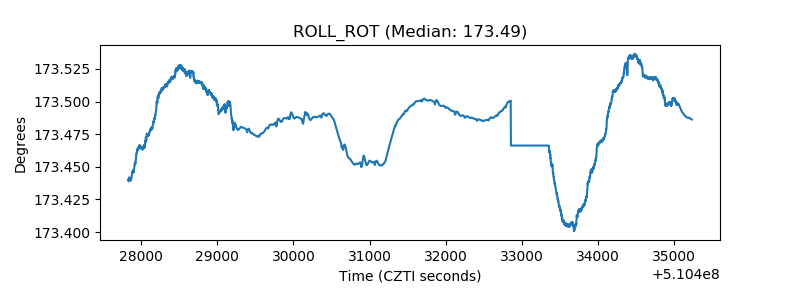 |
| _Roll_DEC | 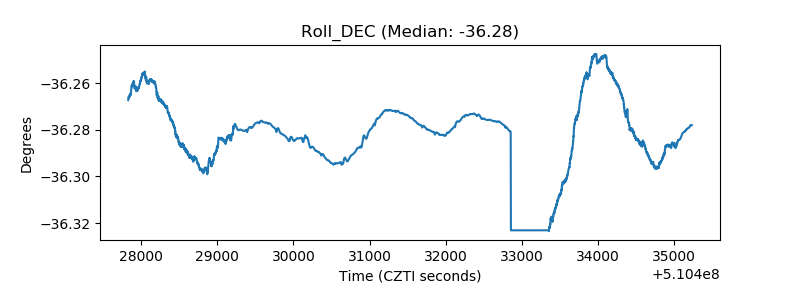 |
| _Roll_RA |  |
| Veto Counter | 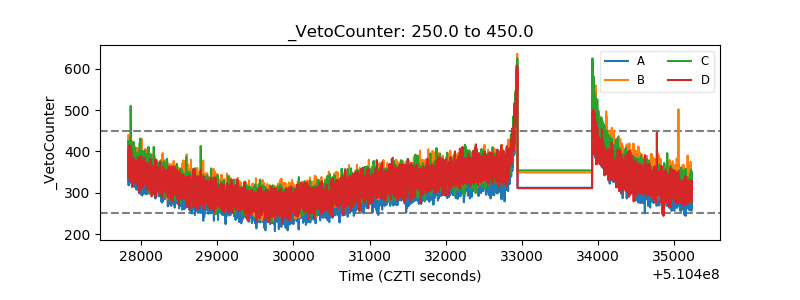 |