| Param | Original file | Final file |
|---|---|---|
| Filename | modeM0/AS1A14_060T01_9000006556_56461cztM0_level2.fits | modeM0/AS1A14_060T01_9000006556_56461cztM0_level2_quad_clean.evt |
| Size (bytes) | 678,104,640 | 82,736,640 |
| Size | 646.7 MB | 78.9 MB |
| Events in quadrant A | 5,627,402 | 537,919 |
| Events in quadrant B | 10,349,607 | 400,139 |
| Events in quadrant C | 4,264,417 | 571,386 |
| Events in quadrant D | 4,357,572 | 543,800 |
| Mode M0 | |||
|---|---|---|---|
| Quadrant | BADHDUFLAG | Total packets | Discarded packets |
| A | 0 | 21392 | 2 |
| B | 0 | 35071 | 2 |
| C | 0 | 17326 | 2 |
| D | 0 | 17463 | 2 |
| Mode M9 | |||
|---|---|---|---|
| Quadrant | BADHDUFLAG | Total packets | Discarded packets |
| A | 0 | 16 | 0 |
| B | 0 | 17 | 0 |
| C | 0 | 17 | 0 |
| D | 0 | 17 | 0 |
| Mode SS | |||
|---|---|---|---|
| Quadrant | BADHDUFLAG | Total packets | Discarded packets |
| A | 0 | 132 | 0 |
| B | 0 | 132 | 0 |
| C | 0 | 132 | 0 |
| D | 0 | 132 | 0 |
| Quadrant | Total seconds | Saturated seconds | Saturation percentage |
|---|---|---|---|
| A | 6474 | 938 | 14.488724% |
| B | 6473 | 2837 | 43.828209% |
| C | 6473 | 356 | 5.499768% |
| D | 6473 | 207 | 3.197899% |
Noise dominated data is calculated using 1-second bins in cleaned event files. If a bin has >2000 counts, and if more than 50% of those come from <1% of pixels, then it is considered to be noise-dominated and hence unusable.
| Quadrant | # 1 sec bins | Bins with >0 counts | Bins with >2000 counts | High rate bins dominated by noise | Noise dominated (total time) | Noise dominated (detector-on time) | Marked lightcurve |
|---|---|---|---|---|---|---|---|
| A | 7574 | 6475 | 853 | 853 | 11.26% | 13.17% |  |
| B | 7573 | 6474 | 2730 | 2730 | 36.05% | 42.17% | 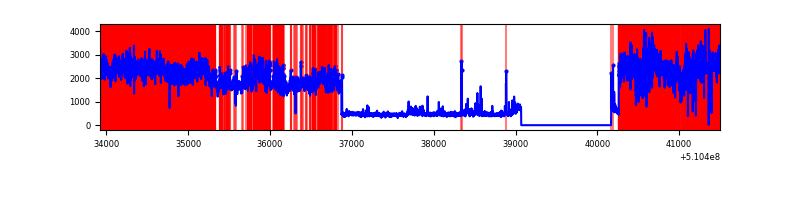 |
| C | 7573 | 6474 | 290 | 290 | 3.83% | 4.48% | 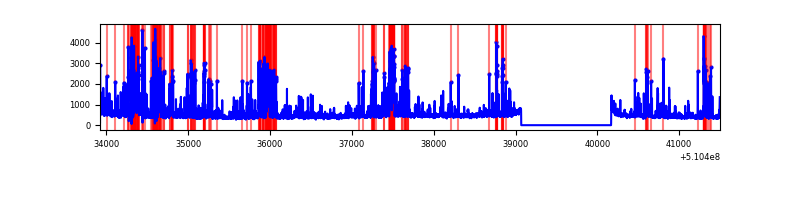 |
| D | 7573 | 6474 | 195 | 195 | 2.57% | 3.01% |  |
Top three noisy pixels from each quadrant. If the there are fewer than three noisy pixels in the level2.evt file, extra rows are filled as -1
| Pixel properties | Quadrant properties | ||||||
|---|---|---|---|---|---|---|---|
| Quadrant | DetID | PixID | Counts | Sigma | Mean | Median | Sigma |
| A | 12 | 3 | 1917774 | 12056.55 | 639 | 624 | 159.0 |
| A | 4 | 249 | 452854 | 2843.98 | 639 | 624 | 159.0 |
| A | 12 | 194 | 262325 | 1645.78 | 639 | 624 | 159.0 |
| B | 5 | 172 | 7779663 | 64430.04 | 564 | 545 | 120.7 |
| B | 0 | 63 | 148891 | 1228.67 | 564 | 545 | 120.7 |
| B | 1 | 159 | 31997 | 260.5 | 564 | 545 | 120.7 |
| C | 13 | 3 | 627030 | 3476.6 | 653 | 649 | 180.2 |
| C | 15 | 230 | 550709 | 3052.99 | 653 | 649 | 180.2 |
| C | 12 | 254 | 256201 | 1418.39 | 653 | 649 | 180.2 |
| D | 9 | 49 | 587789 | 3149.27 | 655 | 625 | 186.4 |
| D | 12 | 4 | 547032 | 2930.67 | 655 | 625 | 186.4 |
| D | 2 | 249 | 183163 | 979.05 | 655 | 625 | 186.4 |
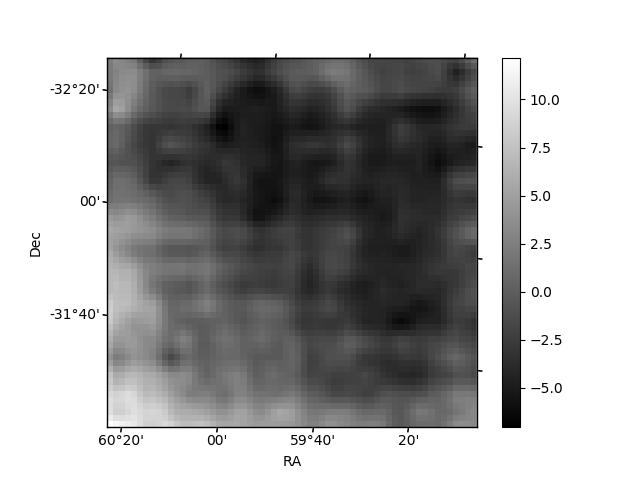
Histogram calculated using DETX and DETY for each event in the final _common_clean file
| Quadrant A | 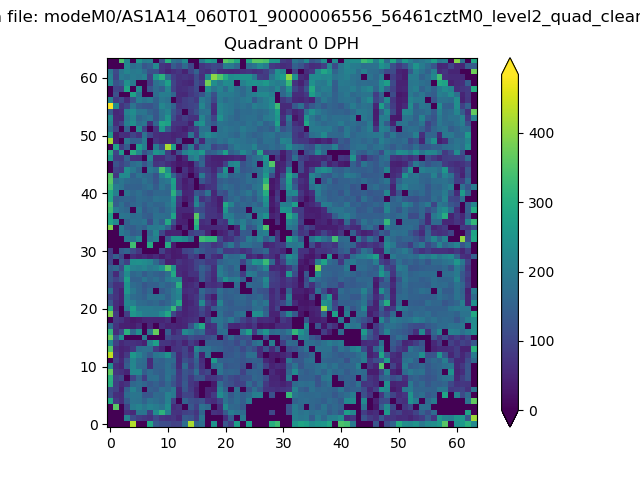 |
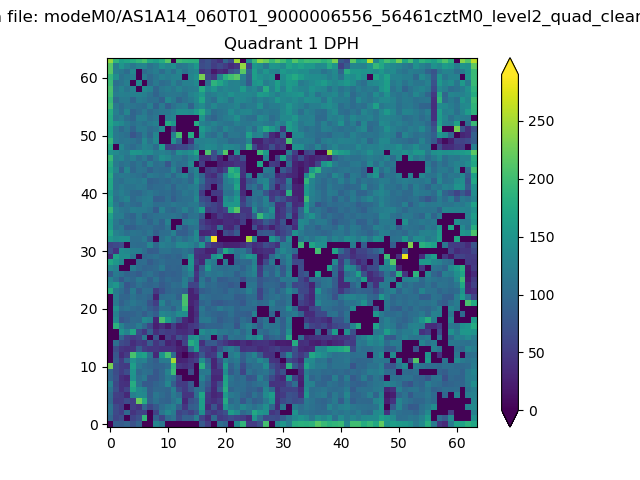 |
Quadrant B |
|---|---|---|---|
| Quadrant D | 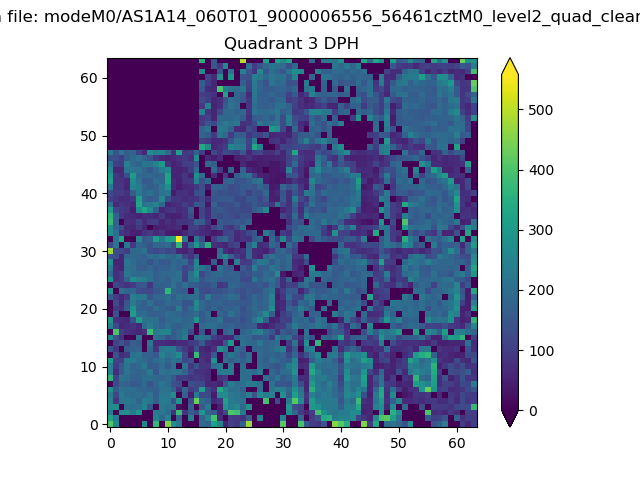 |
 |
Quadrant C |
| Plot type | Count rate plots | Images |
|---|---|---|
| Comparison with Poisson distribution Blue bars denote a histogram of data divided into 1 sec bins. Red curve is a Poisson curve with rate = median count rate of data. |
 |
 |
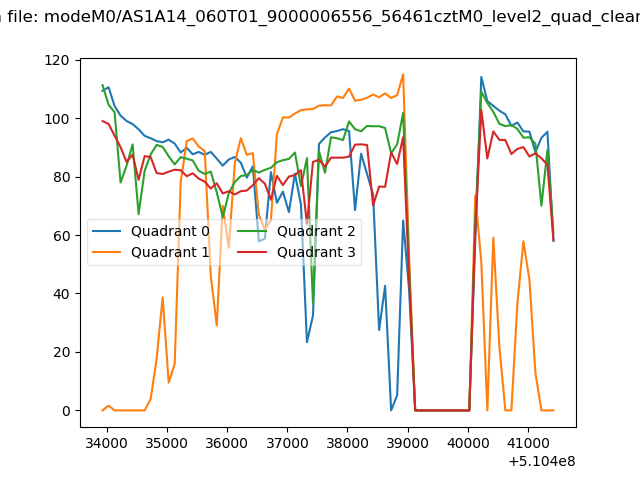
| Quadrant-wise count rates Data is divided into 100 sec bins |
 |
|
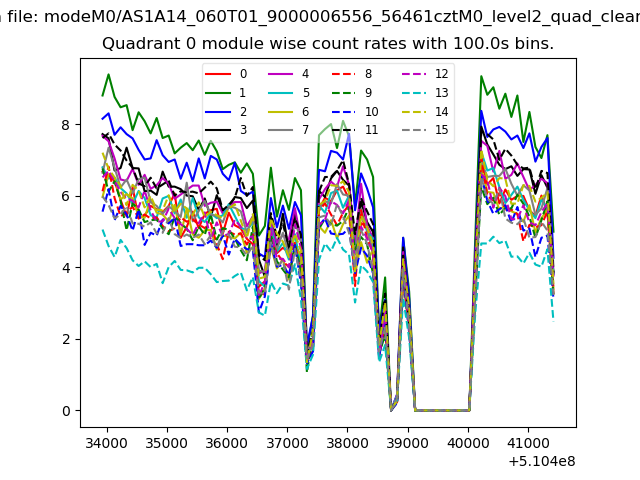
| Module-wise count rates for Quadrant A Data is divided into 100 sec bins |
 |
 |
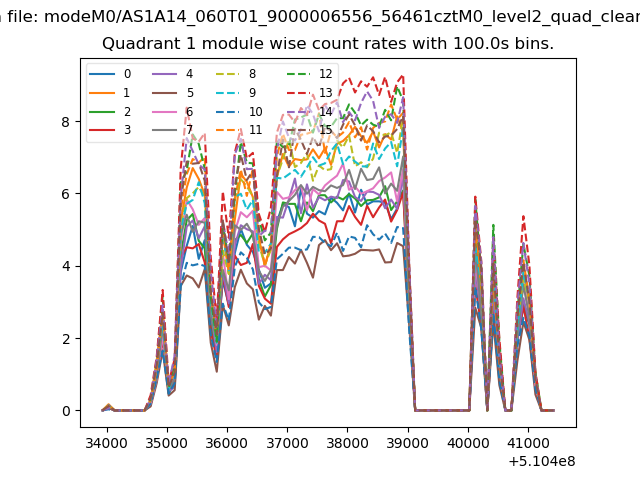
| Module-wise count rates for Quadrant B Data is divided into 100 sec bins |
 |
 |
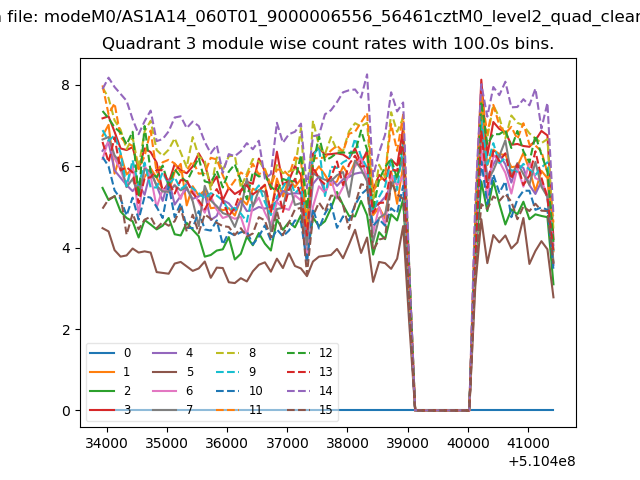
| Module-wise count rates for Quadrant C Data is divided into 100 sec bins |
 |
 |
| Module-wise count rates for Quadrant D Data is divided into 100 sec bins |
 |
 |
| Parameter | Plot |
|---|---|
| CZT HV Monitor |  |
| D_VDD | 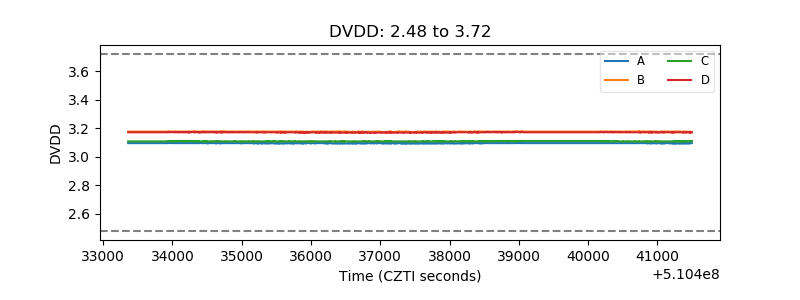 |
| Temperature 1 | 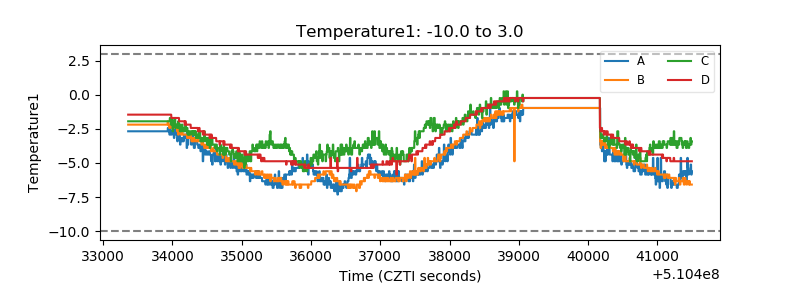 |
| Veto HV Monitor | 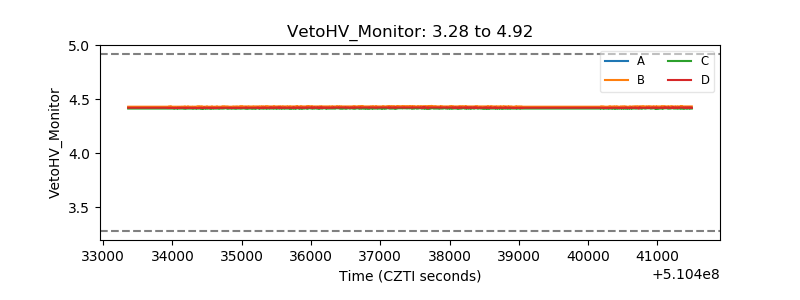 |
| Veto LLD | 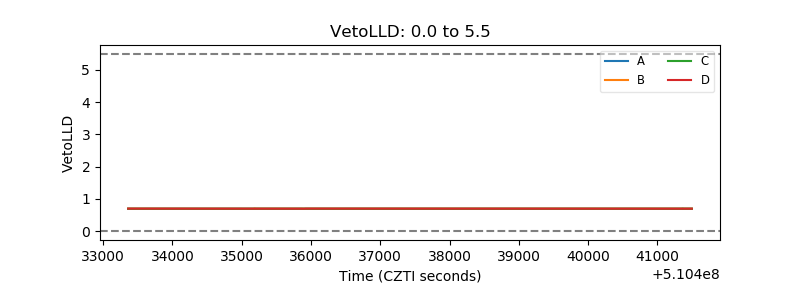 |
| Alpha Counter |  |
| _CPM_Rate |  |
| CZT Counter | 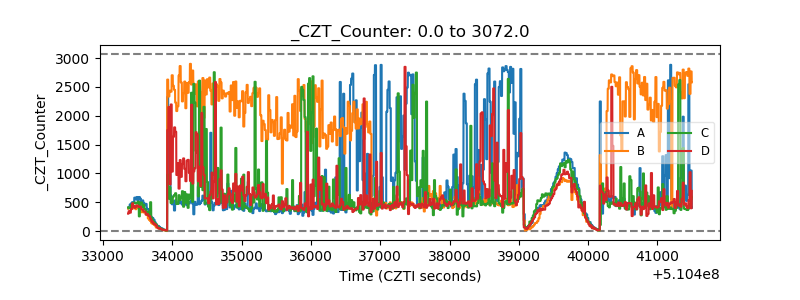 |
| +2.5 Volts monitor | 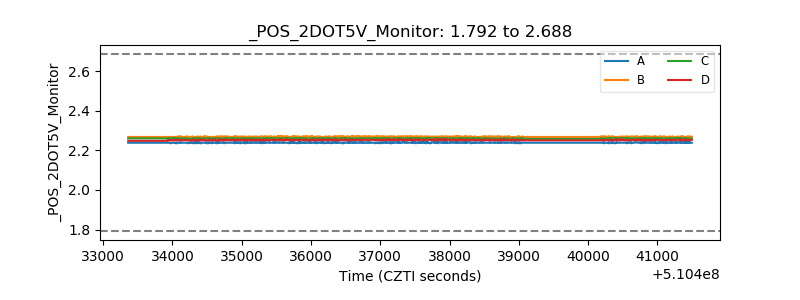 |
| +5 Volts monitor |  |
| _ROLL_ROT | 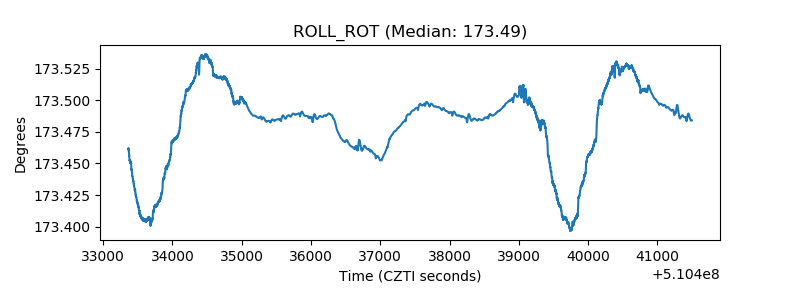 |
| _Roll_DEC | 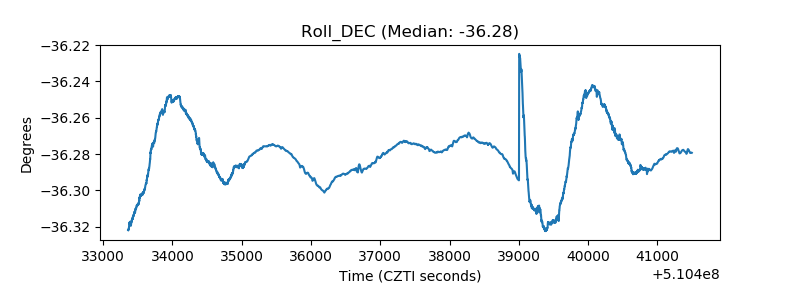 |
| _Roll_RA |  |
| Veto Counter | 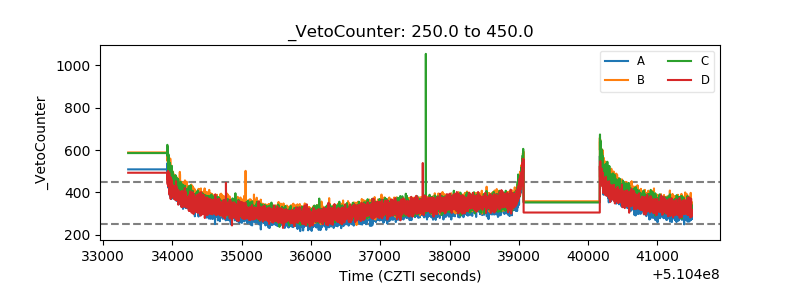 |