| Param | Original file | Final file |
|---|---|---|
| Filename | modeM0/AS1A14_060T01_9000006556_56463cztM0_level2.fits | modeM0/AS1A14_060T01_9000006556_56463cztM0_level2_quad_clean.evt |
| Size (bytes) | 676,612,800 | 88,894,080 |
| Size | 645.3 MB | 84.8 MB |
| Events in quadrant A | 5,169,214 | 605,674 |
| Events in quadrant B | 8,727,894 | 504,687 |
| Events in quadrant C | 3,225,158 | 634,555 |
| Events in quadrant D | 7,406,989 | 482,682 |
| Mode M0 | |||
|---|---|---|---|
| Quadrant | BADHDUFLAG | Total packets | Discarded packets |
| A | 0 | 20039 | 2 |
| B | 0 | 30602 | 6 |
| C | 0 | 14449 | 2 |
| D | 0 | 26438 | 2 |
| Mode M9 | |||
|---|---|---|---|
| Quadrant | BADHDUFLAG | Total packets | Discarded packets |
| A | 0 | 16 | 0 |
| B | 0 | 16 | 0 |
| C | 0 | 17 | 0 |
| D | 0 | 17 | 0 |
| Mode SS | |||
|---|---|---|---|
| Quadrant | BADHDUFLAG | Total packets | Discarded packets |
| A | 0 | 134 | 0 |
| B | 0 | 134 | 0 |
| C | 0 | 134 | 0 |
| D | 0 | 134 | 0 |
| Quadrant | Total seconds | Saturated seconds | Saturation percentage |
|---|---|---|---|
| A | 6661 | 689 | 10.343792% |
| B | 6660 | 2157 | 32.387387% |
| C | 6660 | 63 | 0.945946% |
| D | 6660 | 1356 | 20.360360% |
Noise dominated data is calculated using 1-second bins in cleaned event files. If a bin has >2000 counts, and if more than 50% of those come from <1% of pixels, then it is considered to be noise-dominated and hence unusable.
| Quadrant | # 1 sec bins | Bins with >0 counts | Bins with >2000 counts | High rate bins dominated by noise | Noise dominated (total time) | Noise dominated (detector-on time) | Marked lightcurve |
|---|---|---|---|---|---|---|---|
| A | 7846 | 6662 | 670 | 670 | 8.54% | 10.06% |  |
| B | 7845 | 6661 | 1683 | 1683 | 21.45% | 25.27% |  |
| C | 7845 | 6661 | 29 | 29 | 0.37% | 0.44% | 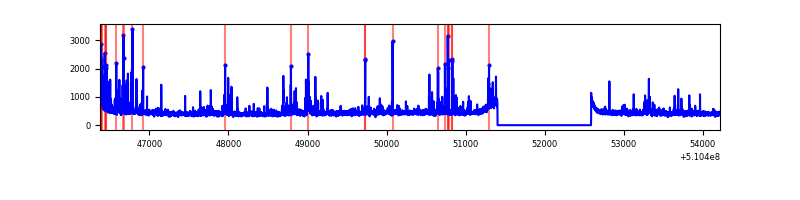 |
| D | 7845 | 6661 | 1257 | 1257 | 16.02% | 18.87% |  |
Top three noisy pixels from each quadrant. If the there are fewer than three noisy pixels in the level2.evt file, extra rows are filled as -1
| Pixel properties | Quadrant properties | ||||||
|---|---|---|---|---|---|---|---|
| Quadrant | DetID | PixID | Counts | Sigma | Mean | Median | Sigma |
| A | 12 | 3 | 1029944 | 5839.79 | 707 | 689 | 176.2 |
| A | 4 | 95 | 817268 | 4633.11 | 707 | 689 | 176.2 |
| A | 4 | 206 | 313827 | 1776.68 | 707 | 689 | 176.2 |
| B | 5 | 172 | 5944600 | 43653.74 | 632 | 609 | 136.2 |
| B | 0 | 63 | 75993 | 553.63 | 632 | 609 | 136.2 |
| B | 1 | 159 | 47244 | 342.5 | 632 | 609 | 136.2 |
| C | 12 | 254 | 103945 | 522.8 | 717 | 713 | 197.5 |
| C | 15 | 230 | 91655 | 460.56 | 717 | 713 | 197.5 |
| C | 12 | 252 | 91071 | 457.6 | 717 | 713 | 197.5 |
| D | 12 | 4 | 3596656 | 19994.04 | 629 | 600 | 179.9 |
| D | 8 | 129 | 471456 | 2617.96 | 629 | 600 | 179.9 |
| D | 2 | 249 | 290443 | 1611.52 | 629 | 600 | 179.9 |
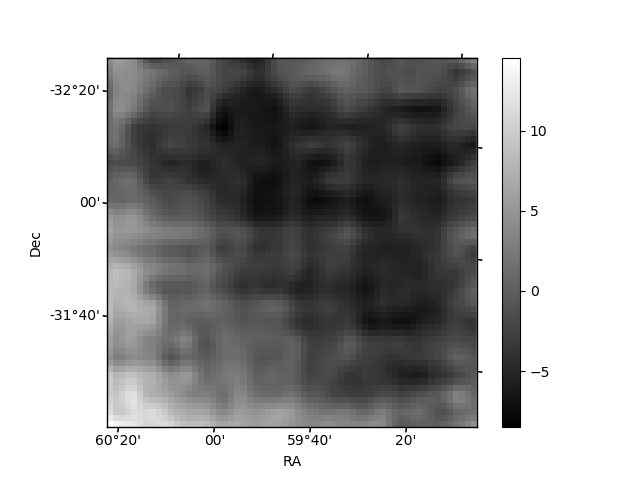
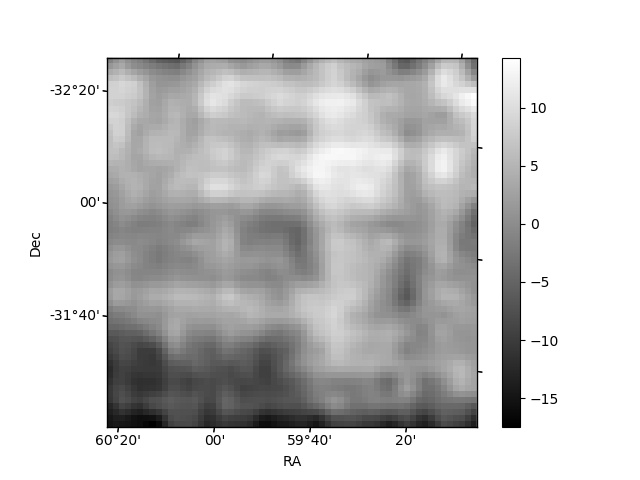
Histogram calculated using DETX and DETY for each event in the final _common_clean file
| Quadrant A | 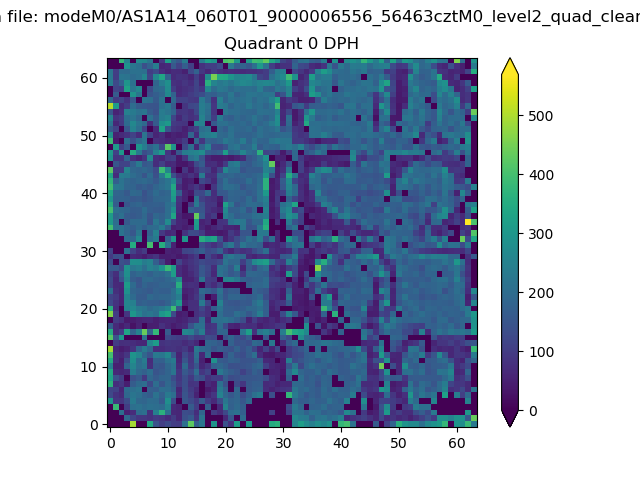 |
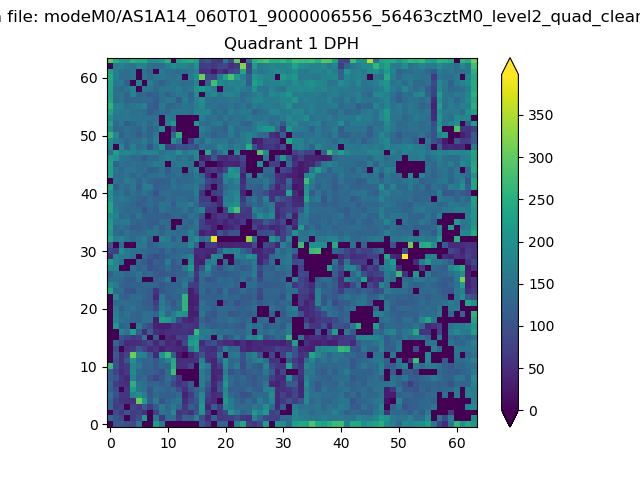 |
Quadrant B |
|---|---|---|---|
| Quadrant D | 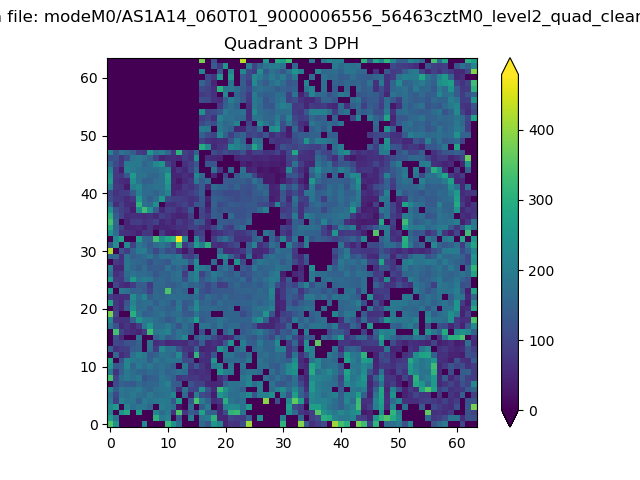 |
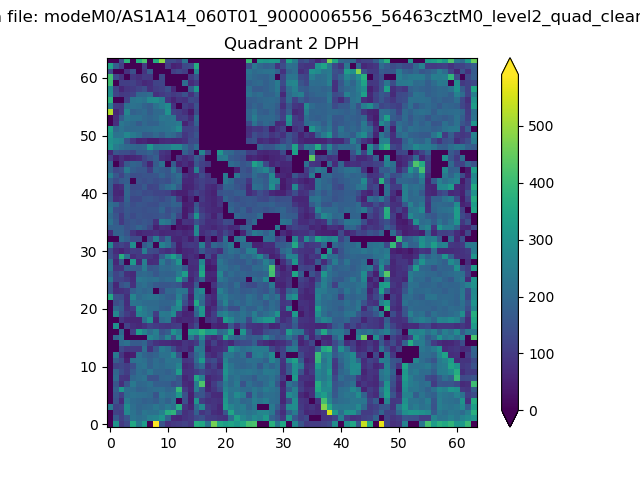 |
Quadrant C |
| Plot type | Count rate plots | Images |
|---|---|---|
| Comparison with Poisson distribution Blue bars denote a histogram of data divided into 1 sec bins. Red curve is a Poisson curve with rate = median count rate of data. |
 |
 |
| Quadrant-wise count rates Data is divided into 100 sec bins |
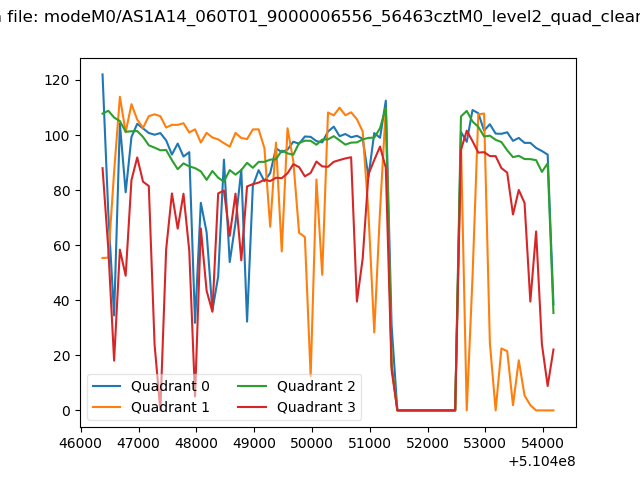 |
|
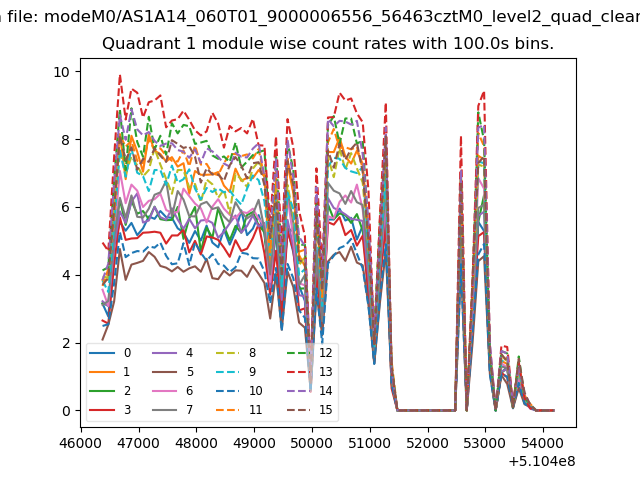
| Module-wise count rates for Quadrant A Data is divided into 100 sec bins |
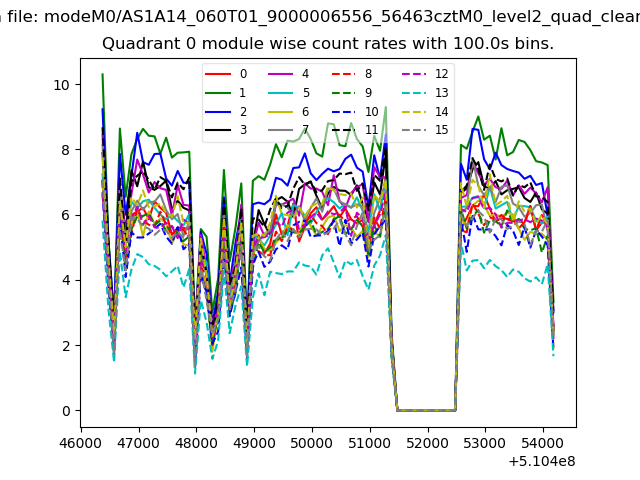 |
 |
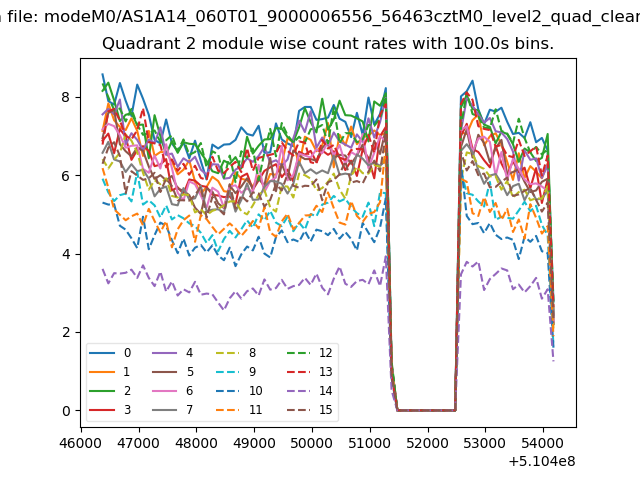
| Module-wise count rates for Quadrant B Data is divided into 100 sec bins |
 |
 |
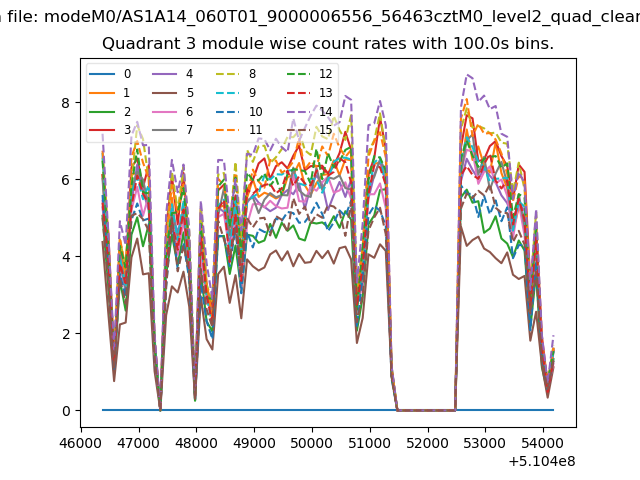
| Module-wise count rates for Quadrant C Data is divided into 100 sec bins |
 |
 |
| Module-wise count rates for Quadrant D Data is divided into 100 sec bins |
 |
 |
| Parameter | Plot |
|---|---|
| CZT HV Monitor |  |
| D_VDD | 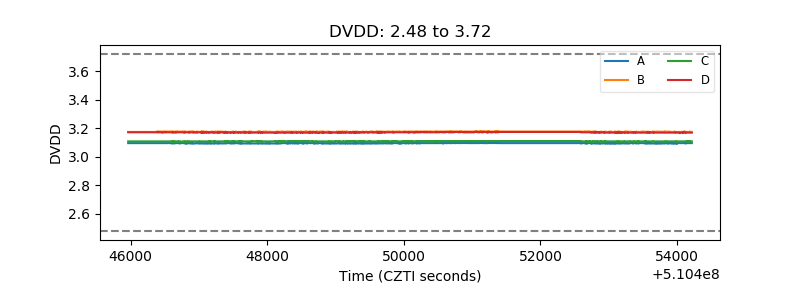 |
| Temperature 1 |  |
| Veto HV Monitor | 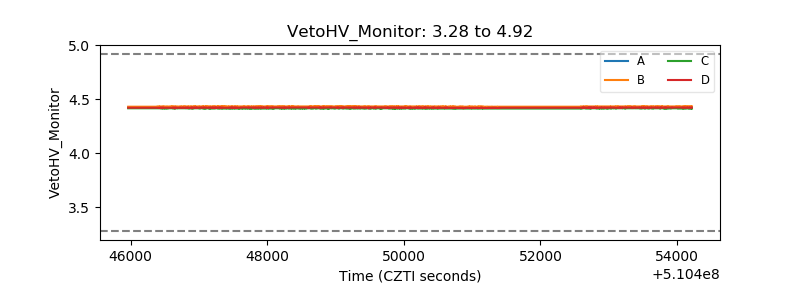 |
| Veto LLD | 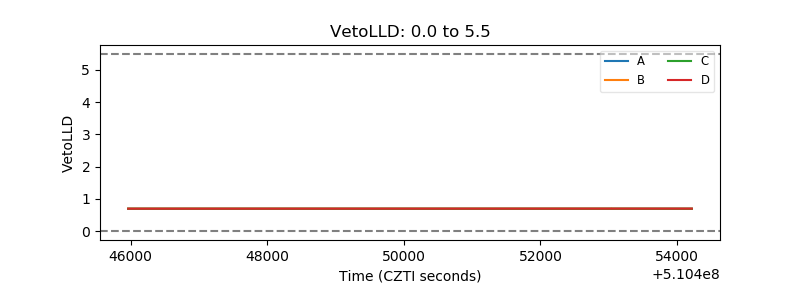 |
| Alpha Counter |  |
| _CPM_Rate |  |
| CZT Counter | 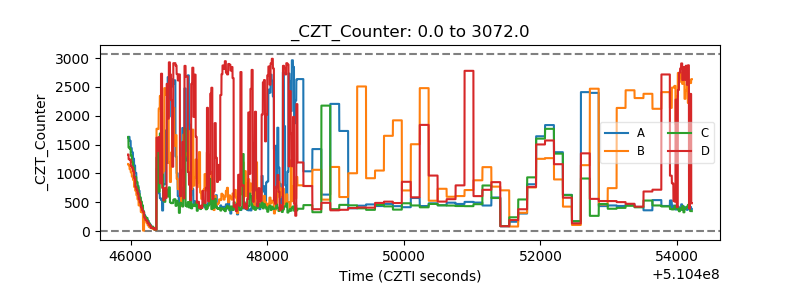 |
| +2.5 Volts monitor | 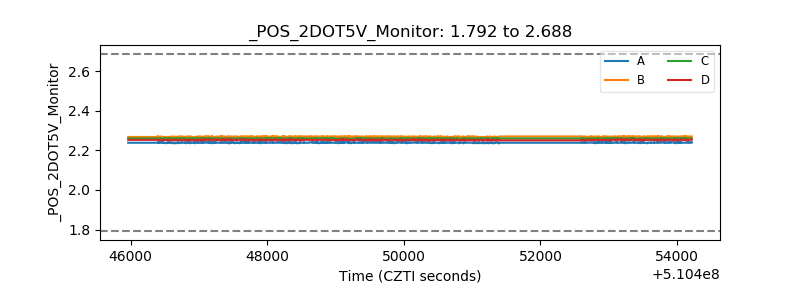 |
| +5 Volts monitor |  |
| _ROLL_ROT | 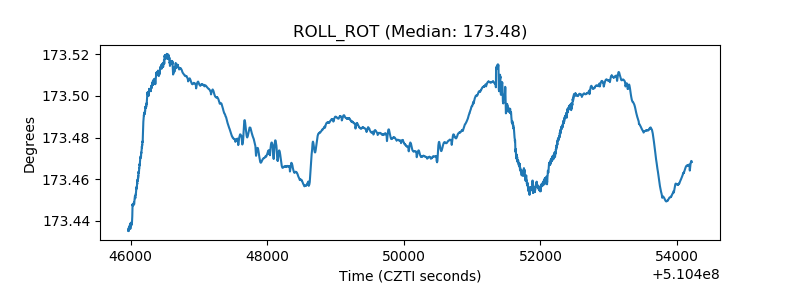 |
| _Roll_DEC | 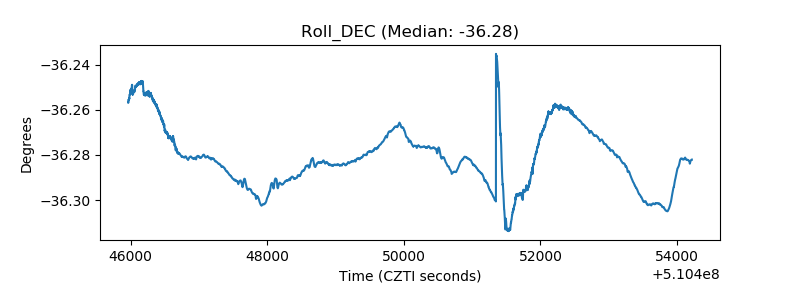 |
| _Roll_RA |  |
| Veto Counter | 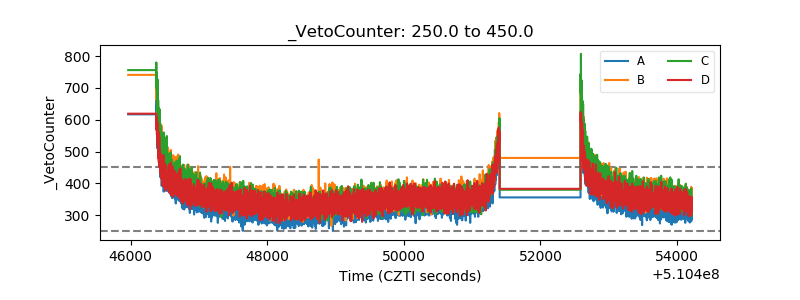 |