| Param | Original file | Final file |
|---|---|---|
| Filename | modeM0/AS1A14_060T01_9000006556_56465cztM0_level2.fits | modeM0/AS1A14_060T01_9000006556_56465cztM0_level2_quad_clean.evt |
| Size (bytes) | 583,369,920 | 95,745,600 |
| Size | 556.3 MB | 91.3 MB |
| Events in quadrant A | 7,354,916 | 515,770 |
| Events in quadrant B | 3,456,515 | 721,387 |
| Events in quadrant C | 3,604,226 | 643,790 |
| Events in quadrant D | 6,637,291 | 532,457 |
| Mode M0 | |||
|---|---|---|---|
| Quadrant | BADHDUFLAG | Total packets | Discarded packets |
| A | 0 | 26732 | 7 |
| B | 0 | 14981 | 2 |
| C | 0 | 15812 | 2 |
| D | 0 | 24449 | 2 |
| Mode M9 | |||
|---|---|---|---|
| Quadrant | BADHDUFLAG | Total packets | Discarded packets |
| A | 0 | 21 | 0 |
| B | 0 | 21 | 0 |
| C | 0 | 21 | 0 |
| D | 0 | 21 | 0 |
| Mode SS | |||
|---|---|---|---|
| Quadrant | BADHDUFLAG | Total packets | Discarded packets |
| A | 0 | 144 | 0 |
| B | 0 | 144 | 0 |
| C | 0 | 144 | 0 |
| D | 0 | 144 | 0 |
| Quadrant | Total seconds | Saturated seconds | Saturation percentage |
|---|---|---|---|
| A | 6970 | 1721 | 24.691535% |
| B | 6970 | 143 | 2.051650% |
| C | 6970 | 120 | 1.721664% |
| D | 6970 | 983 | 14.103300% |
Noise dominated data is calculated using 1-second bins in cleaned event files. If a bin has >2000 counts, and if more than 50% of those come from <1% of pixels, then it is considered to be noise-dominated and hence unusable.
| Quadrant | # 1 sec bins | Bins with >0 counts | Bins with >2000 counts | High rate bins dominated by noise | Noise dominated (total time) | Noise dominated (detector-on time) | Marked lightcurve |
|---|---|---|---|---|---|---|---|
| A | 9100 | 6972 | 1552 | 1552 | 17.05% | 22.26% |  |
| B | 9100 | 6972 | 6 | 6 | 0.07% | 0.09% |  |
| C | 9100 | 6972 | 46 | 46 | 0.51% | 0.66% | 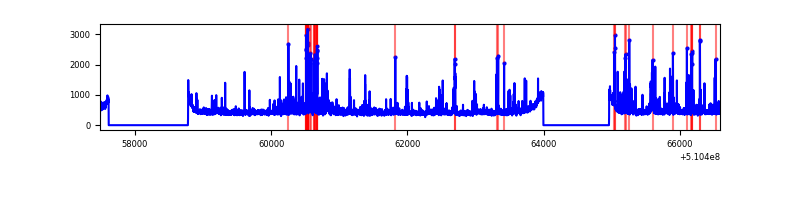 |
| D | 9100 | 6972 | 834 | 834 | 9.16% | 11.96% |  |
Top three noisy pixels from each quadrant. If the there are fewer than three noisy pixels in the level2.evt file, extra rows are filled as -1
| Pixel properties | Quadrant properties | ||||||
|---|---|---|---|---|---|---|---|
| Quadrant | DetID | PixID | Counts | Sigma | Mean | Median | Sigma |
| A | 4 | 95 | 3344266 | 19735.85 | 690 | 674 | 169.4 |
| A | 12 | 3 | 653664 | 3854.33 | 690 | 674 | 169.4 |
| A | 4 | 206 | 256743 | 1511.47 | 690 | 674 | 169.4 |
| B | 0 | 63 | 147153 | 894.24 | 773 | 745 | 163.7 |
| B | 5 | 172 | 80828 | 489.14 | 773 | 745 | 163.7 |
| B | 12 | 111 | 20288 | 119.36 | 773 | 745 | 163.7 |
| C | 15 | 230 | 212875 | 1014.17 | 766 | 761 | 209.2 |
| C | 13 | 3 | 195145 | 929.4 | 766 | 761 | 209.2 |
| C | 12 | 252 | 97954 | 464.7 | 766 | 761 | 209.2 |
| D | 12 | 4 | 2323368 | 11576.5 | 709 | 678 | 200.6 |
| D | 8 | 129 | 579687 | 2885.83 | 709 | 678 | 200.6 |
| D | 2 | 249 | 359795 | 1789.87 | 709 | 678 | 200.6 |
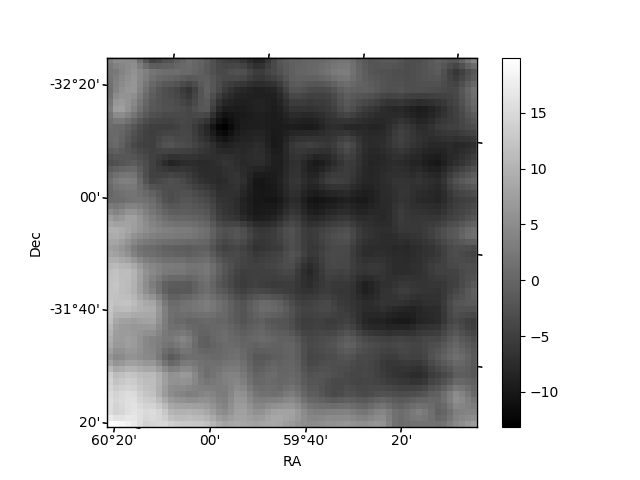
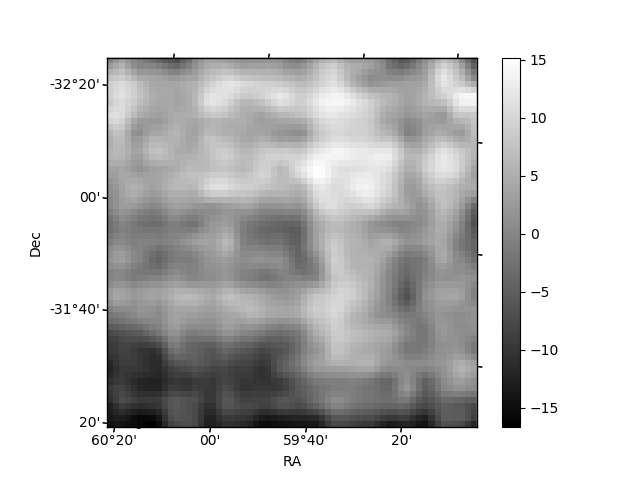
Histogram calculated using DETX and DETY for each event in the final _common_clean file
| Quadrant A | 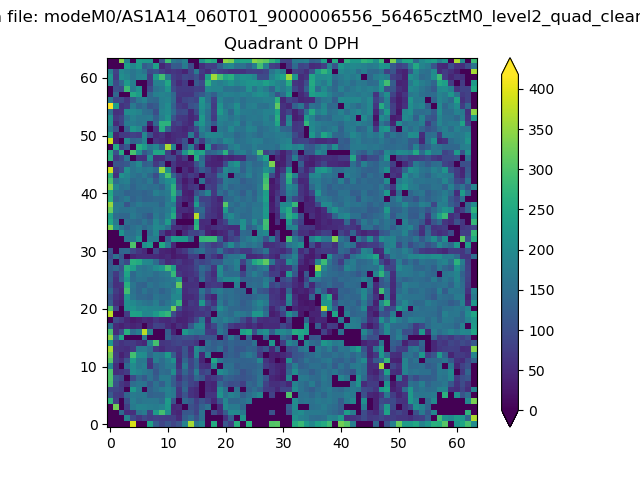 |
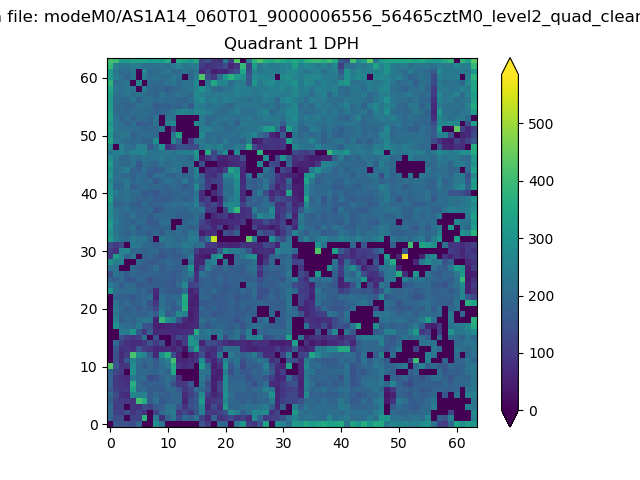 |
Quadrant B |
|---|---|---|---|
| Quadrant D |  |
 |
Quadrant C |
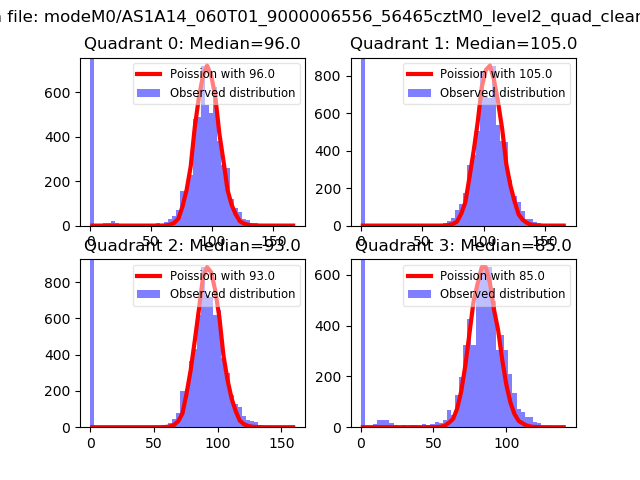
| Plot type | Count rate plots | Images |
|---|---|---|
| Comparison with Poisson distribution Blue bars denote a histogram of data divided into 1 sec bins. Red curve is a Poisson curve with rate = median count rate of data. |
 |
 |
| Quadrant-wise count rates Data is divided into 100 sec bins |
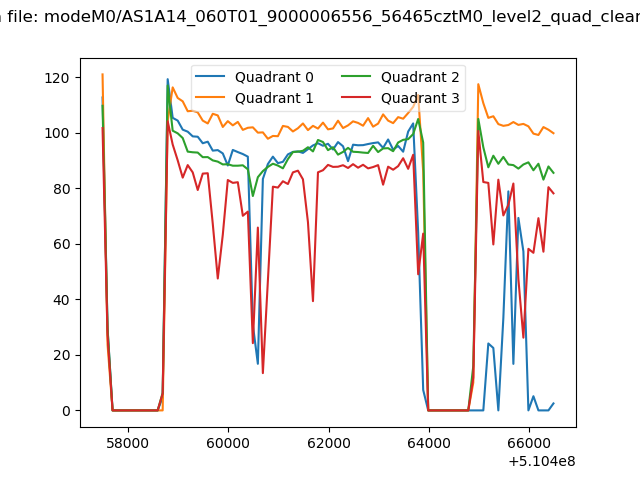 |
|
| Module-wise count rates for Quadrant A Data is divided into 100 sec bins |
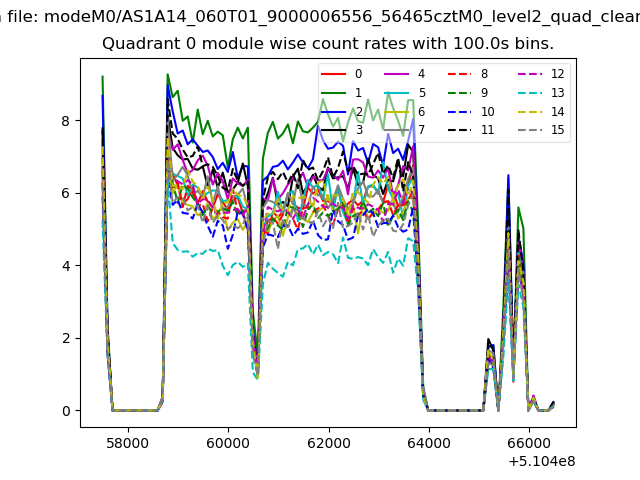 |
 |
| Module-wise count rates for Quadrant B Data is divided into 100 sec bins |
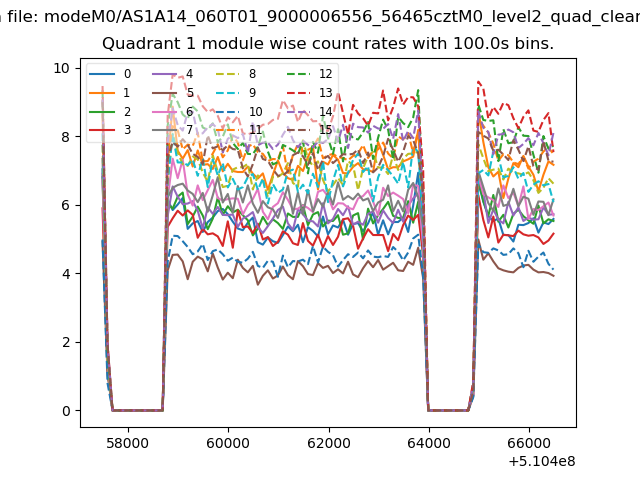 |
 |
| Module-wise count rates for Quadrant C Data is divided into 100 sec bins |
 |
 |
| Module-wise count rates for Quadrant D Data is divided into 100 sec bins |
 |
 |
| Parameter | Plot |
|---|---|
| CZT HV Monitor |  |
| D_VDD |  |
| Temperature 1 |  |
| Veto HV Monitor | 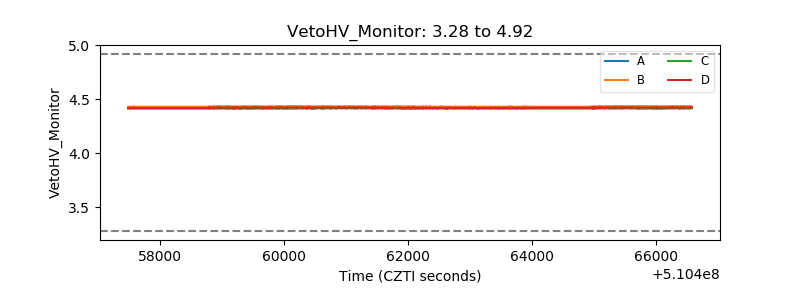 |
| Veto LLD | 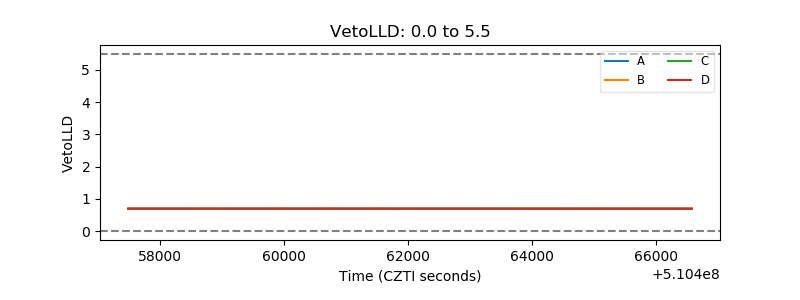 |
| Alpha Counter |  |
| _CPM_Rate | 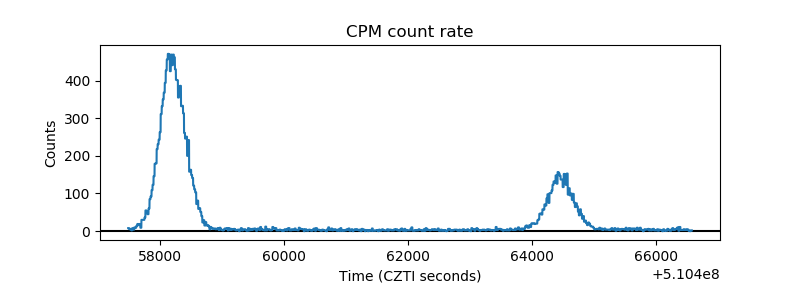 |
| CZT Counter | 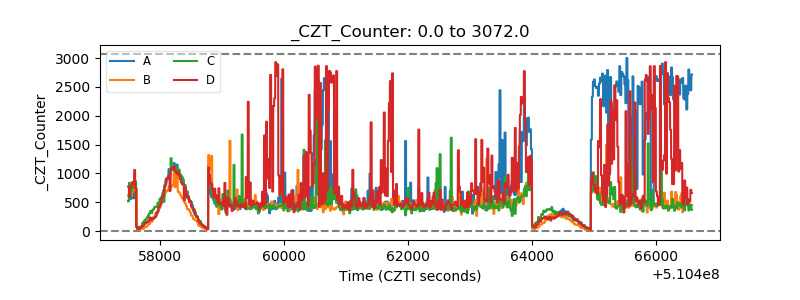 |
| +2.5 Volts monitor |  |
| +5 Volts monitor |  |
| _ROLL_ROT | 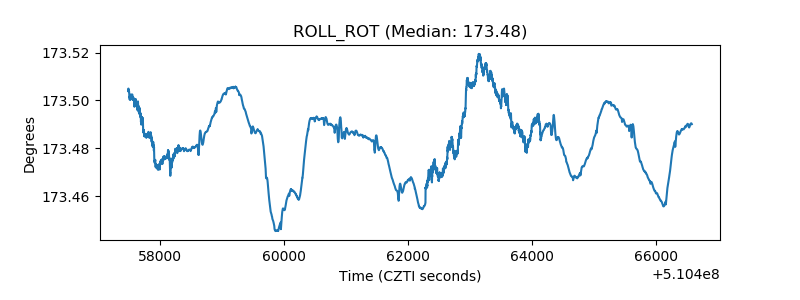 |
| _Roll_DEC | 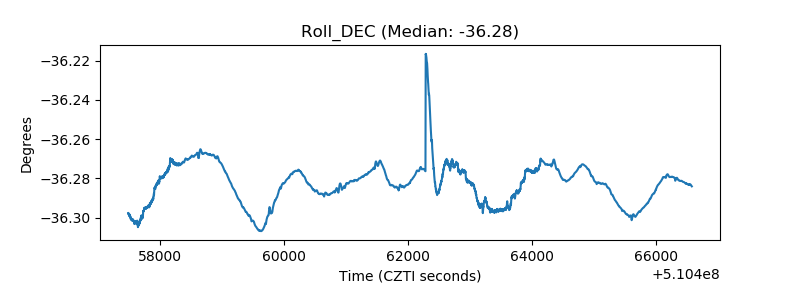 |
| _Roll_RA |  |
| Veto Counter | 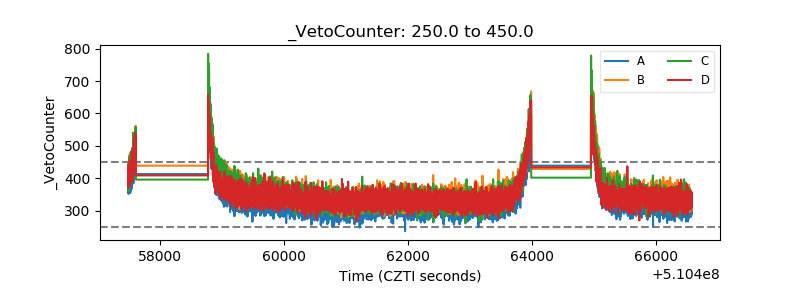 |