| Param | Original file | Final file |
|---|---|---|
| Filename | modeM0/AS1A14_060T01_9000006556_56467cztM0_level2.fits | modeM0/AS1A14_060T01_9000006556_56467cztM0_level2_quad_clean.evt |
| Size (bytes) | 742,034,880 | 103,141,440 |
| Size | 707.7 MB | 98.4 MB |
| Events in quadrant A | 12,104,469 | 492,915 |
| Events in quadrant B | 3,900,227 | 785,716 |
| Events in quadrant C | 5,014,710 | 687,484 |
| Events in quadrant D | 5,844,533 | 614,839 |
| Mode M0 | |||
|---|---|---|---|
| Quadrant | BADHDUFLAG | Total packets | Discarded packets |
| A | 0 | 41307 | 0 |
| B | 0 | 17118 | 0 |
| C | 0 | 20518 | 0 |
| D | 0 | 22638 | 3 |
| Mode SS | |||
|---|---|---|---|
| Quadrant | BADHDUFLAG | Total packets | Discarded packets |
| A | 0 | 156 | 0 |
| B | 0 | 156 | 0 |
| C | 0 | 156 | 0 |
| D | 0 | 156 | 0 |
| Quadrant | Total seconds | Saturated seconds | Saturation percentage |
|---|---|---|---|
| A | 7790 | 2845 | 36.521181% |
| B | 7790 | 170 | 2.182285% |
| C | 7791 | 315 | 4.043127% |
| D | 7790 | 607 | 7.792041% |
Noise dominated data is calculated using 1-second bins in cleaned event files. If a bin has >2000 counts, and if more than 50% of those come from <1% of pixels, then it is considered to be noise-dominated and hence unusable.
| Quadrant | # 1 sec bins | Bins with >0 counts | Bins with >2000 counts | High rate bins dominated by noise | Noise dominated (total time) | Noise dominated (detector-on time) | Marked lightcurve |
|---|---|---|---|---|---|---|---|
| A | 7790 | 7790 | 2503 | 2503 | 32.13% | 32.13% | 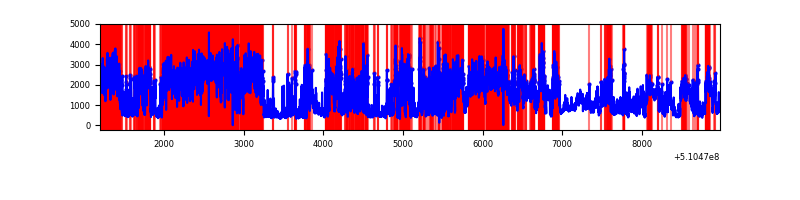 |
| B | 7790 | 7790 | 30 | 30 | 0.39% | 0.39% | 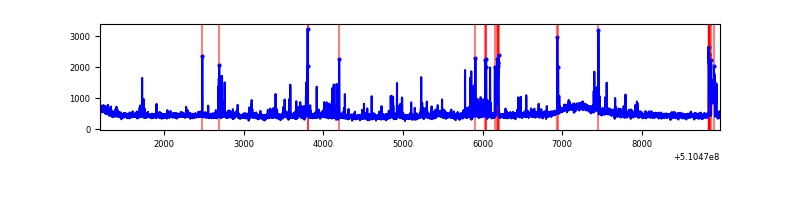 |
| C | 7791 | 7791 | 265 | 265 | 3.40% | 3.40% |  |
| D | 7790 | 7790 | 515 | 515 | 6.61% | 6.61% | 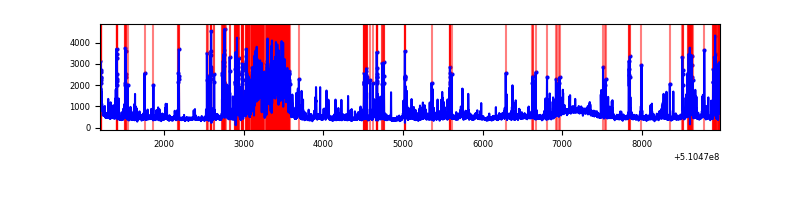 |
Top three noisy pixels from each quadrant. If the there are fewer than three noisy pixels in the level2.evt file, extra rows are filled as -1
| Pixel properties | Quadrant properties | ||||||
|---|---|---|---|---|---|---|---|
| Quadrant | DetID | PixID | Counts | Sigma | Mean | Median | Sigma |
| A | 4 | 95 | 3834544 | 21151.26 | 731 | 713 | 181.3 |
| A | 12 | 3 | 2598497 | 14331.99 | 731 | 713 | 181.3 |
| A | 4 | 206 | 1209804 | 6670.56 | 731 | 713 | 181.3 |
| B | 5 | 172 | 133987 | 735.35 | 851 | 818 | 181.1 |
| B | 0 | 213 | 81031 | 442.93 | 851 | 818 | 181.1 |
| B | 7 | 252 | 69187 | 377.53 | 851 | 818 | 181.1 |
| C | 15 | 230 | 1210728 | 5376.23 | 830 | 823 | 225.0 |
| C | 13 | 3 | 288893 | 1280.04 | 830 | 823 | 225.0 |
| C | 12 | 252 | 104275 | 459.69 | 830 | 823 | 225.0 |
| D | 2 | 249 | 1179590 | 5187.7 | 811 | 773 | 227.2 |
| D | 12 | 4 | 429872 | 1888.36 | 811 | 773 | 227.2 |
| D | 8 | 129 | 240762 | 1056.14 | 811 | 773 | 227.2 |
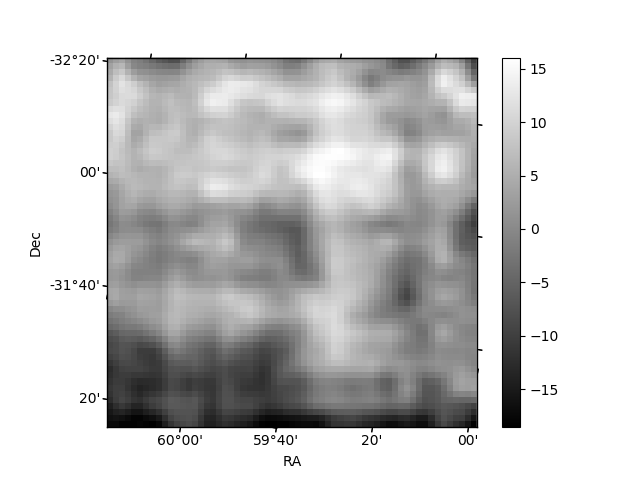
Histogram calculated using DETX and DETY for each event in the final _common_clean file
| Quadrant A | 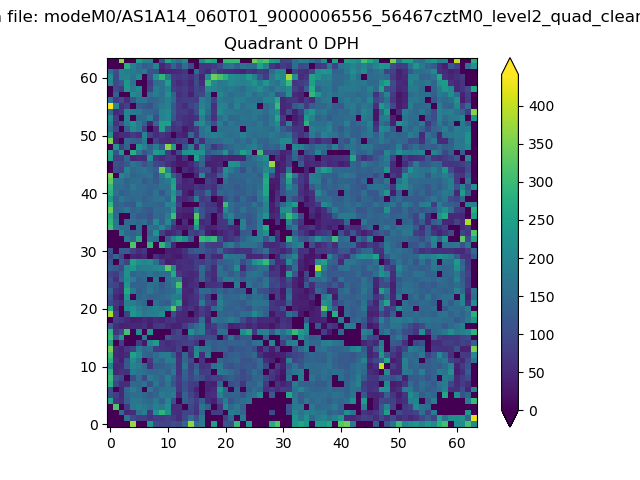 |
 |
Quadrant B |
|---|---|---|---|
| Quadrant D | 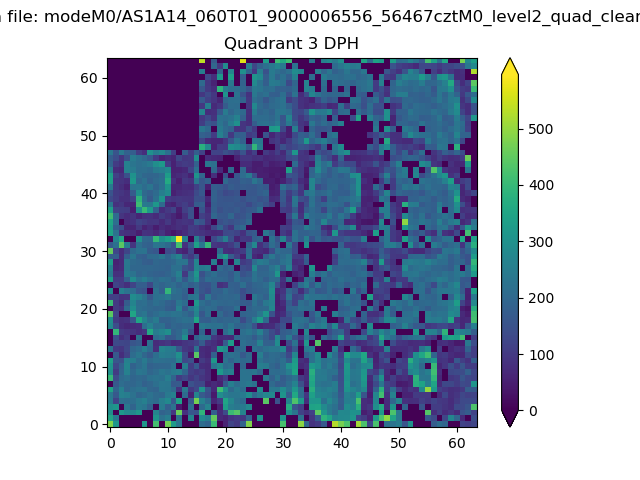 |
 |
Quadrant C |
| Plot type | Count rate plots | Images |
|---|---|---|
| Comparison with Poisson distribution Blue bars denote a histogram of data divided into 1 sec bins. Red curve is a Poisson curve with rate = median count rate of data. |
 |
 |
| Quadrant-wise count rates Data is divided into 100 sec bins |
 |
|
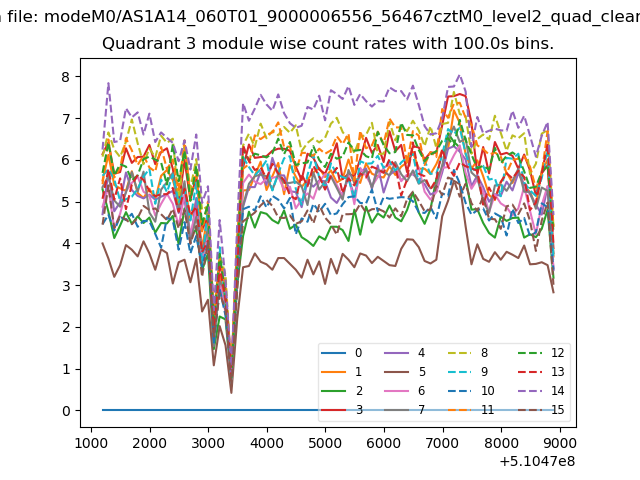
| Module-wise count rates for Quadrant A Data is divided into 100 sec bins |
 |
 |
| Module-wise count rates for Quadrant B Data is divided into 100 sec bins |
 |
 |
| Module-wise count rates for Quadrant C Data is divided into 100 sec bins |
 |
 |
| Module-wise count rates for Quadrant D Data is divided into 100 sec bins |
 |
 |
| Parameter | Plot |
|---|---|
| CZT HV Monitor | 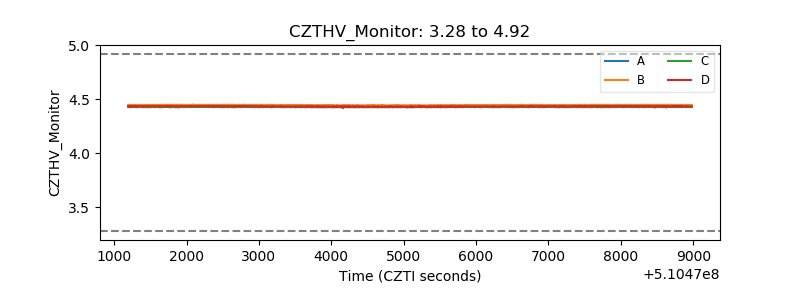 |
| D_VDD |  |
| Temperature 1 | 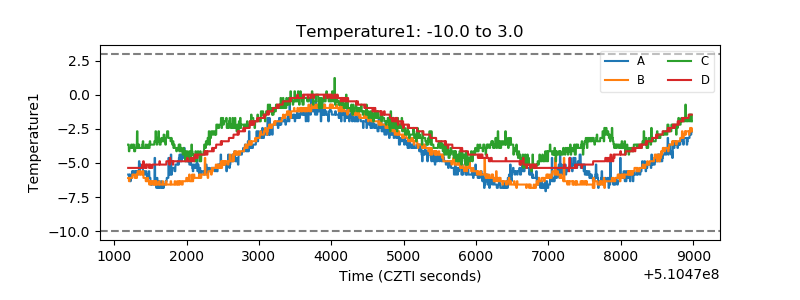 |
| Veto HV Monitor |  |
| Veto LLD |  |
| Alpha Counter |  |
| _CPM_Rate |  |
| CZT Counter | 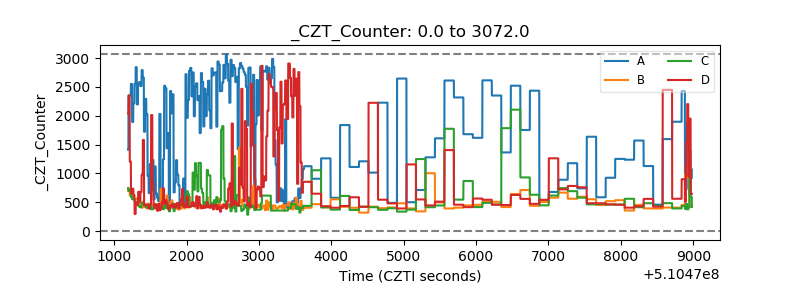 |
| +2.5 Volts monitor | 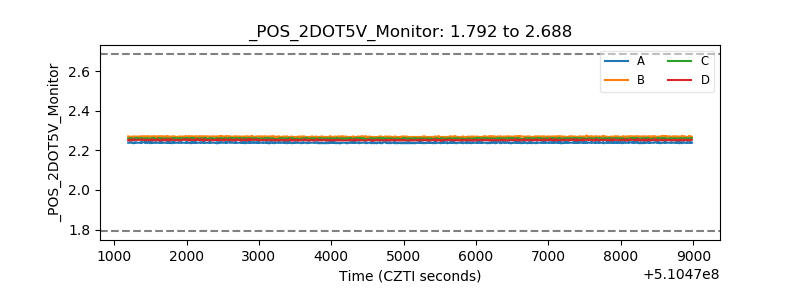 |
| +5 Volts monitor | 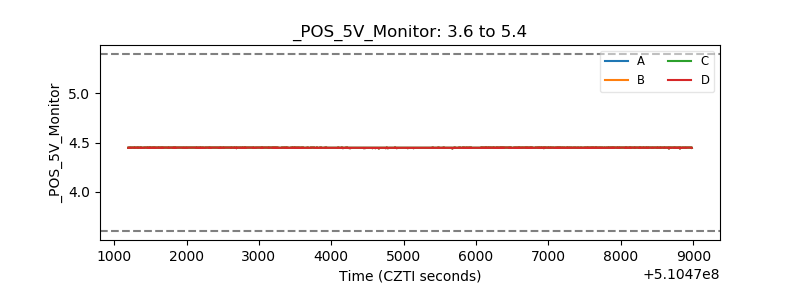 |
| _ROLL_ROT | 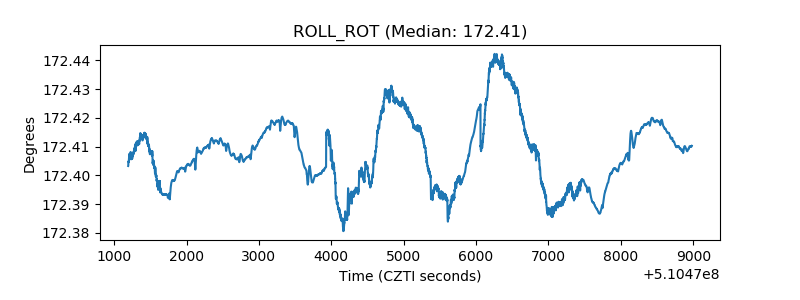 |
| _Roll_DEC | 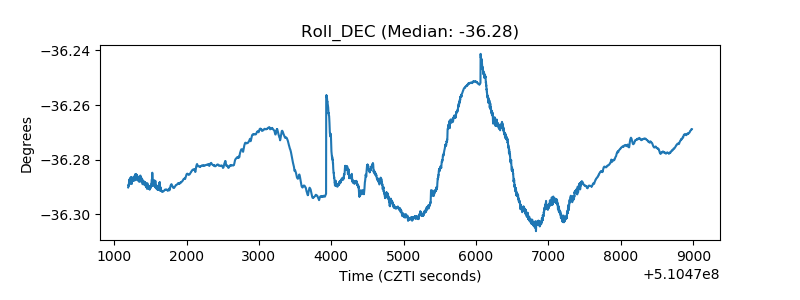 |
| _Roll_RA | 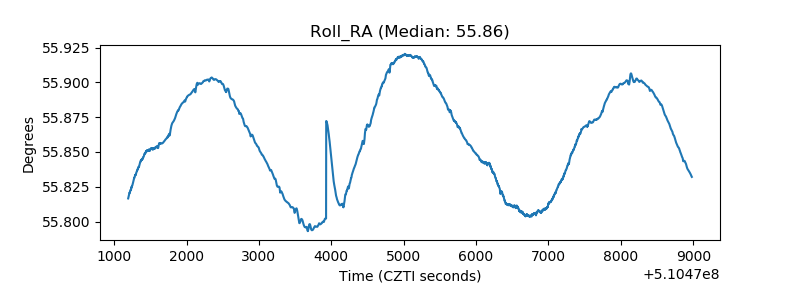 |
| Veto Counter | 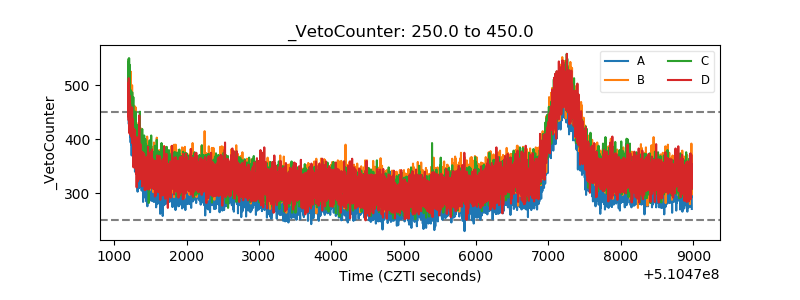 |