| Param | Original file | Final file |
|---|---|---|
| Filename | modeM0/AS1A14_060T01_9000006556_56469cztM0_level2.fits | modeM0/AS1A14_060T01_9000006556_56469cztM0_level2_quad_clean.evt |
| Size (bytes) | 715,919,040 | 107,616,960 |
| Size | 682.8 MB | 102.6 MB |
| Events in quadrant A | 11,280,927 | 534,843 |
| Events in quadrant B | 4,553,872 | 800,374 |
| Events in quadrant C | 4,323,226 | 715,706 |
| Events in quadrant D | 5,722,575 | 651,227 |
| Mode M0 | |||
|---|---|---|---|
| Quadrant | BADHDUFLAG | Total packets | Discarded packets |
| A | 0 | 38994 | 0 |
| B | 0 | 19178 | 0 |
| C | 0 | 18734 | 3 |
| D | 0 | 22240 | 1 |
| Mode SS | |||
|---|---|---|---|
| Quadrant | BADHDUFLAG | Total packets | Discarded packets |
| A | 0 | 160 | 0 |
| B | 0 | 160 | 0 |
| C | 0 | 160 | 0 |
| D | 0 | 160 | 0 |
| Quadrant | Total seconds | Saturated seconds | Saturation percentage |
|---|---|---|---|
| A | 8004 | 2531 | 31.621689% |
| B | 8004 | 224 | 2.798601% |
| C | 8002 | 158 | 1.974506% |
| D | 8003 | 358 | 4.473323% |
Noise dominated data is calculated using 1-second bins in cleaned event files. If a bin has >2000 counts, and if more than 50% of those come from <1% of pixels, then it is considered to be noise-dominated and hence unusable.
| Quadrant | # 1 sec bins | Bins with >0 counts | Bins with >2000 counts | High rate bins dominated by noise | Noise dominated (total time) | Noise dominated (detector-on time) | Marked lightcurve |
|---|---|---|---|---|---|---|---|
| A | 8004 | 8004 | 2193 | 2193 | 27.40% | 27.40% |  |
| B | 8004 | 8004 | 147 | 147 | 1.84% | 1.84% | 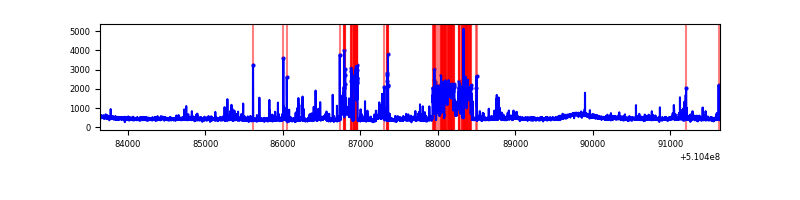 |
| C | 8004 | 8003 | 107 | 107 | 1.34% | 1.34% |  |
| D | 8004 | 8004 | 267 | 267 | 3.34% | 3.34% |  |
Top three noisy pixels from each quadrant. If the there are fewer than three noisy pixels in the level2.evt file, extra rows are filled as -1
| Pixel properties | Quadrant properties | ||||||
|---|---|---|---|---|---|---|---|
| Quadrant | DetID | PixID | Counts | Sigma | Mean | Median | Sigma |
| A | 12 | 3 | 4080616 | 21363.16 | 760 | 740 | 191.0 |
| A | 4 | 206 | 1423461 | 7449.69 | 760 | 740 | 191.0 |
| A | 3 | 14 | 1419092 | 7426.82 | 760 | 740 | 191.0 |
| B | 5 | 172 | 842065 | 4546.21 | 860 | 830 | 185.0 |
| B | 10 | 247 | 56664 | 301.74 | 860 | 830 | 185.0 |
| B | 0 | 153 | 40603 | 214.94 | 860 | 830 | 185.0 |
| C | 13 | 3 | 387524 | 1671.38 | 844 | 836 | 231.4 |
| C | 15 | 230 | 372879 | 1608.08 | 844 | 836 | 231.4 |
| C | 12 | 252 | 98028 | 420.09 | 844 | 836 | 231.4 |
| D | 2 | 249 | 954575 | 4077.09 | 830 | 793 | 233.9 |
| D | 12 | 4 | 549963 | 2347.51 | 830 | 793 | 233.9 |
| D | 9 | 49 | 324050 | 1381.81 | 830 | 793 | 233.9 |
Histogram calculated using DETX and DETY for each event in the final _common_clean file
| Quadrant A | 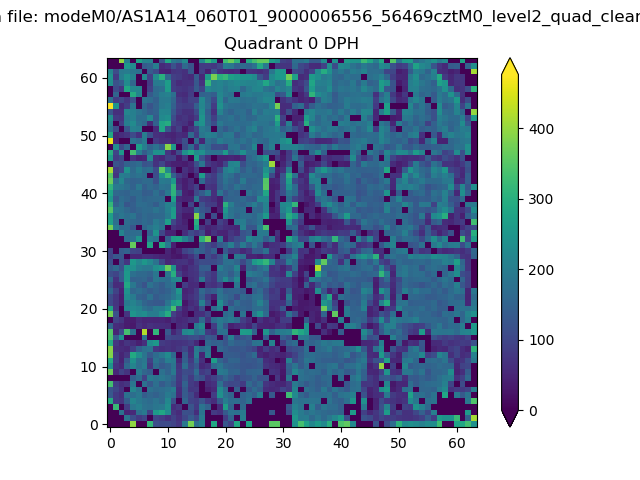 |
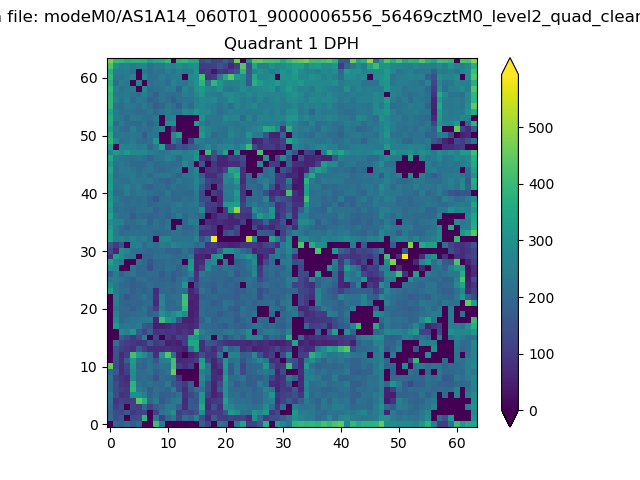 |
Quadrant B |
|---|---|---|---|
| Quadrant D | 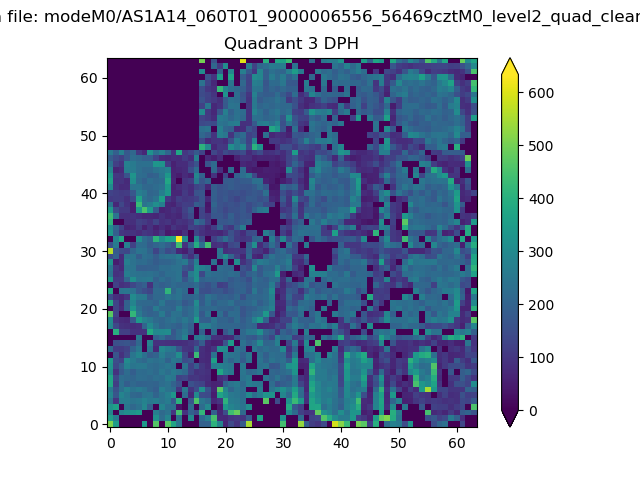 |
 |
Quadrant C |
| Plot type | Count rate plots | Images |
|---|---|---|
| Comparison with Poisson distribution Blue bars denote a histogram of data divided into 1 sec bins. Red curve is a Poisson curve with rate = median count rate of data. |
 |
 |
| Quadrant-wise count rates Data is divided into 100 sec bins |
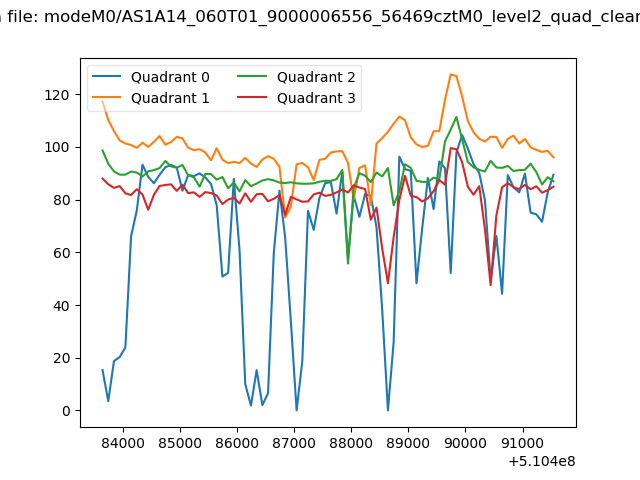 |
|
| Module-wise count rates for Quadrant A Data is divided into 100 sec bins |
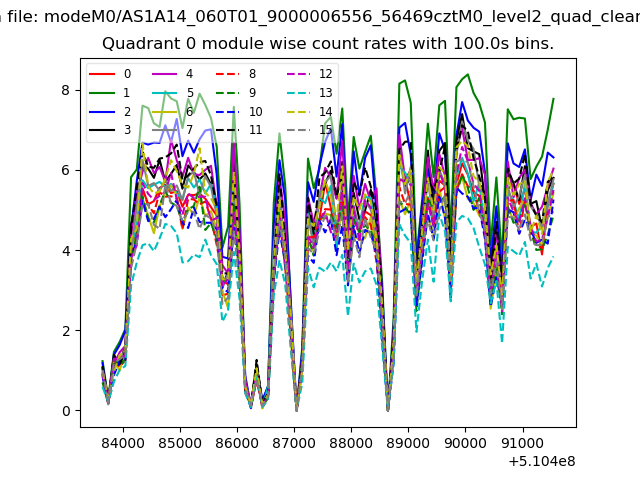 |
 |
| Module-wise count rates for Quadrant B Data is divided into 100 sec bins |
 |
 |
| Module-wise count rates for Quadrant C Data is divided into 100 sec bins |
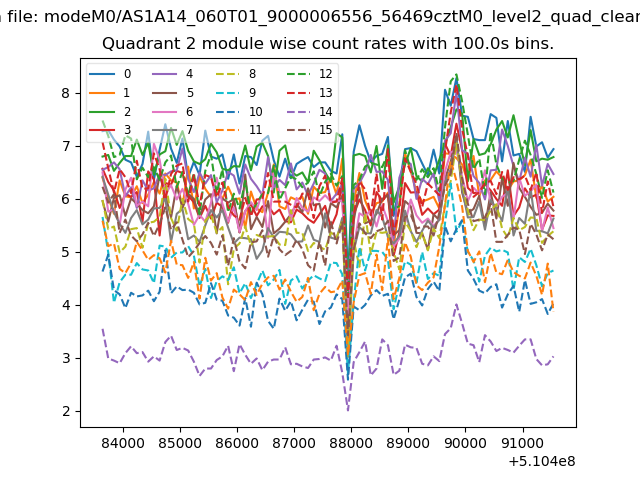 |
 |
| Module-wise count rates for Quadrant D Data is divided into 100 sec bins |
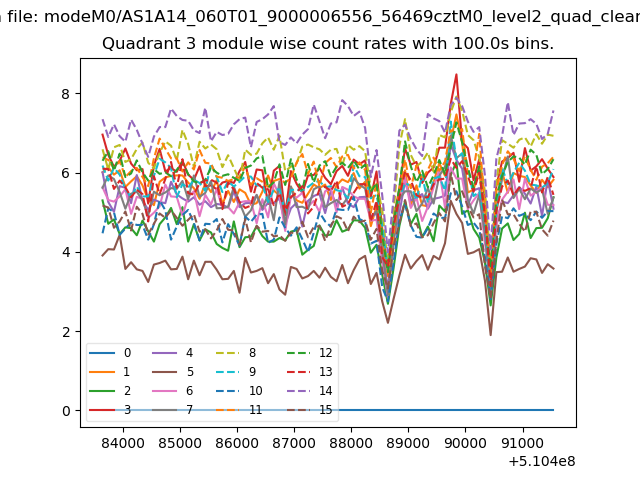 |
 |
| Parameter | Plot |
|---|---|
| CZT HV Monitor | 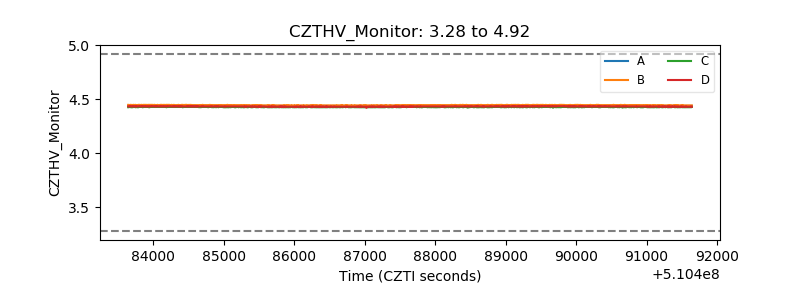 |
| D_VDD |  |
| Temperature 1 | 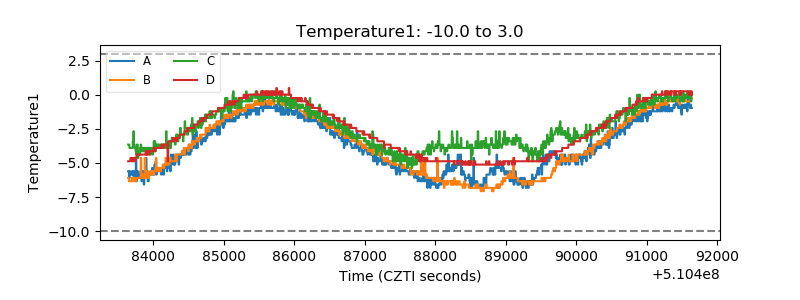 |
| Veto HV Monitor | 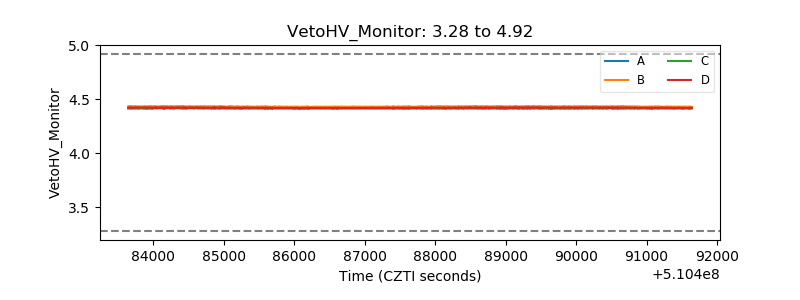 |
| Veto LLD |  |
| Alpha Counter |  |
| _CPM_Rate |  |
| CZT Counter | 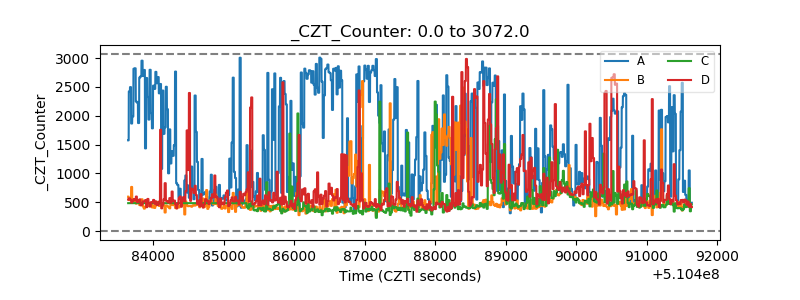 |
| +2.5 Volts monitor | 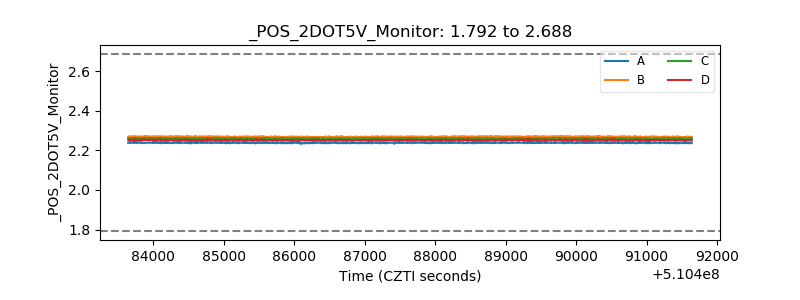 |
| +5 Volts monitor |  |
| _ROLL_ROT | 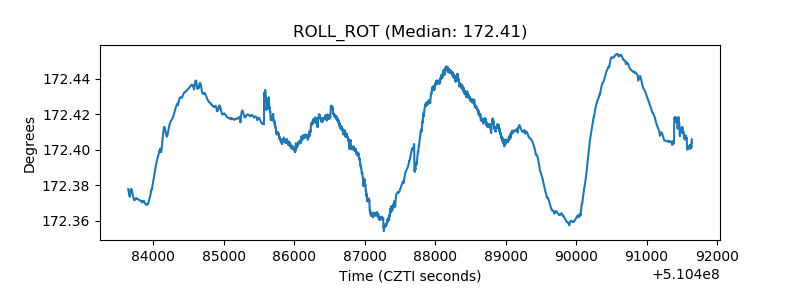 |
| _Roll_DEC | 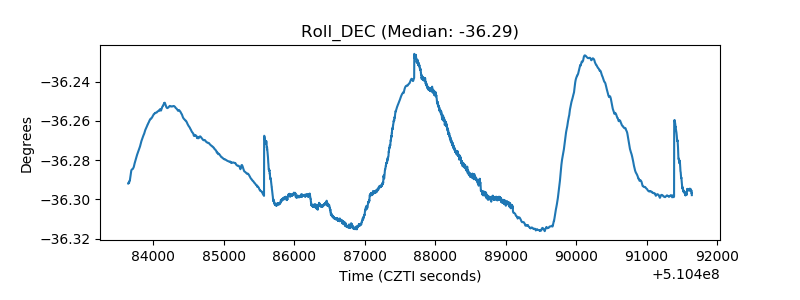 |
| _Roll_RA |  |
| Veto Counter | 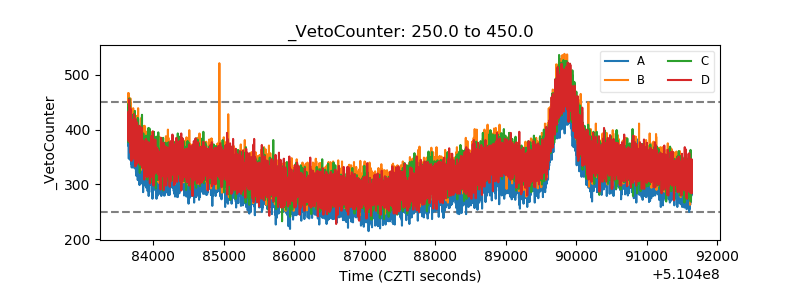 |