| Param | Original file | Final file |
|---|---|---|
| Filename | modeM0/AS1A14_060T01_9000006556_56472cztM0_level2.fits | modeM0/AS1A14_060T01_9000006556_56472cztM0_level2_quad_clean.evt |
| Size (bytes) | 1,722,208,320 | 235,103,040 |
| Size | 1.6 GB | 224.2 MB |
| Events in quadrant A | 23,590,453 | 1,203,905 |
| Events in quadrant B | 9,502,660 | 1,783,707 |
| Events in quadrant C | 13,604,006 | 1,499,607 |
| Events in quadrant D | 15,627,781 | 1,358,067 |
| Mode M0 | |||
|---|---|---|---|
| Quadrant | BADHDUFLAG | Total packets | Discarded packets |
| A | 0 | 82928 | 4 |
| B | 0 | 41548 | 4 |
| C | 0 | 53546 | 5 |
| D | 0 | 58826 | 4 |
| Mode M9 | |||
|---|---|---|---|
| Quadrant | BADHDUFLAG | Total packets | Discarded packets |
| A | 0 | 13 | 0 |
| B | 0 | 13 | 0 |
| C | 0 | 13 | 0 |
| D | 0 | 13 | 0 |
| Mode SS | |||
|---|---|---|---|
| Quadrant | BADHDUFLAG | Total packets | Discarded packets |
| A | 0 | 376 | 0 |
| B | 0 | 376 | 0 |
| C | 0 | 376 | 0 |
| D | 0 | 376 | 0 |
| Quadrant | Total seconds | Saturated seconds | Saturation percentage |
|---|---|---|---|
| A | 18453 | 5284 | 28.634910% |
| B | 18453 | 598 | 3.240665% |
| C | 18452 | 1601 | 8.676566% |
| D | 18452 | 1810 | 9.809235% |
Noise dominated data is calculated using 1-second bins in cleaned event files. If a bin has >2000 counts, and if more than 50% of those come from <1% of pixels, then it is considered to be noise-dominated and hence unusable.
| Quadrant | # 1 sec bins | Bins with >0 counts | Bins with >2000 counts | High rate bins dominated by noise | Noise dominated (total time) | Noise dominated (detector-on time) | Marked lightcurve |
|---|---|---|---|---|---|---|---|
| A | 19838 | 18456 | 4202 | 4202 | 21.18% | 22.77% |  |
| B | 19838 | 18457 | 260 | 260 | 1.31% | 1.41% |  |
| C | 19837 | 18456 | 1118 | 1118 | 5.64% | 6.06% | 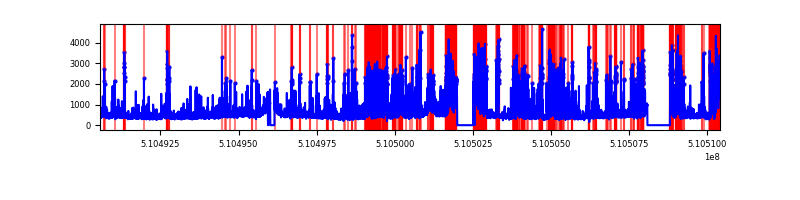 |
| D | 19837 | 18455 | 1505 | 1505 | 7.59% | 8.15% |  |
Top three noisy pixels from each quadrant. If the there are fewer than three noisy pixels in the level2.evt file, extra rows are filled as -1
| Pixel properties | Quadrant properties | ||||||
|---|---|---|---|---|---|---|---|
| Quadrant | DetID | PixID | Counts | Sigma | Mean | Median | Sigma |
| A | 7 | 64 | 10241989 | 23281.73 | 1751 | 1705 | 439.8 |
| A | 4 | 95 | 1403242 | 3186.46 | 1751 | 1705 | 439.8 |
| A | 4 | 206 | 1191707 | 2705.52 | 1751 | 1705 | 439.8 |
| B | 5 | 172 | 648147 | 1555.7 | 1953 | 1876 | 415.4 |
| B | 0 | 231 | 186633 | 444.75 | 1953 | 1876 | 415.4 |
| B | 0 | 63 | 142324 | 338.08 | 1953 | 1876 | 415.4 |
| C | 15 | 230 | 3437597 | 6695.27 | 1856 | 1840 | 513.2 |
| C | 12 | 252 | 1230576 | 2394.44 | 1856 | 1840 | 513.2 |
| C | 13 | 3 | 641914 | 1247.31 | 1856 | 1840 | 513.2 |
| D | 12 | 33 | 4029047 | 7832.14 | 1842 | 1762 | 514.2 |
| D | 2 | 249 | 1491578 | 2897.35 | 1842 | 1762 | 514.2 |
| D | 5 | 113 | 453329 | 878.19 | 1842 | 1762 | 514.2 |
Histogram calculated using DETX and DETY for each event in the final _common_clean file
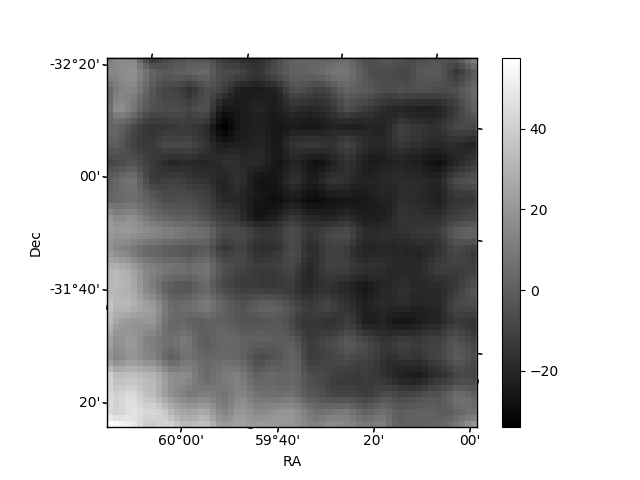
| Quadrant A | 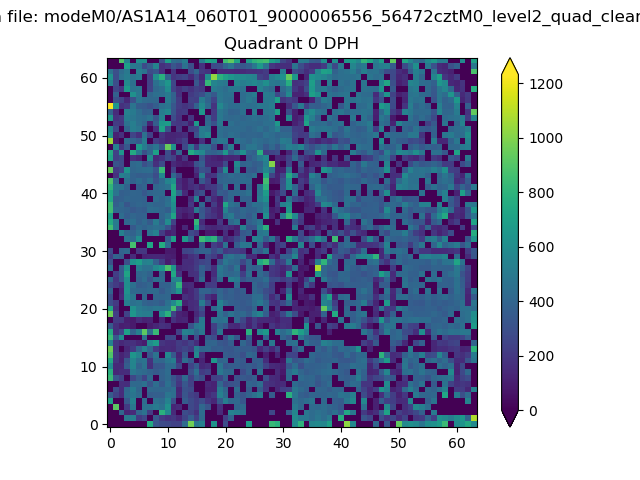 |
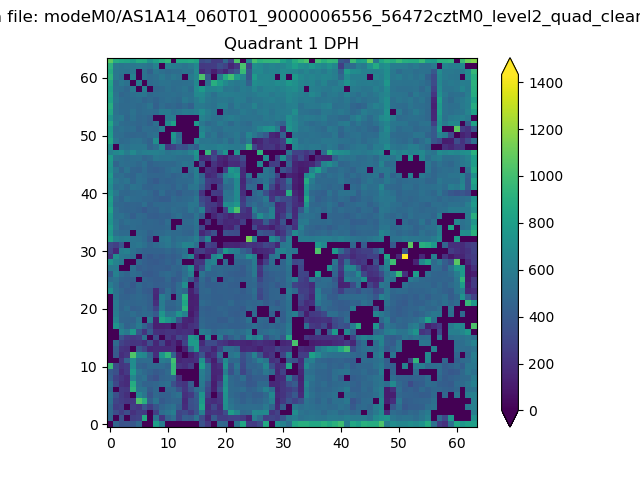 |
Quadrant B |
|---|---|---|---|
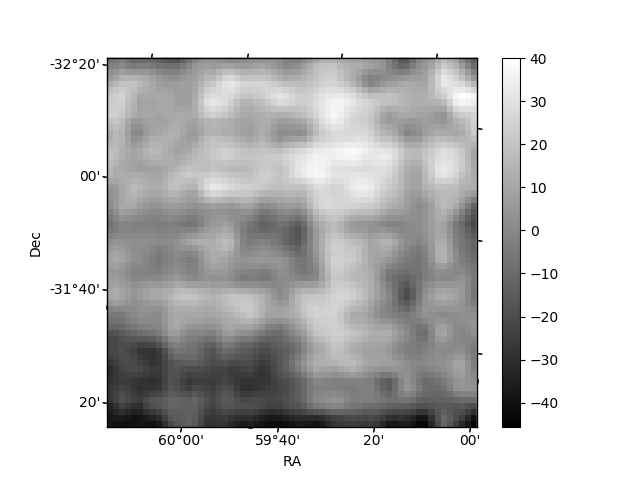
| Quadrant D | 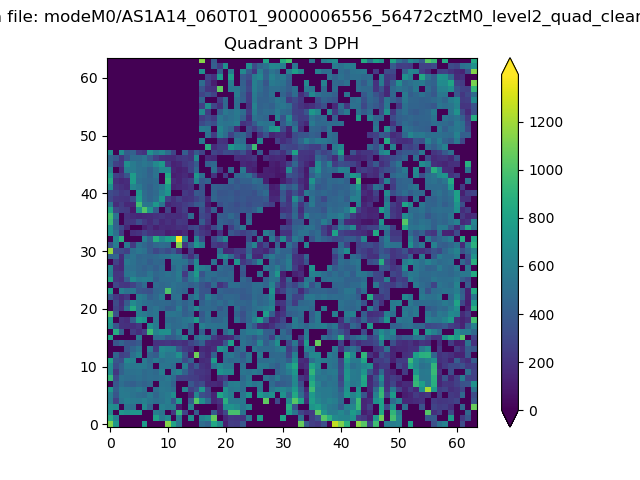 |
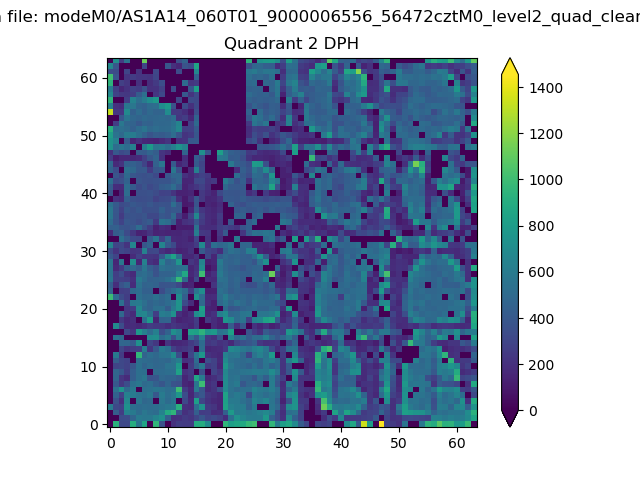 |
Quadrant C |
| Plot type | Count rate plots | Images |
|---|---|---|
| Comparison with Poisson distribution Blue bars denote a histogram of data divided into 1 sec bins. Red curve is a Poisson curve with rate = median count rate of data. |
 |
 |
| Quadrant-wise count rates Data is divided into 100 sec bins |
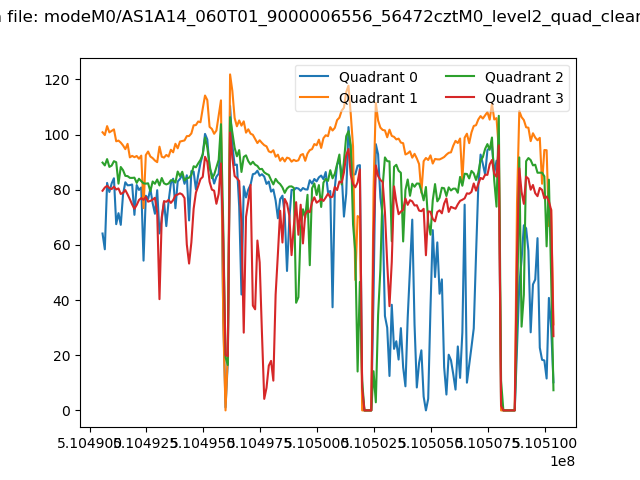 |
|
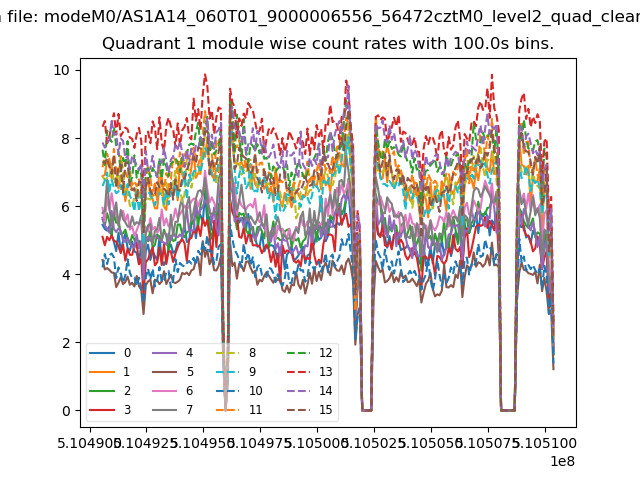
| Module-wise count rates for Quadrant A Data is divided into 100 sec bins |
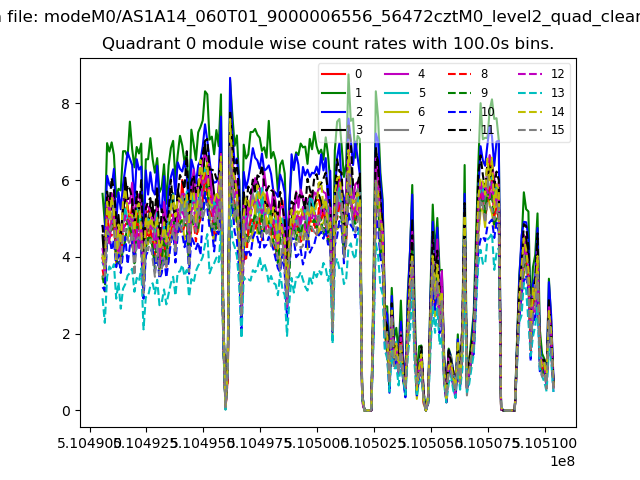 |
 |
| Module-wise count rates for Quadrant B Data is divided into 100 sec bins |
 |
 |
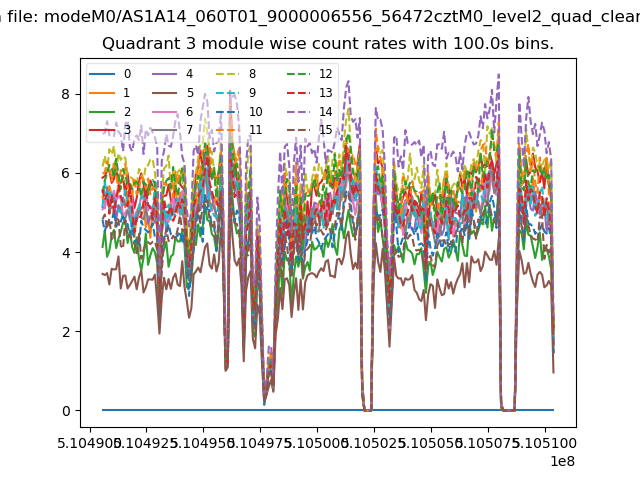
| Module-wise count rates for Quadrant C Data is divided into 100 sec bins |
 |
 |
| Module-wise count rates for Quadrant D Data is divided into 100 sec bins |
 |
 |
| Parameter | Plot |
|---|---|
| CZT HV Monitor |  |
| D_VDD | 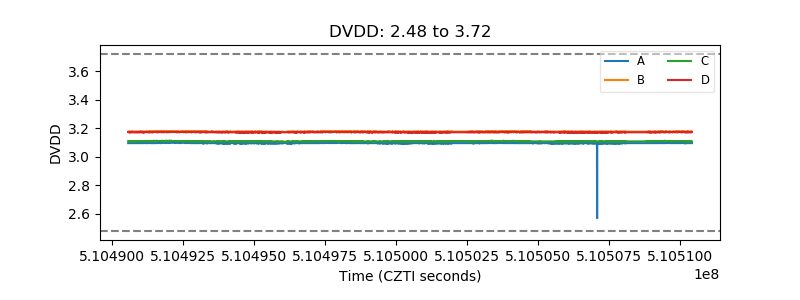 |
| Temperature 1 |  |
| Veto HV Monitor | 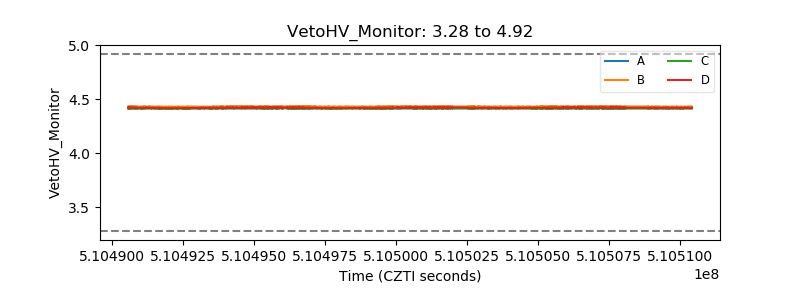 |
| Veto LLD | 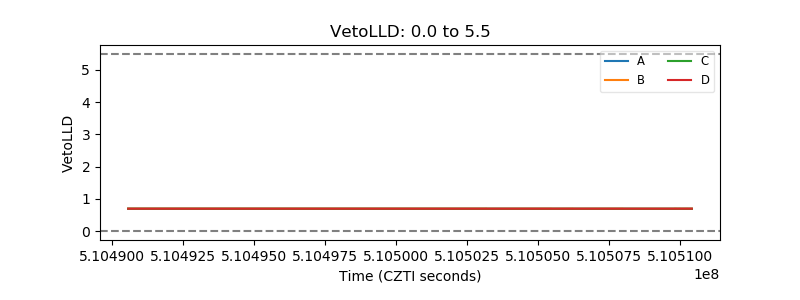 |
| Alpha Counter |  |
| _CPM_Rate |  |
| CZT Counter | 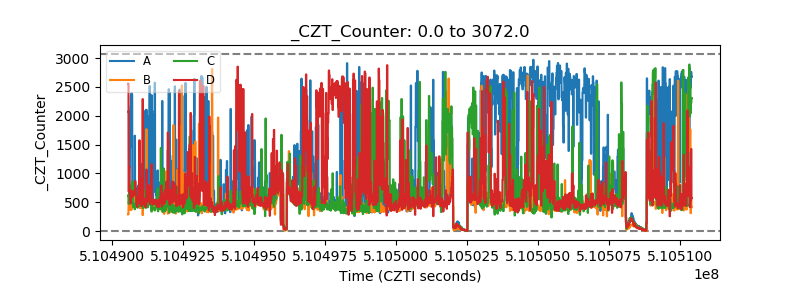 |
| +2.5 Volts monitor | 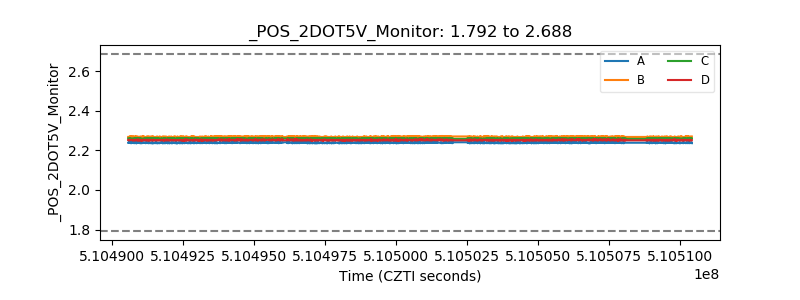 |
| +5 Volts monitor |  |
| _ROLL_ROT | 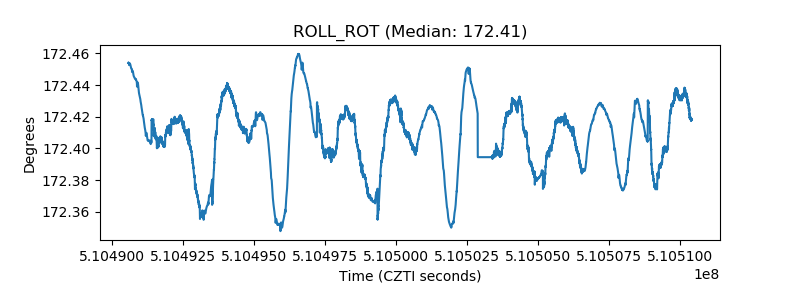 |
| _Roll_DEC | 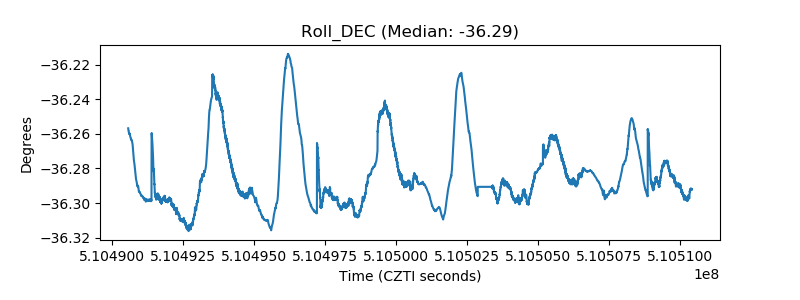 |
| _Roll_RA | 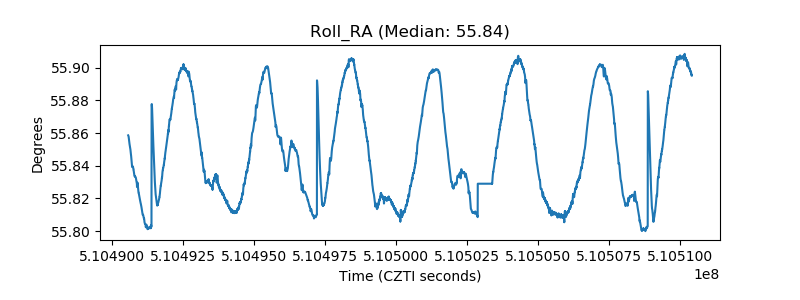 |
| Veto Counter | 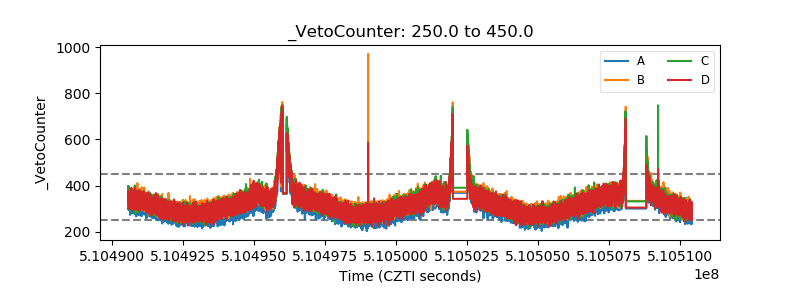 |