| Param | Original file | Final file |
|---|---|---|
| Filename | modeM0/AS1A14_060T01_9000006556_56473cztM0_level2.fits | modeM0/AS1A14_060T01_9000006556_56473cztM0_level2_quad_clean.evt |
| Size (bytes) | 724,083,840 | 78,897,600 |
| Size | 690.5 MB | 75.2 MB |
| Events in quadrant A | 12,408,398 | 299,710 |
| Events in quadrant B | 3,672,828 | 616,548 |
| Events in quadrant C | 6,039,940 | 493,528 |
| Events in quadrant D | 4,184,155 | 530,268 |
| Mode M0 | |||
|---|---|---|---|
| Quadrant | BADHDUFLAG | Total packets | Discarded packets |
| A | 0 | 41339 | 5 |
| B | 0 | 15497 | 1 |
| C | 0 | 22490 | 1 |
| D | 0 | 16964 | 1 |
| Mode M9 | |||
|---|---|---|---|
| Quadrant | BADHDUFLAG | Total packets | Discarded packets |
| A | 0 | 8 | 0 |
| B | 0 | 8 | 0 |
| C | 0 | 8 | 0 |
| D | 0 | 8 | 0 |
| Mode SS | |||
|---|---|---|---|
| Quadrant | BADHDUFLAG | Total packets | Discarded packets |
| A | 0 | 132 | 0 |
| B | 0 | 132 | 0 |
| C | 0 | 132 | 0 |
| D | 0 | 132 | 0 |
| Quadrant | Total seconds | Saturated seconds | Saturation percentage |
|---|---|---|---|
| A | 6423 | 3509 | 54.631792% |
| B | 6424 | 285 | 4.436488% |
| C | 6424 | 1055 | 16.422790% |
| D | 6424 | 175 | 2.724159% |
Noise dominated data is calculated using 1-second bins in cleaned event files. If a bin has >2000 counts, and if more than 50% of those come from <1% of pixels, then it is considered to be noise-dominated and hence unusable.
| Quadrant | # 1 sec bins | Bins with >0 counts | Bins with >2000 counts | High rate bins dominated by noise | Noise dominated (total time) | Noise dominated (detector-on time) | Marked lightcurve |
|---|---|---|---|---|---|---|---|
| A | 7292 | 6422 | 3017 | 3017 | 41.37% | 46.98% |  |
| B | 7294 | 6425 | 163 | 163 | 2.23% | 2.54% |  |
| C | 7294 | 6425 | 1060 | 1060 | 14.53% | 16.50% | 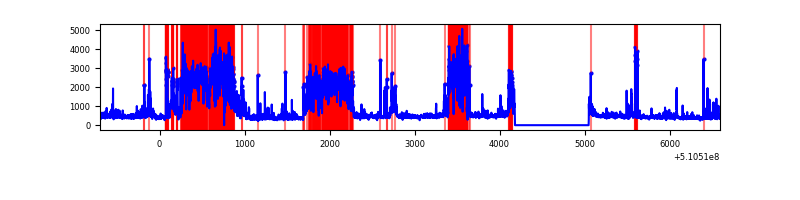 |
| D | 7294 | 6425 | 157 | 157 | 2.15% | 2.44% |  |
Top three noisy pixels from each quadrant. If the there are fewer than three noisy pixels in the level2.evt file, extra rows are filled as -1
| Pixel properties | Quadrant properties | ||||||
|---|---|---|---|---|---|---|---|
| Quadrant | DetID | PixID | Counts | Sigma | Mean | Median | Sigma |
| A | 7 | 64 | 6469040 | 51963.78 | 495 | 483 | 124.5 |
| A | 4 | 95 | 2457782 | 19740.19 | 495 | 483 | 124.5 |
| A | 0 | 8 | 831591 | 6676.53 | 495 | 483 | 124.5 |
| B | 5 | 172 | 644226 | 4500.58 | 660 | 637 | 143.0 |
| B | 10 | 246 | 142221 | 990.09 | 660 | 637 | 143.0 |
| B | 0 | 63 | 107528 | 747.48 | 660 | 637 | 143.0 |
| C | 13 | 3 | 2853524 | 16913.53 | 611 | 608 | 168.7 |
| C | 12 | 252 | 357082 | 2113.36 | 611 | 608 | 168.7 |
| C | 15 | 230 | 335412 | 1984.89 | 611 | 608 | 168.7 |
| D | 2 | 249 | 671039 | 3652.47 | 643 | 614 | 183.6 |
| D | 3 | 12 | 305352 | 1660.21 | 643 | 614 | 183.6 |
| D | 8 | 31 | 222423 | 1208.42 | 643 | 614 | 183.6 |
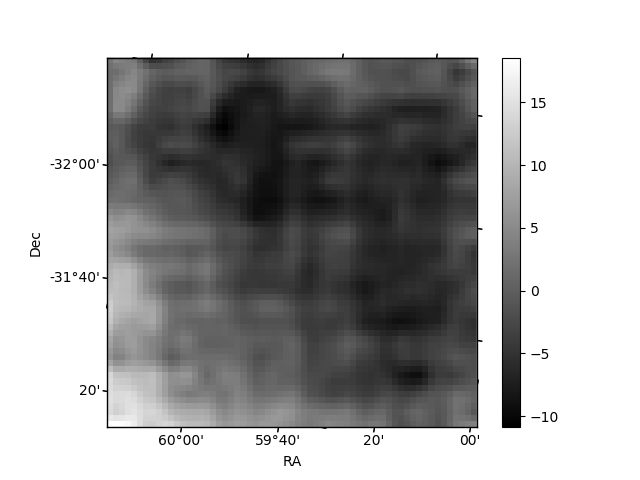
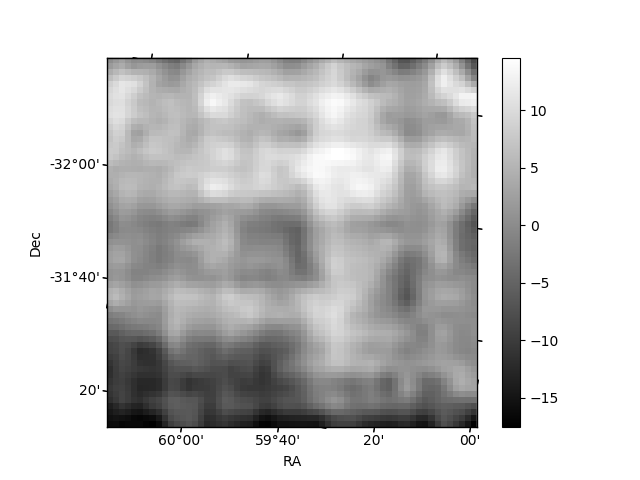
Histogram calculated using DETX and DETY for each event in the final _common_clean file
| Quadrant A | 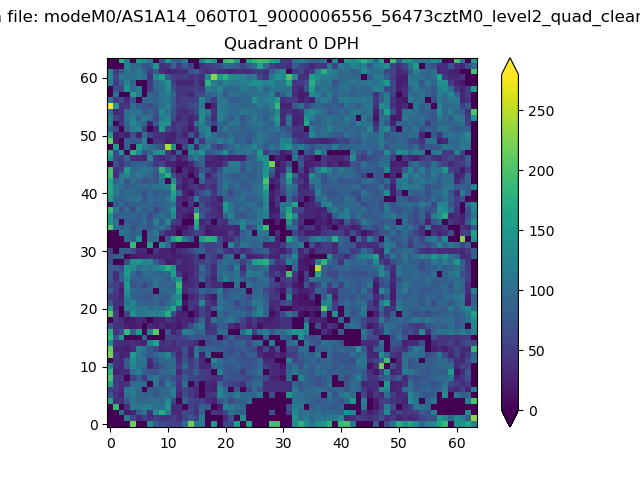 |
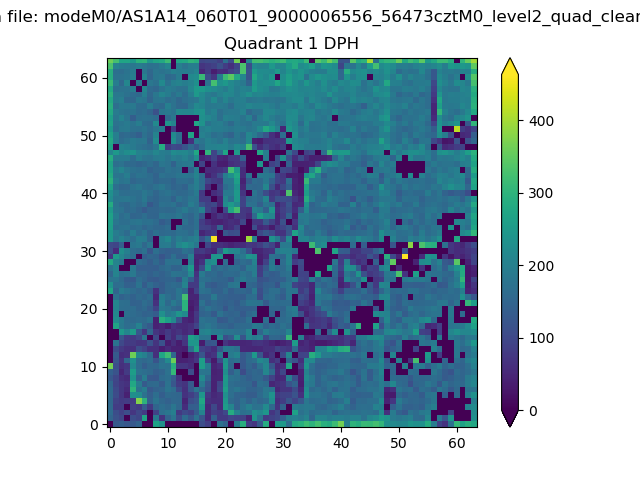 |
Quadrant B |
|---|---|---|---|
| Quadrant D |  |
 |
Quadrant C |
| Plot type | Count rate plots | Images |
|---|---|---|
| Comparison with Poisson distribution Blue bars denote a histogram of data divided into 1 sec bins. Red curve is a Poisson curve with rate = median count rate of data. |
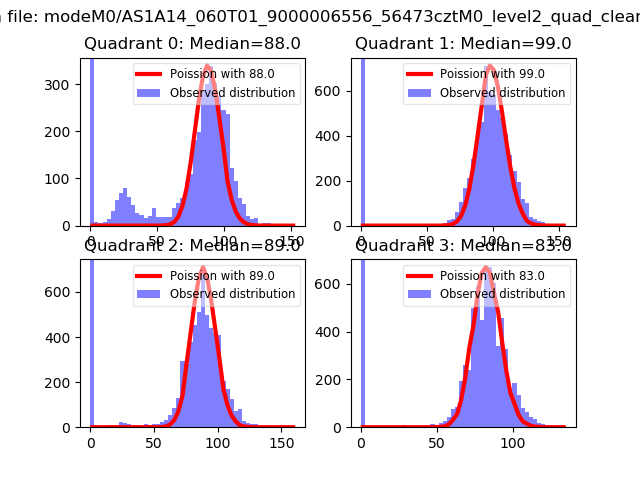 |
 |
| Quadrant-wise count rates Data is divided into 100 sec bins |
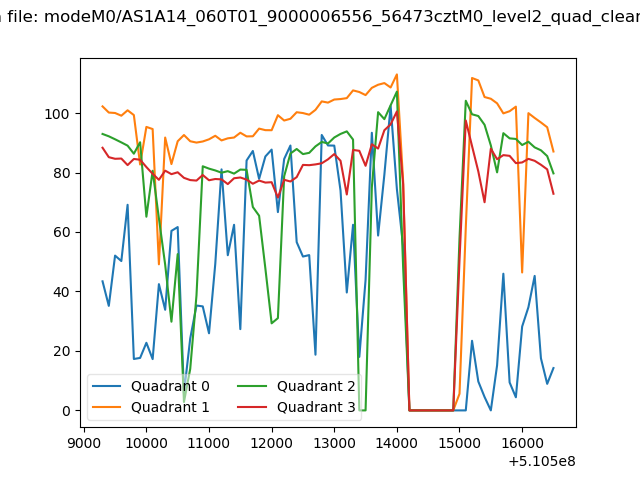 |
|
| Module-wise count rates for Quadrant A Data is divided into 100 sec bins |
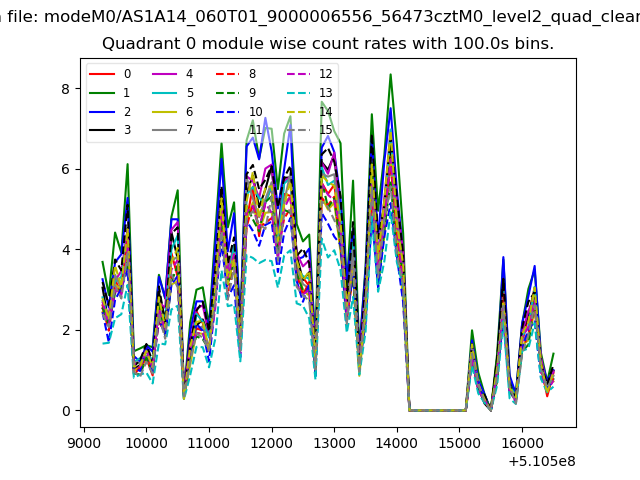 |
 |
| Module-wise count rates for Quadrant B Data is divided into 100 sec bins |
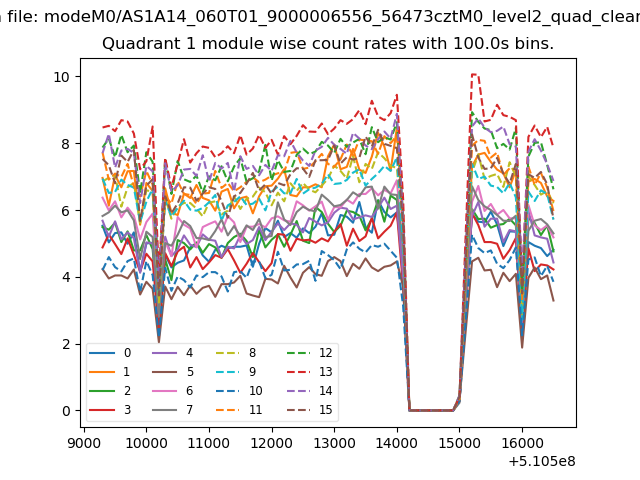 |
 |
| Module-wise count rates for Quadrant C Data is divided into 100 sec bins |
 |
 |
| Module-wise count rates for Quadrant D Data is divided into 100 sec bins |
 |
 |
| Parameter | Plot |
|---|---|
| CZT HV Monitor |  |
| D_VDD |  |
| Temperature 1 |  |
| Veto HV Monitor | 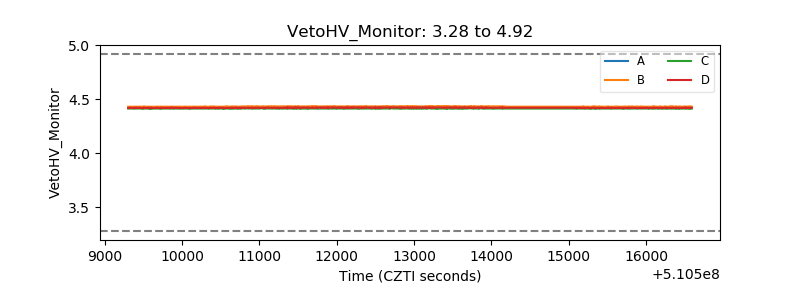 |
| Veto LLD | 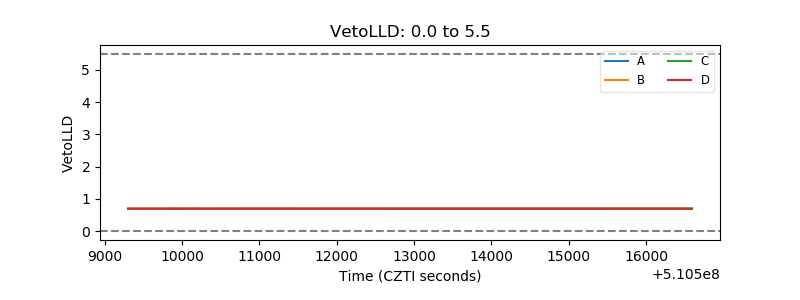 |
| Alpha Counter |  |
| _CPM_Rate | 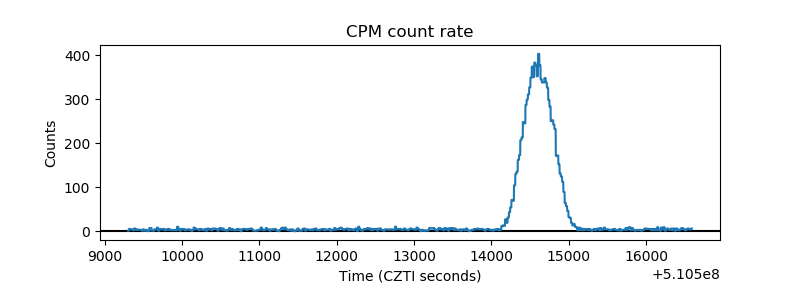 |
| CZT Counter | 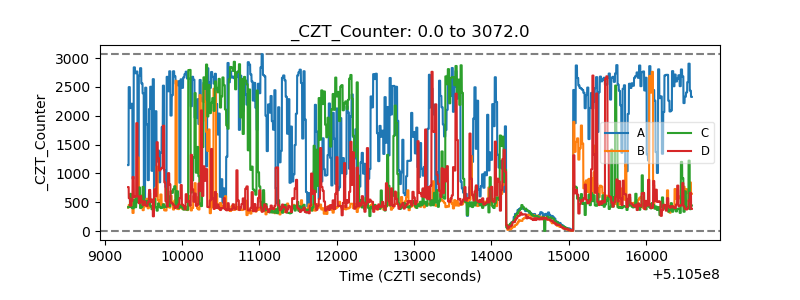 |
| +2.5 Volts monitor |  |
| +5 Volts monitor |  |
| _ROLL_ROT | 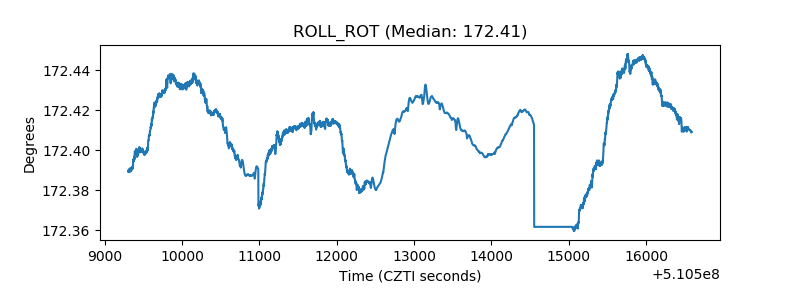 |
| _Roll_DEC | 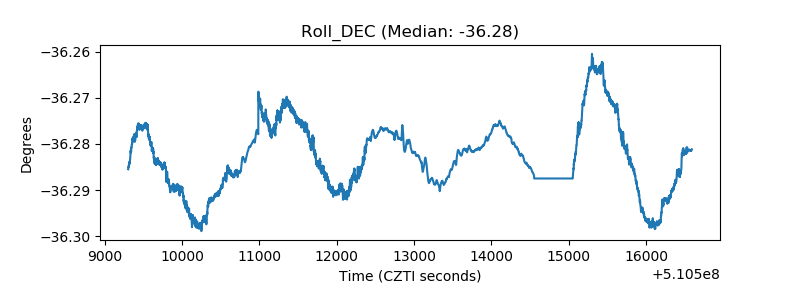 |
| _Roll_RA |  |
| Veto Counter | 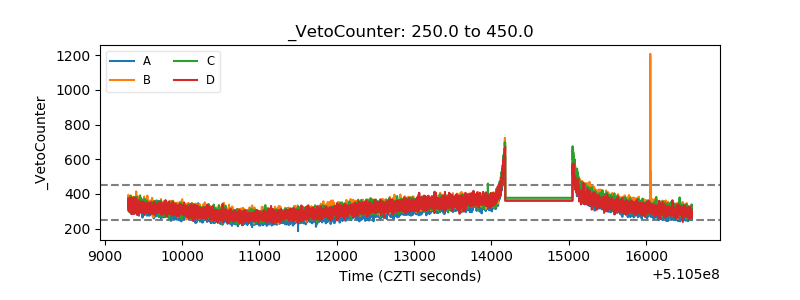 |