| Param | Original file | Final file |
|---|---|---|
| Filename | modeM0/AS1A14_060T01_9000006556_56476cztM0_level2.fits | modeM0/AS1A14_060T01_9000006556_56476cztM0_level2_quad_clean.evt |
| Size (bytes) | 667,244,160 | 82,388,160 |
| Size | 636.3 MB | 78.6 MB |
| Events in quadrant A | 11,558,253 | 412,077 |
| Events in quadrant B | 4,156,659 | 611,807 |
| Events in quadrant C | 3,294,431 | 540,057 |
| Events in quadrant D | 5,186,671 | 476,917 |
| Mode M0 | |||
|---|---|---|---|
| Quadrant | BADHDUFLAG | Total packets | Discarded packets |
| A | 0 | 38834 | 2 |
| B | 0 | 16708 | 2 |
| C | 0 | 14655 | 2 |
| D | 0 | 19846 | 2 |
| Mode M9 | |||
|---|---|---|---|
| Quadrant | BADHDUFLAG | Total packets | Discarded packets |
| A | 0 | 17 | 0 |
| B | 0 | 17 | 0 |
| C | 0 | 18 | 0 |
| D | 0 | 18 | 0 |
| Mode SS | |||
|---|---|---|---|
| Quadrant | BADHDUFLAG | Total packets | Discarded packets |
| A | 0 | 132 | 0 |
| B | 0 | 132 | 0 |
| C | 0 | 132 | 0 |
| D | 0 | 132 | 0 |
| Quadrant | Total seconds | Saturated seconds | Saturation percentage |
|---|---|---|---|
| A | 6499 | 2455 | 37.775042% |
| B | 6499 | 117 | 1.800277% |
| C | 6499 | 101 | 1.554085% |
| D | 6499 | 480 | 7.385752% |
Noise dominated data is calculated using 1-second bins in cleaned event files. If a bin has >2000 counts, and if more than 50% of those come from <1% of pixels, then it is considered to be noise-dominated and hence unusable.
| Quadrant | # 1 sec bins | Bins with >0 counts | Bins with >2000 counts | High rate bins dominated by noise | Noise dominated (total time) | Noise dominated (detector-on time) | Marked lightcurve |
|---|---|---|---|---|---|---|---|
| A | 7926 | 6776 | 2730 | 2730 | 34.44% | 40.29% |  |
| B | 7926 | 6782 | 50 | 50 | 0.63% | 0.74% |  |
| C | 7926 | 6782 | 72 | 72 | 0.91% | 1.06% | 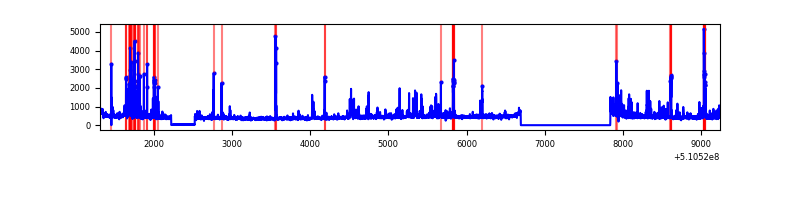 |
| D | 7926 | 6782 | 449 | 449 | 5.66% | 6.62% |  |
Top three noisy pixels from each quadrant. If the there are fewer than three noisy pixels in the level2.evt file, extra rows are filled as -1
| Pixel properties | Quadrant properties | ||||||
|---|---|---|---|---|---|---|---|
| Quadrant | DetID | PixID | Counts | Sigma | Mean | Median | Sigma |
| A | 4 | 95 | 7433297 | 46586.52 | 639 | 624 | 159.5 |
| A | 7 | 64 | 1017282 | 6372.21 | 639 | 624 | 159.5 |
| A | 3 | 14 | 224927 | 1405.89 | 639 | 624 | 159.5 |
| B | 5 | 236 | 494413 | 3307.73 | 697 | 675 | 149.3 |
| B | 5 | 172 | 433227 | 2897.83 | 697 | 675 | 149.3 |
| B | 0 | 63 | 190287 | 1270.28 | 697 | 675 | 149.3 |
| C | 13 | 3 | 438765 | 2332.66 | 677 | 670 | 187.8 |
| C | 12 | 252 | 89472 | 472.83 | 677 | 670 | 187.8 |
| C | 15 | 244 | 38572 | 201.81 | 677 | 670 | 187.8 |
| D | 12 | 4 | 965446 | 5190.72 | 651 | 624 | 185.9 |
| D | 2 | 249 | 889088 | 4779.92 | 651 | 624 | 185.9 |
| D | 8 | 129 | 187817 | 1007.09 | 651 | 624 | 185.9 |
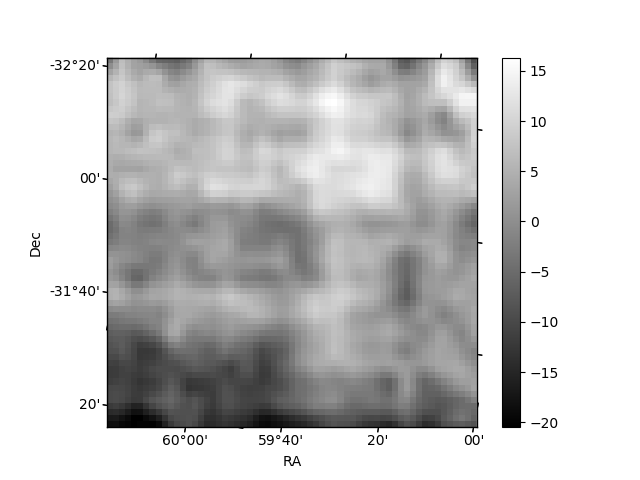
Histogram calculated using DETX and DETY for each event in the final _common_clean file
| Quadrant A |  |
 |
Quadrant B |
|---|---|---|---|
| Quadrant D |  |
 |
Quadrant C |
| Plot type | Count rate plots | Images |
|---|---|---|
| Comparison with Poisson distribution Blue bars denote a histogram of data divided into 1 sec bins. Red curve is a Poisson curve with rate = median count rate of data. |
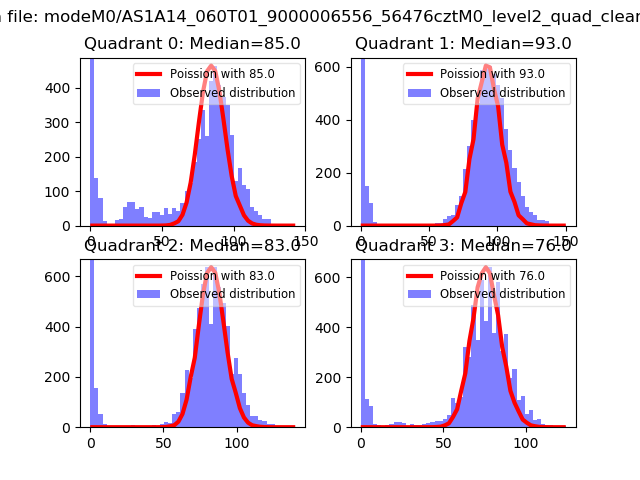 |
 |
| Quadrant-wise count rates Data is divided into 100 sec bins |
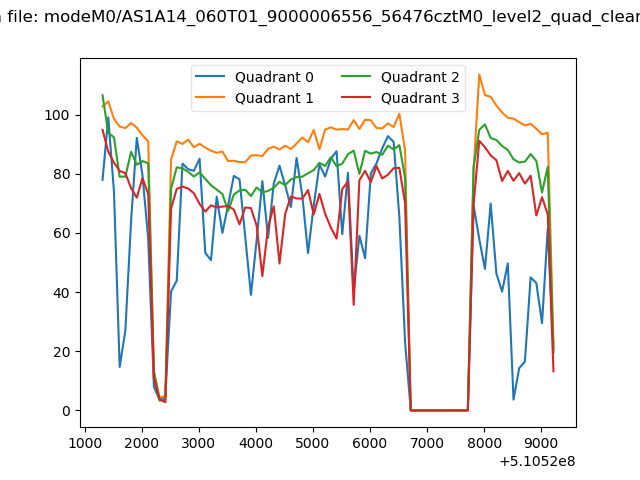 |
|
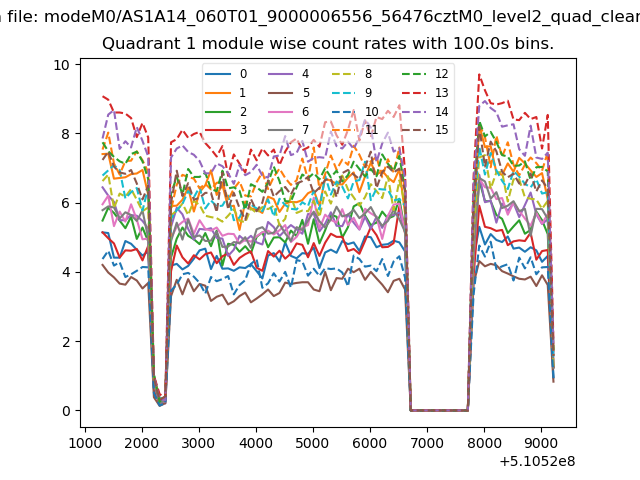
| Module-wise count rates for Quadrant A Data is divided into 100 sec bins |
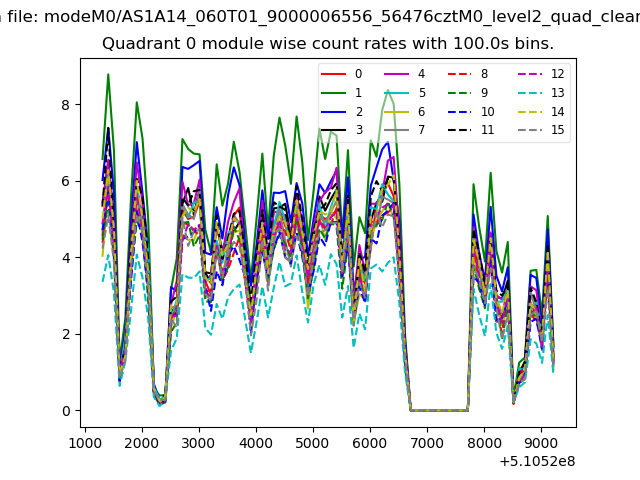 |
 |
| Module-wise count rates for Quadrant B Data is divided into 100 sec bins |
 |
 |
| Module-wise count rates for Quadrant C Data is divided into 100 sec bins |
 |
 |
| Module-wise count rates for Quadrant D Data is divided into 100 sec bins |
 |
 |
| Parameter | Plot |
|---|---|
| CZT HV Monitor | 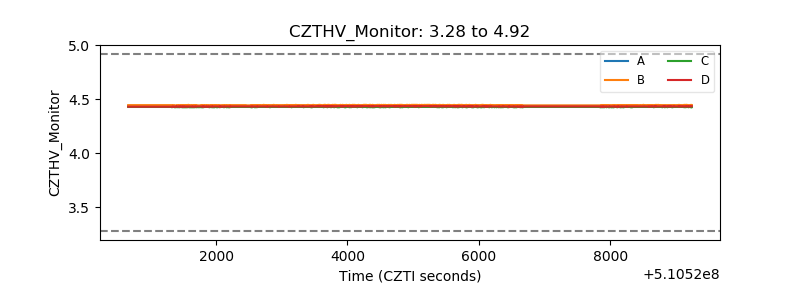 |
| D_VDD |  |
| Temperature 1 | 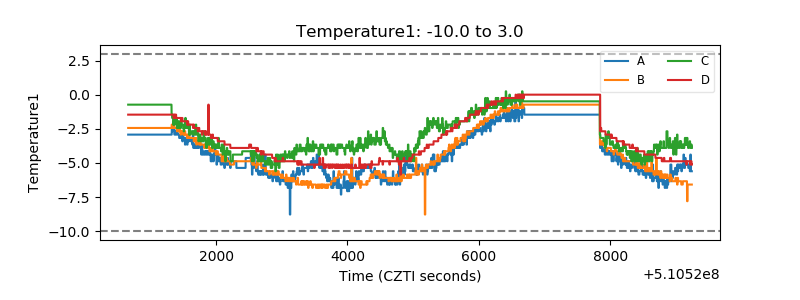 |
| Veto HV Monitor | 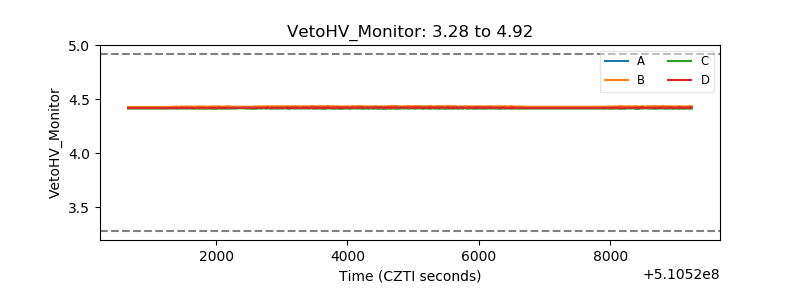 |
| Veto LLD | 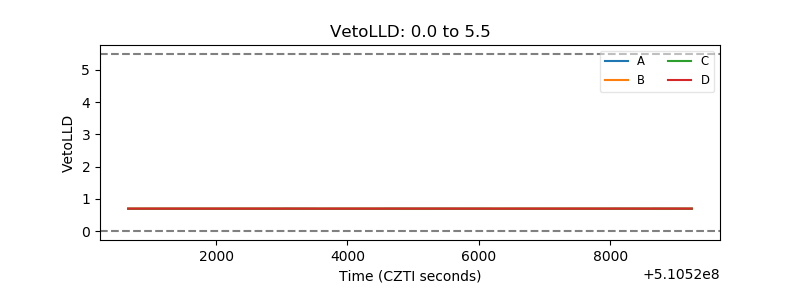 |
| Alpha Counter |  |
| _CPM_Rate | 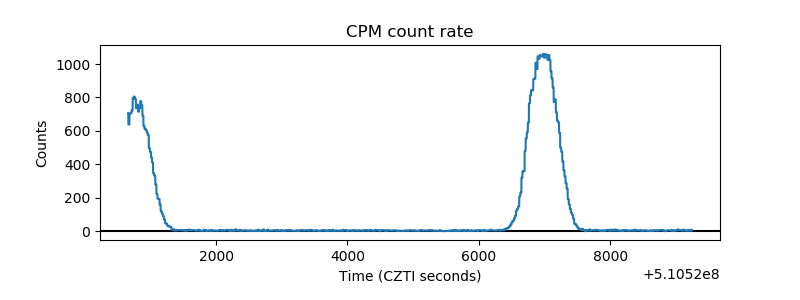 |
| CZT Counter |  |
| +2.5 Volts monitor |  |
| +5 Volts monitor | 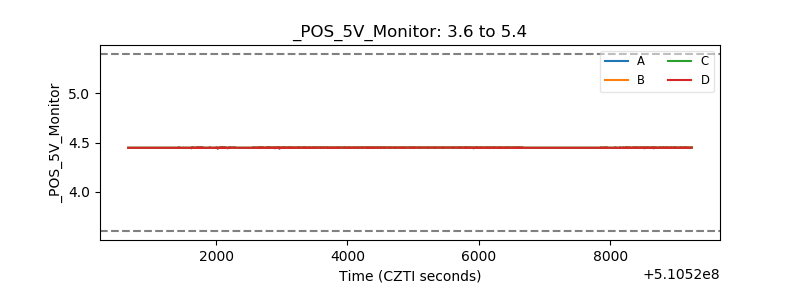 |
| _ROLL_ROT | 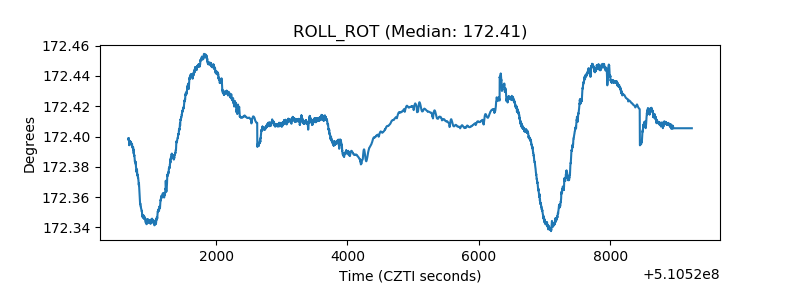 |
| _Roll_DEC | 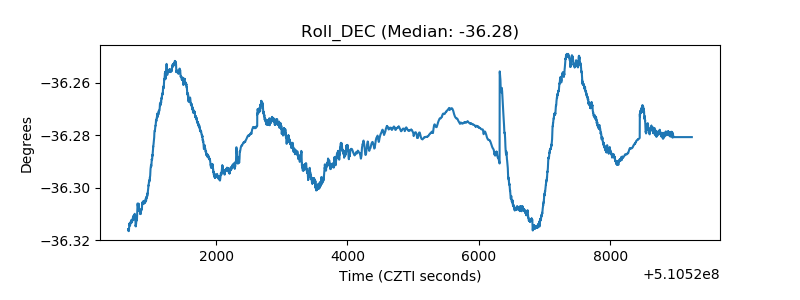 |
| _Roll_RA |  |
| Veto Counter | 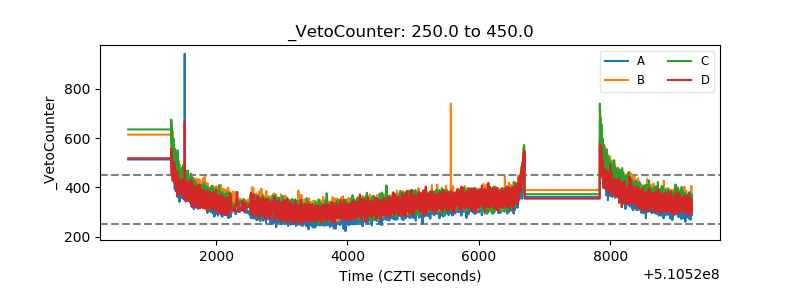 |