| Param | Original file | Final file |
|---|---|---|
| Filename | modeM0/AS1A14_060T01_9000006556_56479cztM0_level2.fits | modeM0/AS1A14_060T01_9000006556_56479cztM0_level2_quad_clean.evt |
| Size (bytes) | 540,584,640 | 73,895,040 |
| Size | 515.5 MB | 70.5 MB |
| Events in quadrant A | 8,118,166 | 391,911 |
| Events in quadrant B | 3,196,781 | 548,683 |
| Events in quadrant C | 3,223,974 | 469,916 |
| Events in quadrant D | 5,007,595 | 409,455 |
| Mode M0 | |||
|---|---|---|---|
| Quadrant | BADHDUFLAG | Total packets | Discarded packets |
| A | 0 | 28145 | 1 |
| B | 0 | 13396 | 1 |
| C | 0 | 13911 | 1 |
| D | 0 | 18942 | 1 |
| Mode M9 | |||
|---|---|---|---|
| Quadrant | BADHDUFLAG | Total packets | Discarded packets |
| A | 0 | 11 | 0 |
| B | 0 | 11 | 0 |
| C | 0 | 11 | 0 |
| D | 0 | 11 | 0 |
| Mode SS | |||
|---|---|---|---|
| Quadrant | BADHDUFLAG | Total packets | Discarded packets |
| A | 0 | 122 | 0 |
| B | 0 | 122 | 0 |
| C | 0 | 122 | 0 |
| D | 0 | 122 | 0 |
| Quadrant | Total seconds | Saturated seconds | Saturation percentage |
|---|---|---|---|
| A | 5972 | 1838 | 30.776959% |
| B | 5972 | 166 | 2.779638% |
| C | 5973 | 203 | 3.398627% |
| D | 5973 | 636 | 10.647916% |
Noise dominated data is calculated using 1-second bins in cleaned event files. If a bin has >2000 counts, and if more than 50% of those come from <1% of pixels, then it is considered to be noise-dominated and hence unusable.
| Quadrant | # 1 sec bins | Bins with >0 counts | Bins with >2000 counts | High rate bins dominated by noise | Noise dominated (total time) | Noise dominated (detector-on time) | Marked lightcurve |
|---|---|---|---|---|---|---|---|
| A | 7380 | 6256 | 1578 | 1578 | 21.38% | 25.22% |  |
| B | 7380 | 6256 | 70 | 70 | 0.95% | 1.12% | 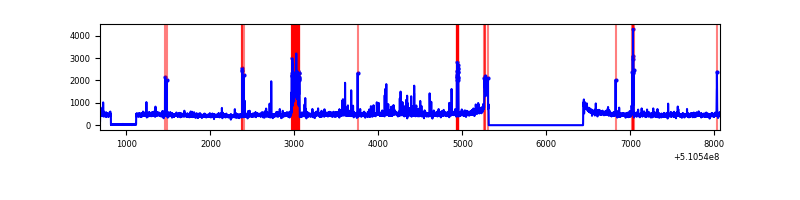 |
| C | 7381 | 6242 | 142 | 142 | 1.92% | 2.27% | 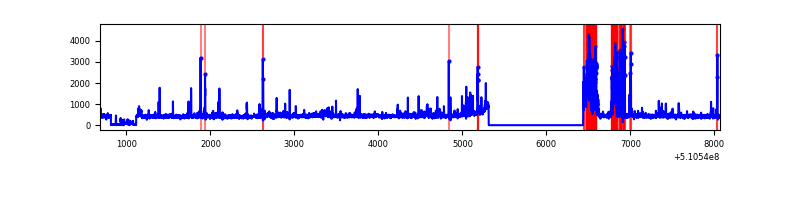 |
| D | 7381 | 6257 | 559 | 559 | 7.57% | 8.93% |  |
Top three noisy pixels from each quadrant. If the there are fewer than three noisy pixels in the level2.evt file, extra rows are filled as -1
| Pixel properties | Quadrant properties | ||||||
|---|---|---|---|---|---|---|---|
| Quadrant | DetID | PixID | Counts | Sigma | Mean | Median | Sigma |
| A | 7 | 64 | 1878543 | 13495.14 | 561 | 548 | 139.2 |
| A | 12 | 3 | 1868325 | 13421.71 | 561 | 548 | 139.2 |
| A | 4 | 95 | 1162118 | 8346.96 | 561 | 548 | 139.2 |
| B | 5 | 172 | 417652 | 3011.78 | 649 | 623 | 138.5 |
| B | 0 | 63 | 93333 | 669.55 | 649 | 623 | 138.5 |
| B | 0 | 213 | 38209 | 271.45 | 649 | 623 | 138.5 |
| C | 12 | 249 | 330746 | 1906.09 | 632 | 626 | 173.2 |
| C | 11 | 227 | 198587 | 1143.01 | 632 | 626 | 173.2 |
| C | 12 | 252 | 97464 | 559.14 | 632 | 626 | 173.2 |
| D | 12 | 4 | 1532847 | 9042.76 | 602 | 576 | 169.4 |
| D | 2 | 249 | 750828 | 4427.64 | 602 | 576 | 169.4 |
| D | 3 | 12 | 116873 | 686.33 | 602 | 576 | 169.4 |
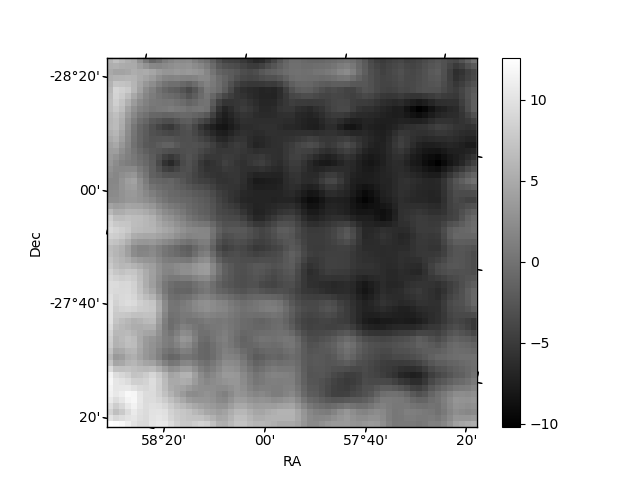
Histogram calculated using DETX and DETY for each event in the final _common_clean file
| Quadrant A | 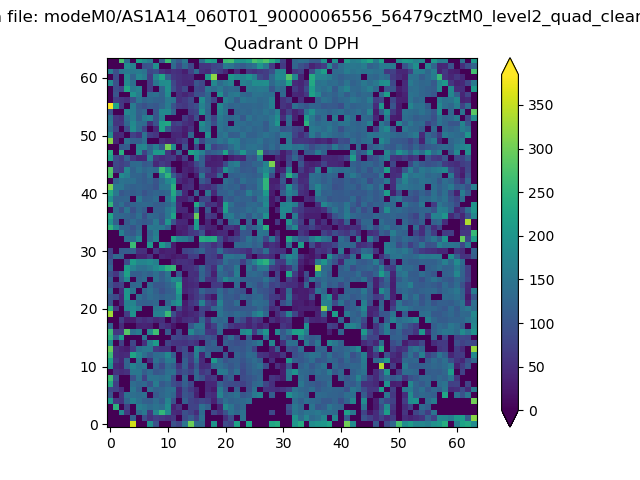 |
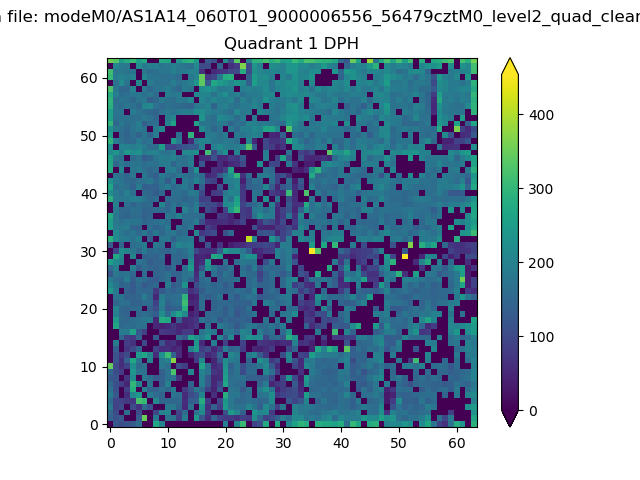 |
Quadrant B |
|---|---|---|---|
| Quadrant D | 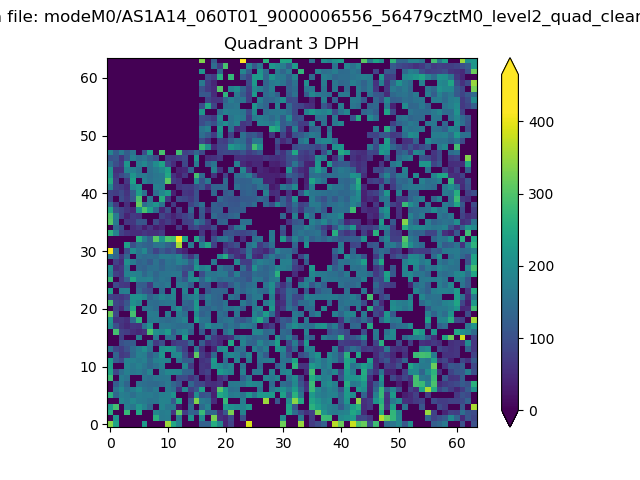 |
 |
Quadrant C |
| Plot type | Count rate plots | Images |
|---|---|---|
| Comparison with Poisson distribution Blue bars denote a histogram of data divided into 1 sec bins. Red curve is a Poisson curve with rate = median count rate of data. |
 |
 |
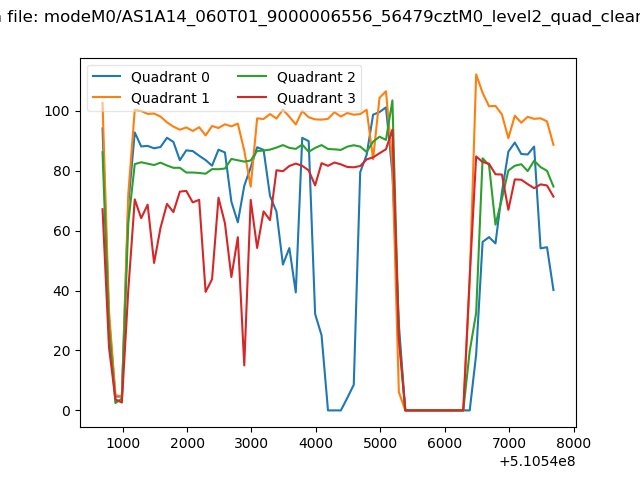
| Quadrant-wise count rates Data is divided into 100 sec bins |
 |
|
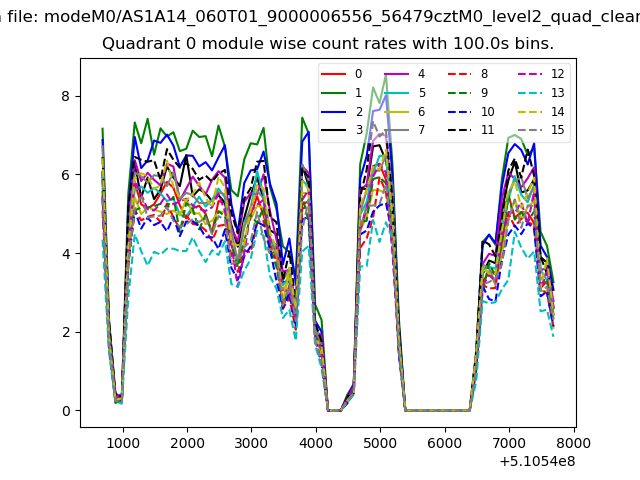
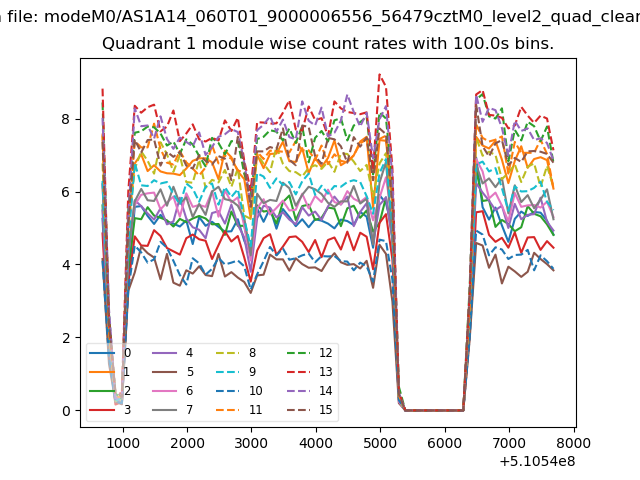
| Module-wise count rates for Quadrant A Data is divided into 100 sec bins |
 |
 |
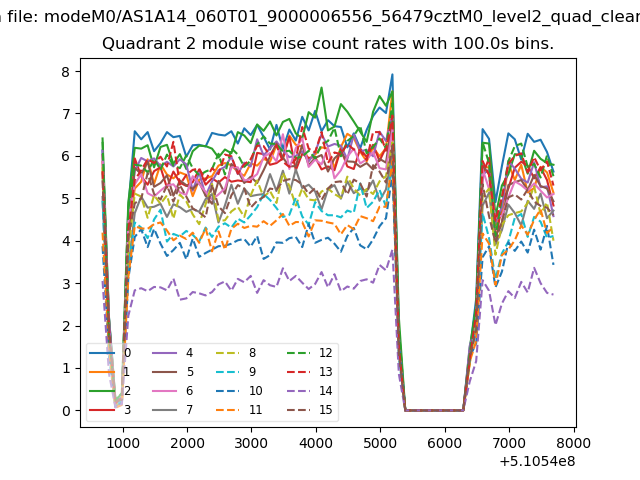
| Module-wise count rates for Quadrant B Data is divided into 100 sec bins |
 |
 |
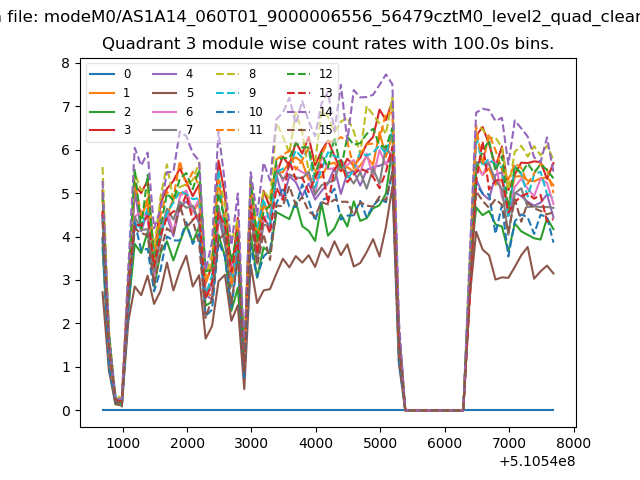
| Module-wise count rates for Quadrant C Data is divided into 100 sec bins |
 |
 |
| Module-wise count rates for Quadrant D Data is divided into 100 sec bins |
 |
 |
| Parameter | Plot |
|---|---|
| CZT HV Monitor |  |
| D_VDD | 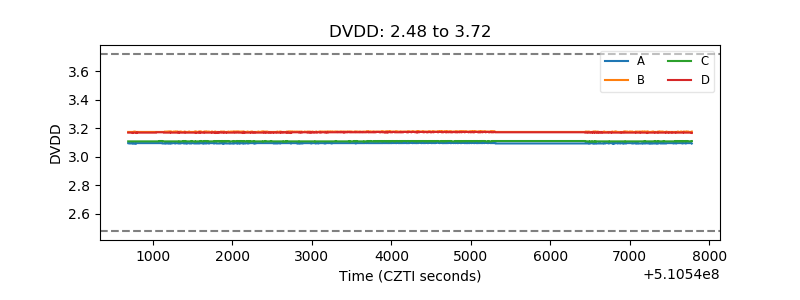 |
| Temperature 1 | 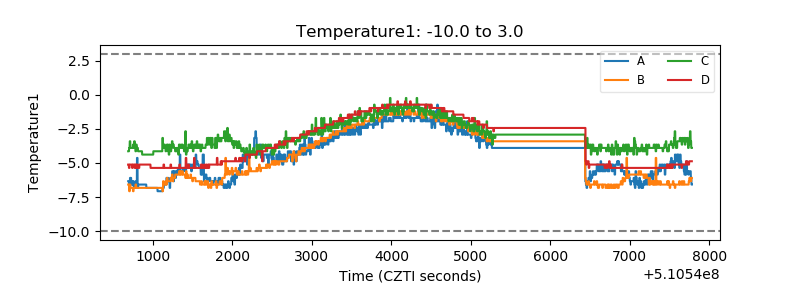 |
| Veto HV Monitor | 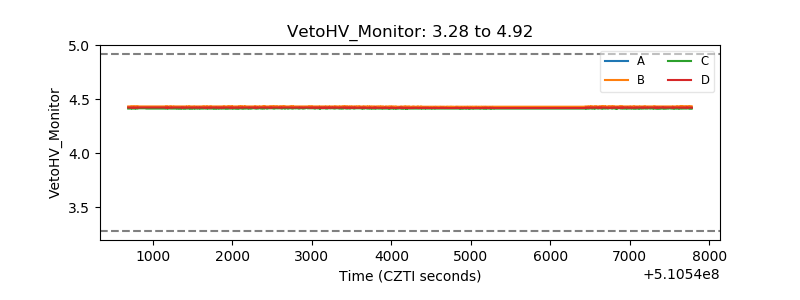 |
| Veto LLD | 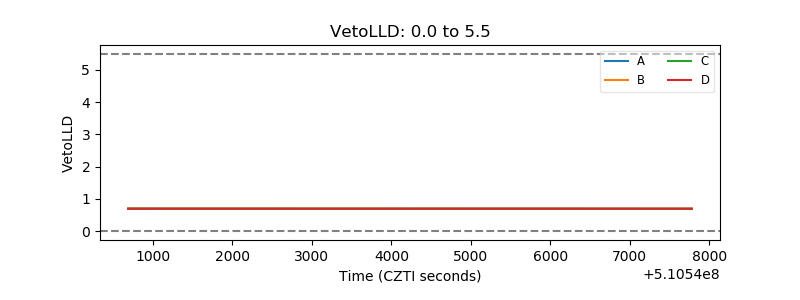 |
| Alpha Counter |  |
| _CPM_Rate |  |
| CZT Counter | 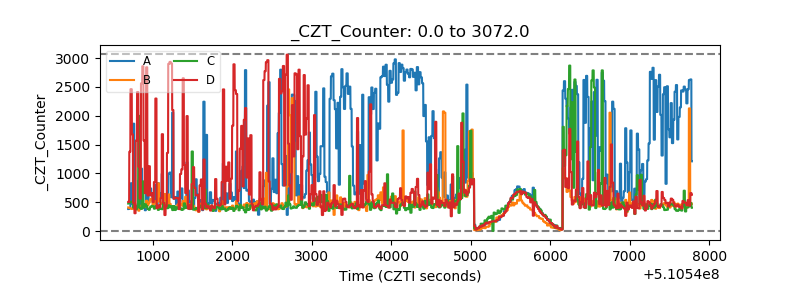 |
| +2.5 Volts monitor | 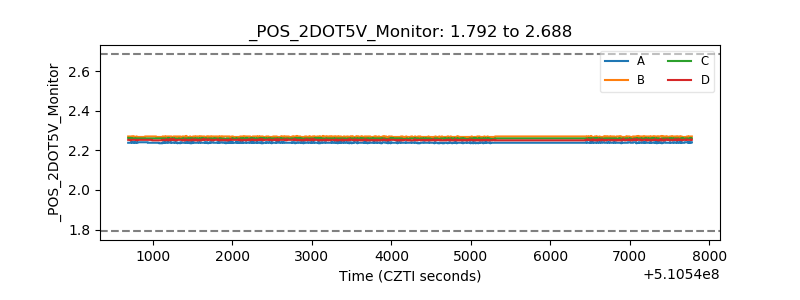 |
| +5 Volts monitor |  |
| _ROLL_ROT | 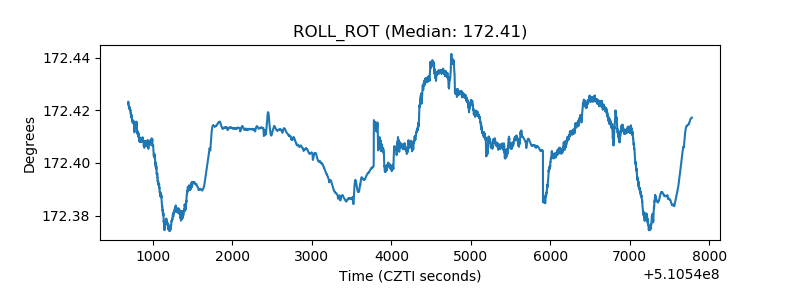 |
| _Roll_DEC | 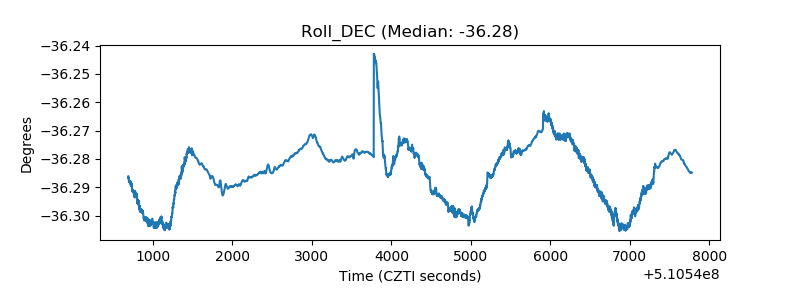 |
| _Roll_RA |  |
| Veto Counter | 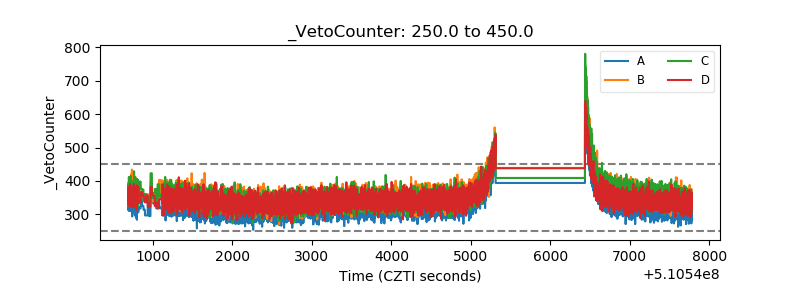 |