| Param | Original file | Final file |
|---|---|---|
| Filename | modeM0/AS1A14_060T01_9000006556_56482cztM0_level2.fits | modeM0/AS1A14_060T01_9000006556_56482cztM0_level2_quad_clean.evt |
| Size (bytes) | 650,782,080 | 107,225,280 |
| Size | 620.6 MB | 102.3 MB |
| Events in quadrant A | 5,651,519 | 718,725 |
| Events in quadrant B | 7,146,864 | 632,590 |
| Events in quadrant C | 4,145,295 | 711,758 |
| Events in quadrant D | 6,528,220 | 629,876 |
| Mode M0 | |||
|---|---|---|---|
| Quadrant | BADHDUFLAG | Total packets | Discarded packets |
| A | 0 | 22286 | 0 |
| B | 0 | 26708 | 0 |
| C | 0 | 18120 | 0 |
| D | 0 | 24843 | 0 |
| Mode SS | |||
|---|---|---|---|
| Quadrant | BADHDUFLAG | Total packets | Discarded packets |
| A | 0 | 160 | 0 |
| B | 0 | 160 | 0 |
| C | 0 | 160 | 0 |
| D | 0 | 160 | 0 |
| Quadrant | Total seconds | Saturated seconds | Saturation percentage |
|---|---|---|---|
| A | 7960 | 356 | 4.472362% |
| B | 7960 | 1914 | 24.045226% |
| C | 7961 | 200 | 2.512247% |
| D | 7961 | 633 | 7.951262% |
Noise dominated data is calculated using 1-second bins in cleaned event files. If a bin has >2000 counts, and if more than 50% of those come from <1% of pixels, then it is considered to be noise-dominated and hence unusable.
| Quadrant | # 1 sec bins | Bins with >0 counts | Bins with >2000 counts | High rate bins dominated by noise | Noise dominated (total time) | Noise dominated (detector-on time) | Marked lightcurve |
|---|---|---|---|---|---|---|---|
| A | 7960 | 7960 | 176 | 176 | 2.21% | 2.21% |  |
| B | 7960 | 7960 | 1180 | 1180 | 14.82% | 14.82% |  |
| C | 7961 | 7961 | 123 | 123 | 1.55% | 1.55% | 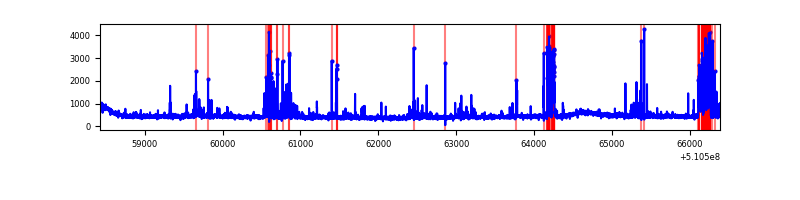 |
| D | 7961 | 7961 | 507 | 507 | 6.37% | 6.37% |  |
Top three noisy pixels from each quadrant. If the there are fewer than three noisy pixels in the level2.evt file, extra rows are filled as -1
| Pixel properties | Quadrant properties | ||||||
|---|---|---|---|---|---|---|---|
| Quadrant | DetID | PixID | Counts | Sigma | Mean | Median | Sigma |
| A | 4 | 95 | 1305989 | 6108.75 | 862 | 840 | 213.7 |
| A | 7 | 64 | 286101 | 1335.16 | 862 | 840 | 213.7 |
| A | 12 | 3 | 285358 | 1331.69 | 862 | 840 | 213.7 |
| B | 5 | 172 | 3765795 | 22897.61 | 769 | 742 | 164.4 |
| B | 4 | 21 | 106536 | 643.4 | 769 | 742 | 164.4 |
| B | 0 | 63 | 101187 | 610.87 | 769 | 742 | 164.4 |
| C | 15 | 230 | 407330 | 1746.59 | 854 | 846 | 232.7 |
| C | 12 | 252 | 150356 | 642.42 | 854 | 846 | 232.7 |
| C | 12 | 249 | 131952 | 563.34 | 854 | 846 | 232.7 |
| D | 2 | 249 | 1389068 | 6006.29 | 823 | 787 | 231.1 |
| D | 12 | 4 | 507423 | 2191.92 | 823 | 787 | 231.1 |
| D | 11 | 176 | 398277 | 1719.71 | 823 | 787 | 231.1 |
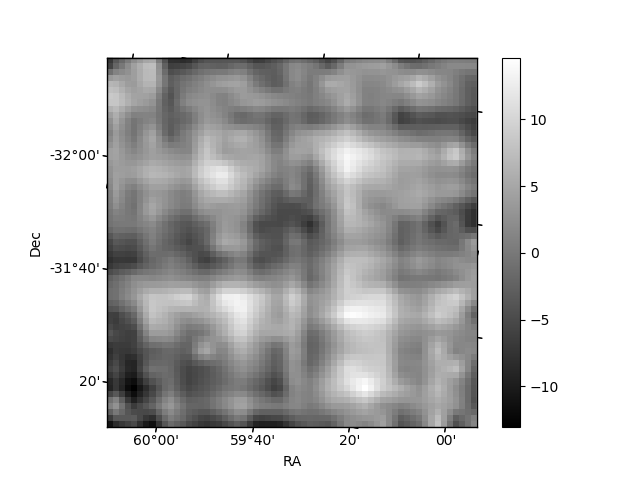
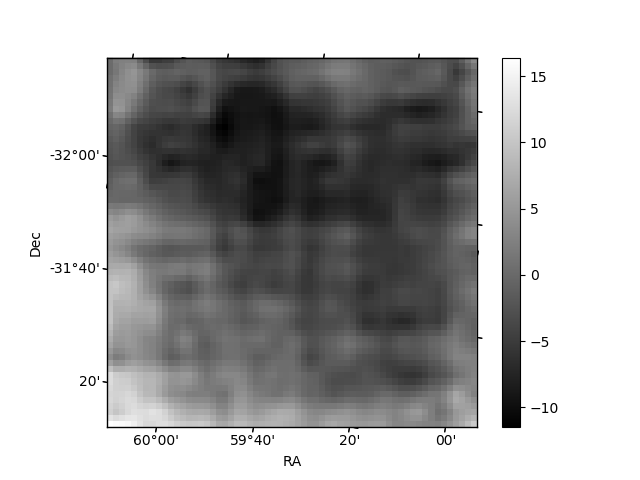
Histogram calculated using DETX and DETY for each event in the final _common_clean file
| Quadrant A | 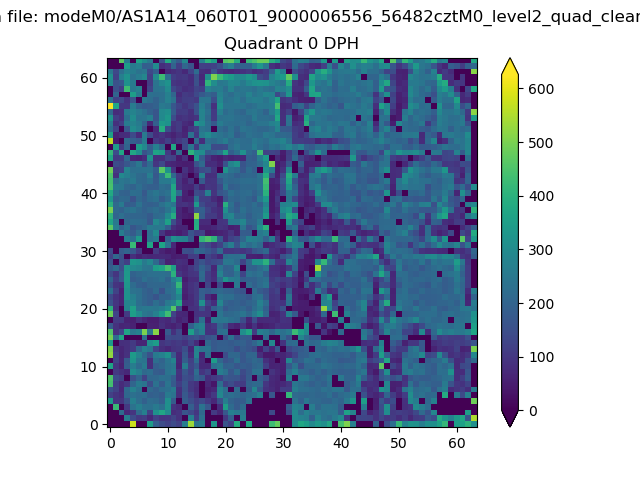 |
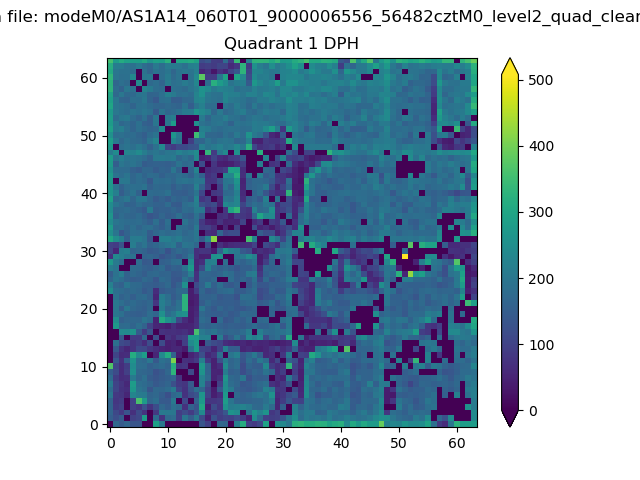 |
Quadrant B |
|---|---|---|---|
| Quadrant D |  |
 |
Quadrant C |
| Plot type | Count rate plots | Images |
|---|---|---|
| Comparison with Poisson distribution Blue bars denote a histogram of data divided into 1 sec bins. Red curve is a Poisson curve with rate = median count rate of data. |
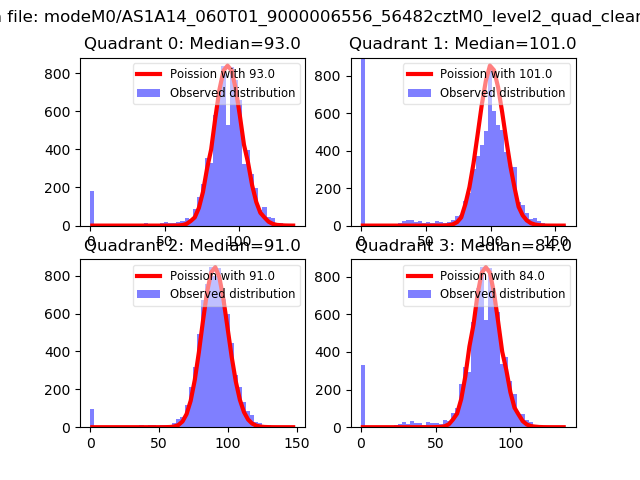 |
 |
| Quadrant-wise count rates Data is divided into 100 sec bins |
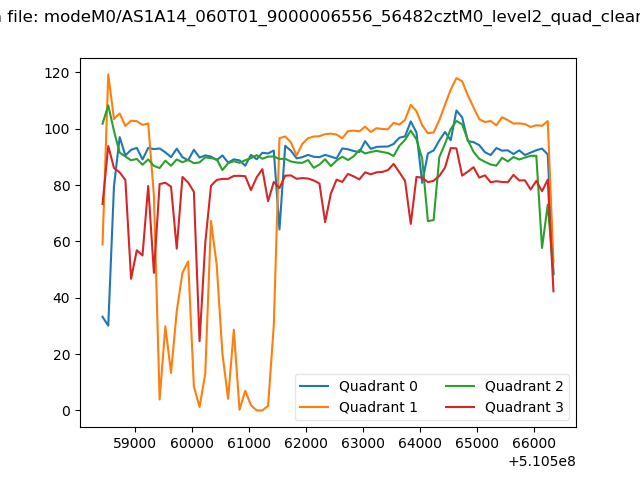 |
|
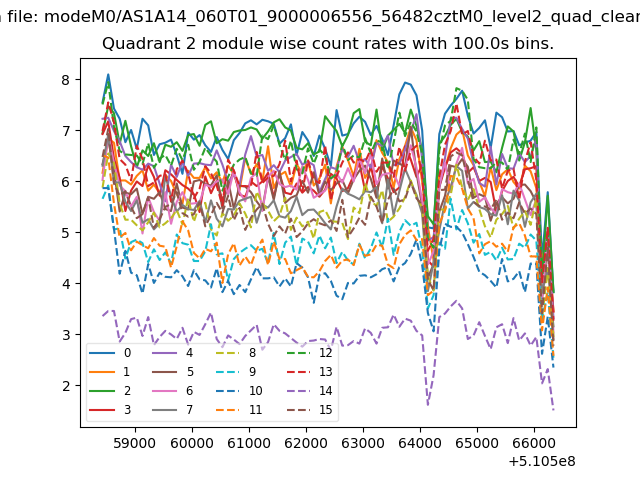
| Module-wise count rates for Quadrant A Data is divided into 100 sec bins |
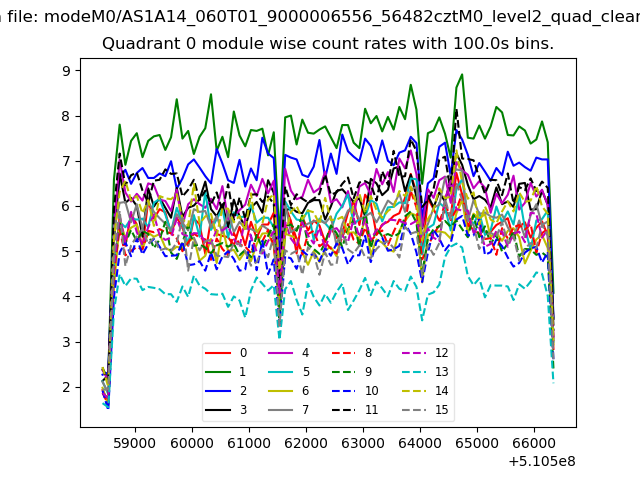 |
 |
| Module-wise count rates for Quadrant B Data is divided into 100 sec bins |
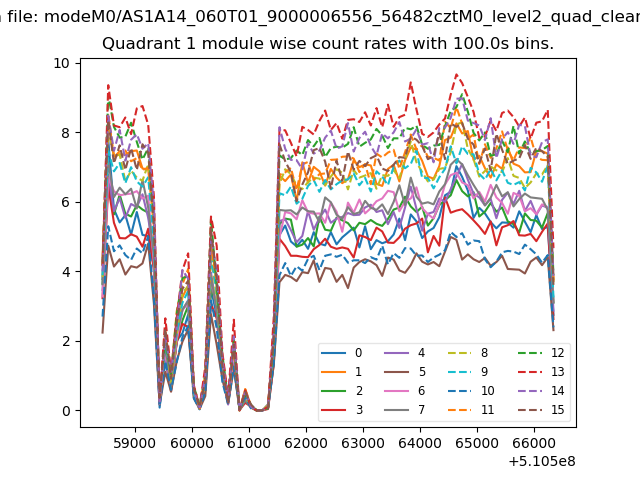 |
 |
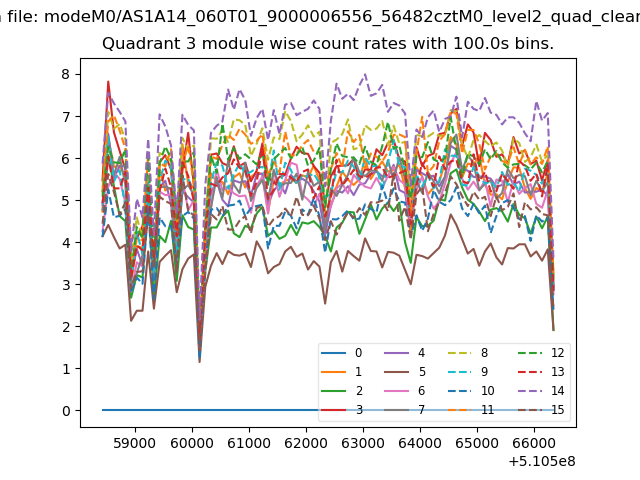
| Module-wise count rates for Quadrant C Data is divided into 100 sec bins |
 |
 |
| Module-wise count rates for Quadrant D Data is divided into 100 sec bins |
 |
 |
| Parameter | Plot |
|---|---|
| CZT HV Monitor |  |
| D_VDD |  |
| Temperature 1 |  |
| Veto HV Monitor | 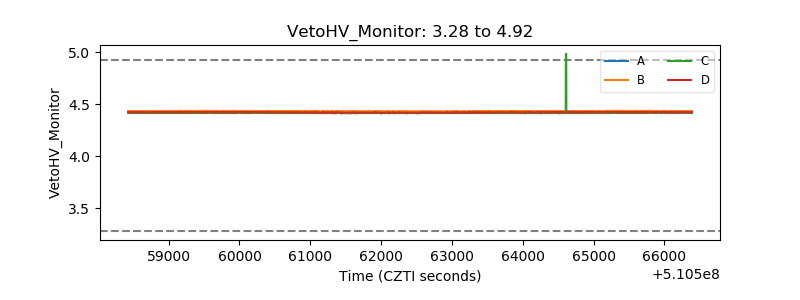 |
| Veto LLD | 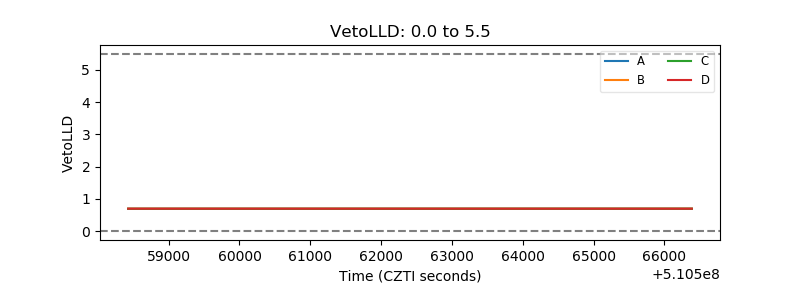 |
| Alpha Counter |  |
| _CPM_Rate | 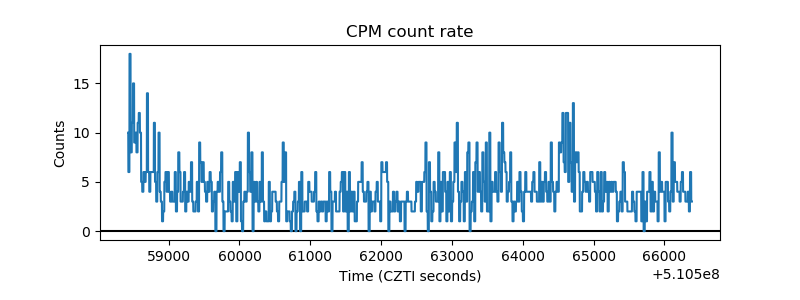 |
| CZT Counter | 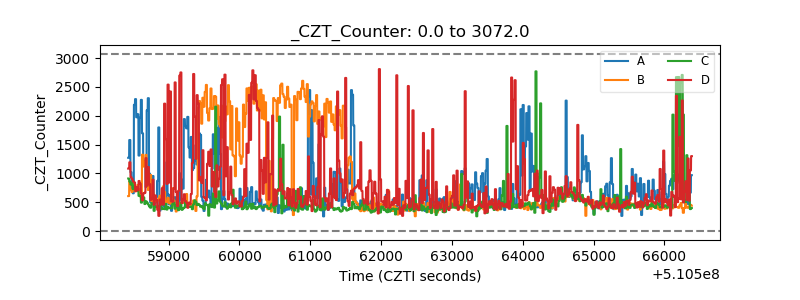 |
| +2.5 Volts monitor |  |
| +5 Volts monitor |  |
| _ROLL_ROT | 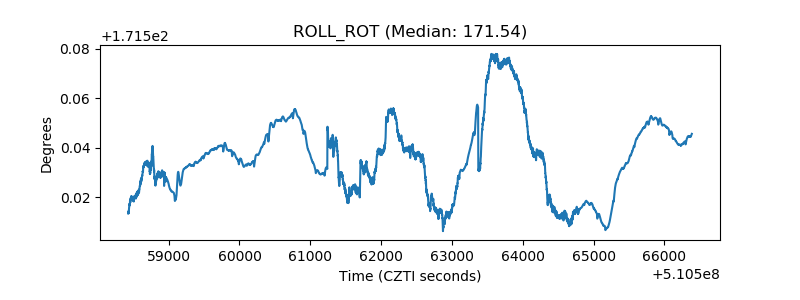 |
| _Roll_DEC | 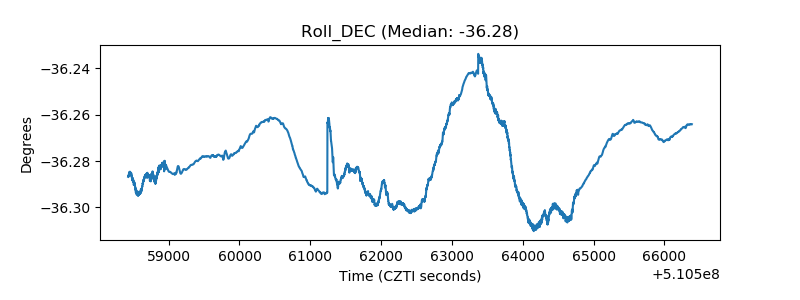 |
| _Roll_RA | 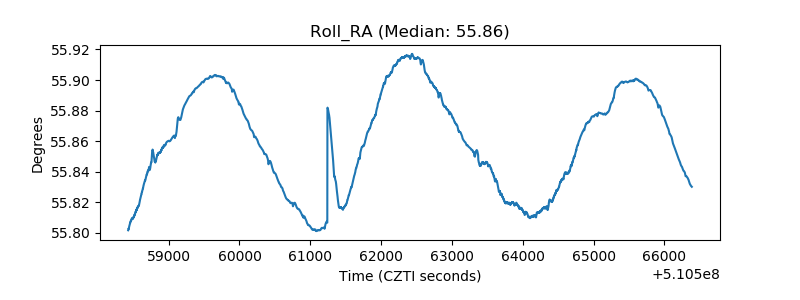 |
| Veto Counter | 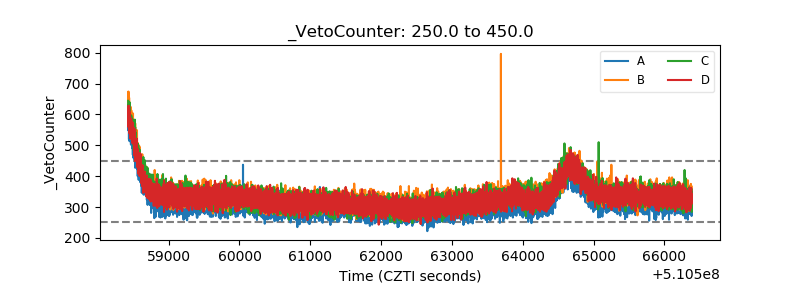 |