| Param | Original file | Final file |
|---|---|---|
| Filename | modeM0/AS1A14_060T01_9000006556_56483cztM0_level2.fits | modeM0/AS1A14_060T01_9000006556_56483cztM0_level2_quad_clean.evt |
| Size (bytes) | 464,195,520 | 103,409,280 |
| Size | 442.7 MB | 98.6 MB |
| Events in quadrant A | 4,257,768 | 666,528 |
| Events in quadrant B | 3,586,003 | 727,283 |
| Events in quadrant C | 3,616,530 | 648,123 |
| Events in quadrant D | 5,161,409 | 586,234 |
| Mode M0 | |||
|---|---|---|---|
| Quadrant | BADHDUFLAG | Total packets | Discarded packets |
| A | 0 | 17619 | 0 |
| B | 0 | 15679 | 2 |
| C | 0 | 16049 | 0 |
| D | 0 | 20143 | 0 |
| Mode SS | |||
|---|---|---|---|
| Quadrant | BADHDUFLAG | Total packets | Discarded packets |
| A | 0 | 144 | 0 |
| B | 0 | 144 | 0 |
| C | 0 | 144 | 0 |
| D | 0 | 144 | 0 |
| Quadrant | Total seconds | Saturated seconds | Saturation percentage |
|---|---|---|---|
| A | 7224 | 114 | 1.578073% |
| B | 7223 | 75 | 1.038350% |
| C | 7223 | 90 | 1.246020% |
| D | 7223 | 343 | 4.748719% |
Noise dominated data is calculated using 1-second bins in cleaned event files. If a bin has >2000 counts, and if more than 50% of those come from <1% of pixels, then it is considered to be noise-dominated and hence unusable.
| Quadrant | # 1 sec bins | Bins with >0 counts | Bins with >2000 counts | High rate bins dominated by noise | Noise dominated (total time) | Noise dominated (detector-on time) | Marked lightcurve |
|---|---|---|---|---|---|---|---|
| A | 7224 | 7224 | 61 | 61 | 0.84% | 0.84% |  |
| B | 7223 | 7223 | 28 | 28 | 0.39% | 0.39% |  |
| C | 7223 | 7223 | 81 | 81 | 1.12% | 1.12% | 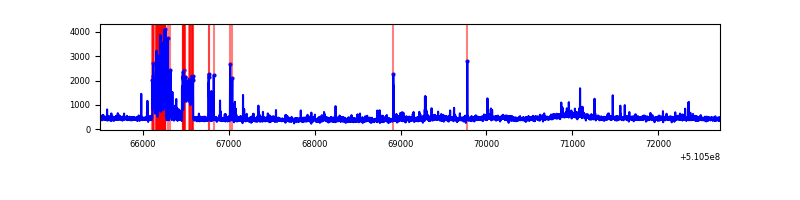 |
| D | 7223 | 7223 | 301 | 301 | 4.17% | 4.17% |  |
Top three noisy pixels from each quadrant. If the there are fewer than three noisy pixels in the level2.evt file, extra rows are filled as -1
| Pixel properties | Quadrant properties | ||||||
|---|---|---|---|---|---|---|---|
| Quadrant | DetID | PixID | Counts | Sigma | Mean | Median | Sigma |
| A | 4 | 95 | 548603 | 2851.92 | 775 | 755 | 192.1 |
| A | 4 | 249 | 188517 | 977.43 | 775 | 755 | 192.1 |
| A | 12 | 3 | 161958 | 839.17 | 775 | 755 | 192.1 |
| B | 5 | 172 | 212315 | 1283.37 | 772 | 744 | 164.9 |
| B | 0 | 153 | 59808 | 358.28 | 772 | 744 | 164.9 |
| B | 10 | 247 | 53849 | 322.13 | 772 | 744 | 164.9 |
| C | 15 | 230 | 262365 | 1260.57 | 757 | 750 | 207.5 |
| C | 1 | 16 | 199849 | 959.34 | 757 | 750 | 207.5 |
| C | 12 | 252 | 92472 | 441.96 | 757 | 750 | 207.5 |
| D | 3 | 12 | 474558 | 2267.79 | 740 | 708 | 208.9 |
| D | 12 | 4 | 435259 | 2079.71 | 740 | 708 | 208.9 |
| D | 11 | 176 | 323318 | 1543.97 | 740 | 708 | 208.9 |
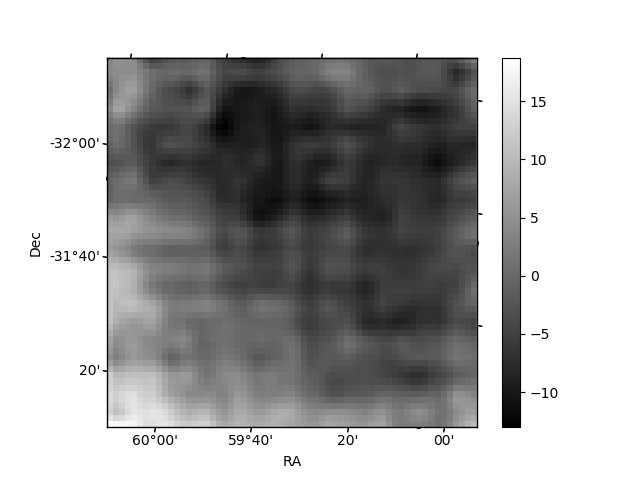
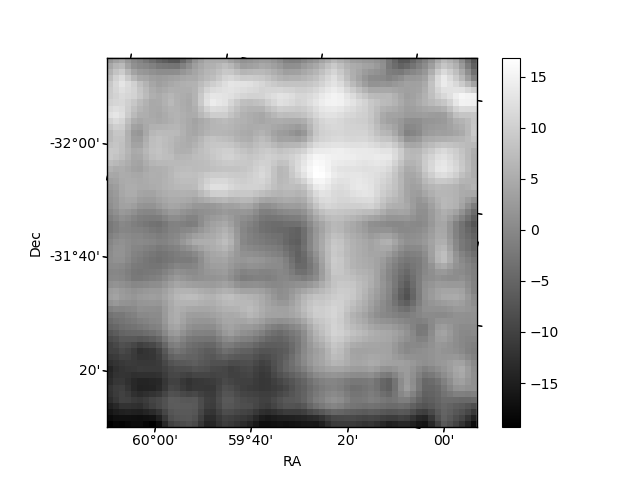
Histogram calculated using DETX and DETY for each event in the final _common_clean file
| Quadrant A | 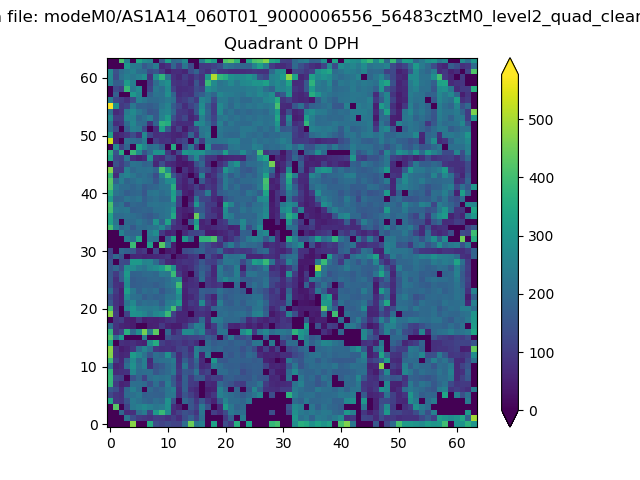 |
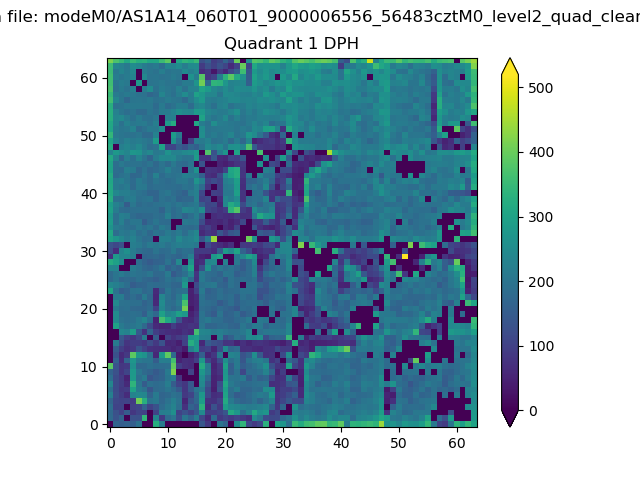 |
Quadrant B |
|---|---|---|---|
| Quadrant D | 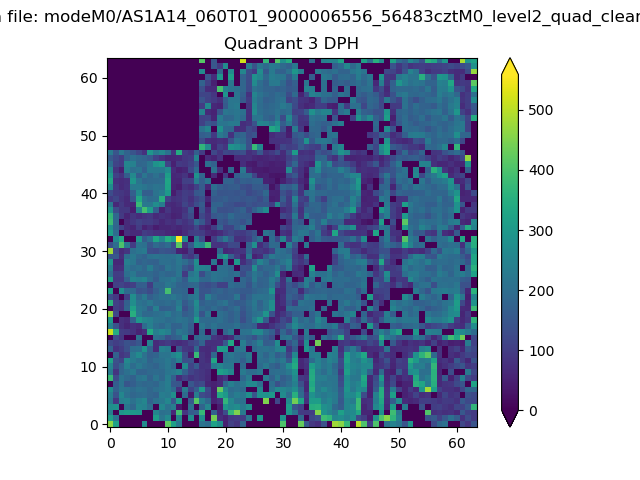 |
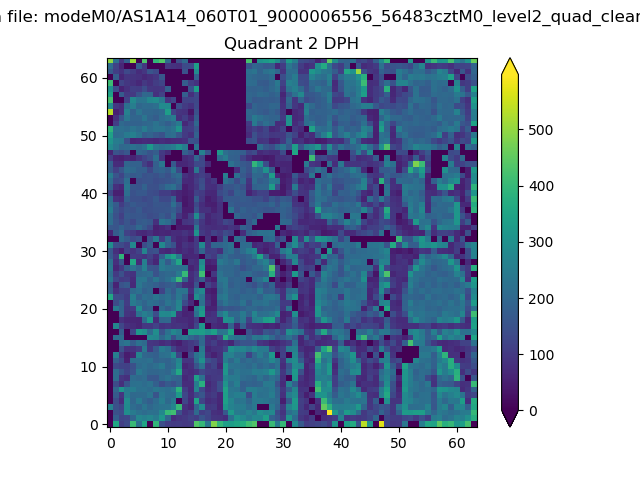 |
Quadrant C |
| Plot type | Count rate plots | Images |
|---|---|---|
| Comparison with Poisson distribution Blue bars denote a histogram of data divided into 1 sec bins. Red curve is a Poisson curve with rate = median count rate of data. |
 |
 |
| Quadrant-wise count rates Data is divided into 100 sec bins |
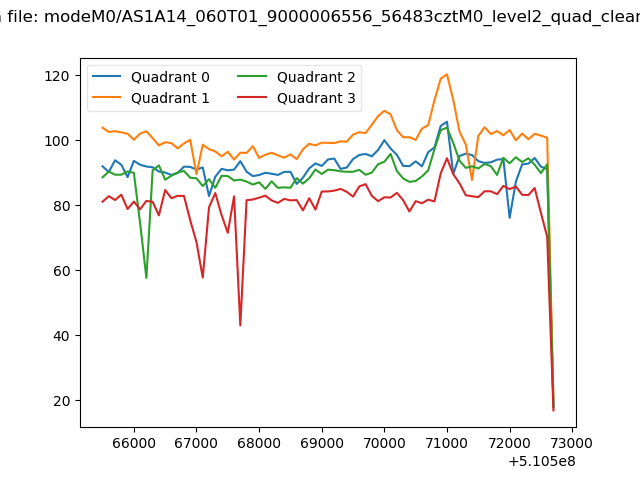 |
|
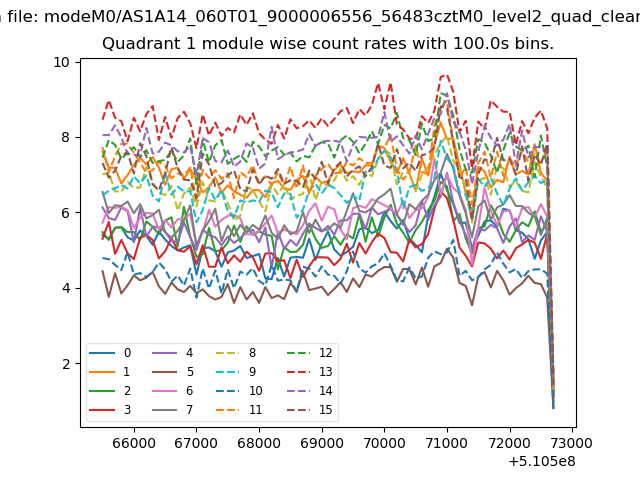
| Module-wise count rates for Quadrant A Data is divided into 100 sec bins |
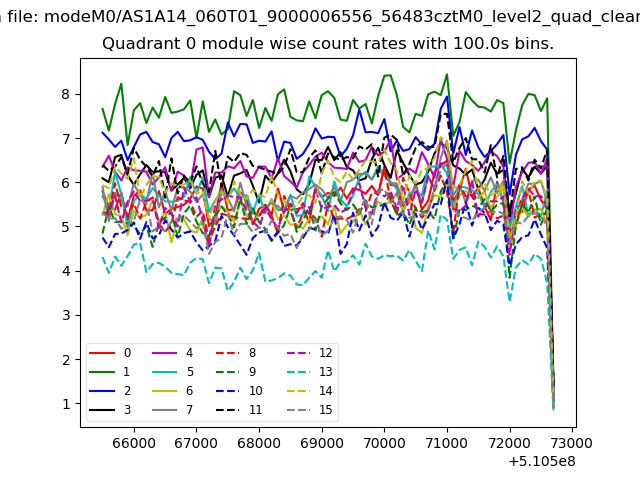 |
 |
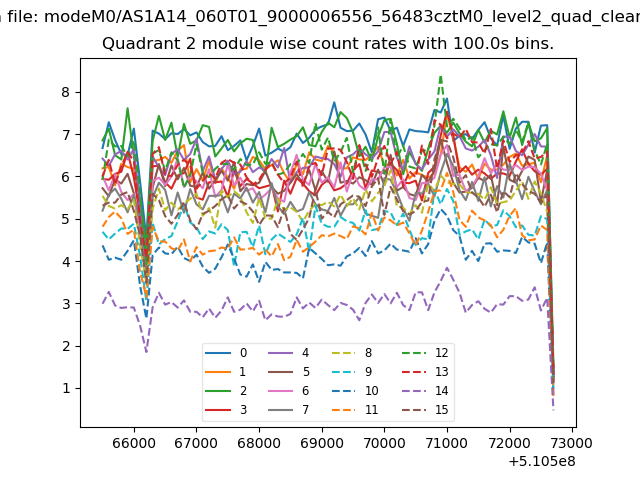
| Module-wise count rates for Quadrant B Data is divided into 100 sec bins |
 |
 |
| Module-wise count rates for Quadrant C Data is divided into 100 sec bins |
 |
 |
| Module-wise count rates for Quadrant D Data is divided into 100 sec bins |
 |
 |
| Parameter | Plot |
|---|---|
| CZT HV Monitor |  |
| D_VDD | 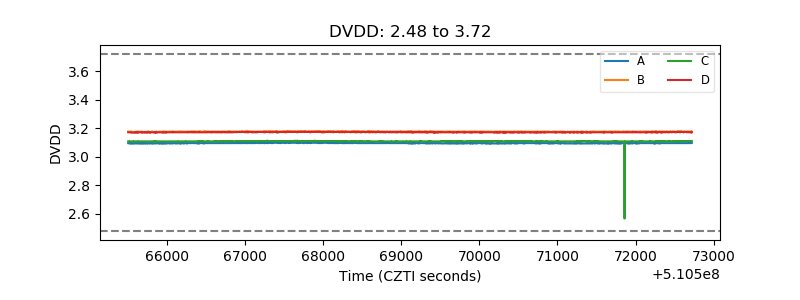 |
| Temperature 1 |  |
| Veto HV Monitor | 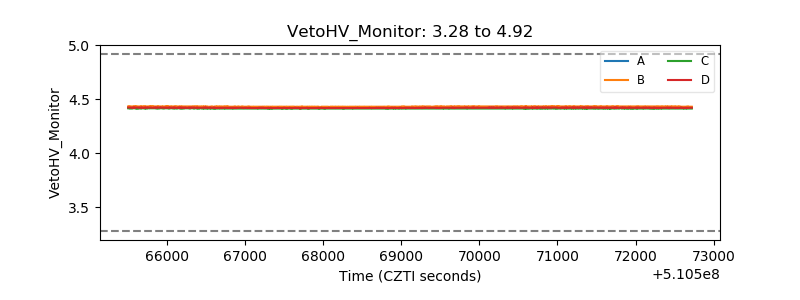 |
| Veto LLD | 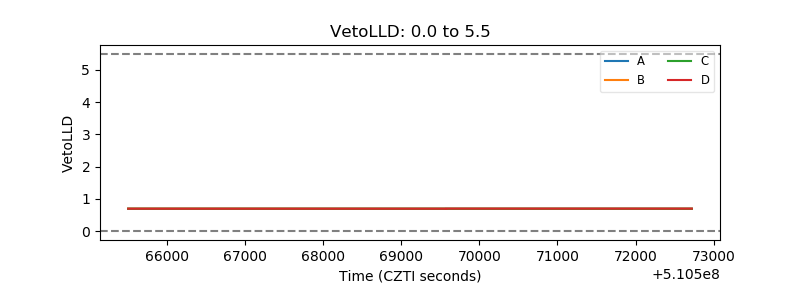 |
| Alpha Counter |  |
| _CPM_Rate |  |
| CZT Counter | 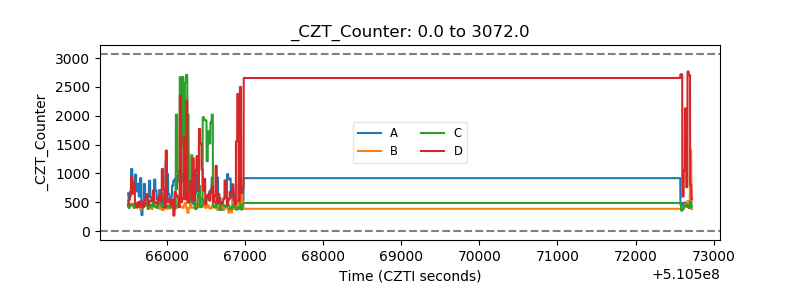 |
| +2.5 Volts monitor | 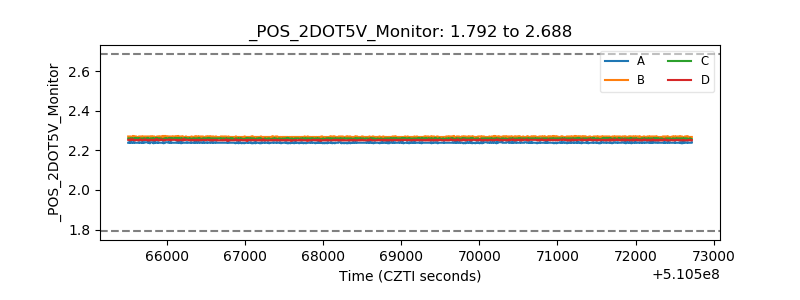 |
| +5 Volts monitor |  |
| _ROLL_ROT | 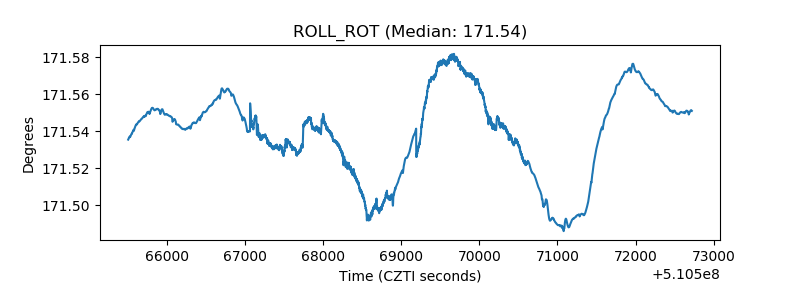 |
| _Roll_DEC | 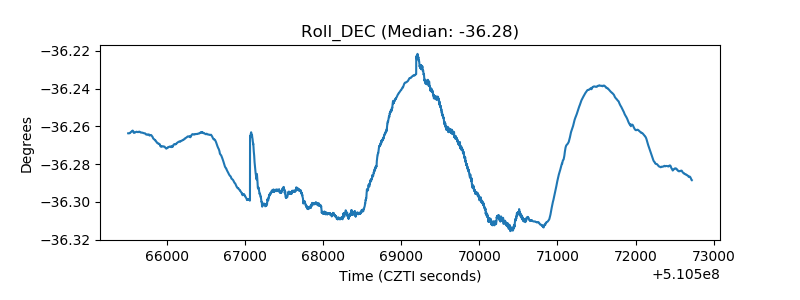 |
| _Roll_RA | 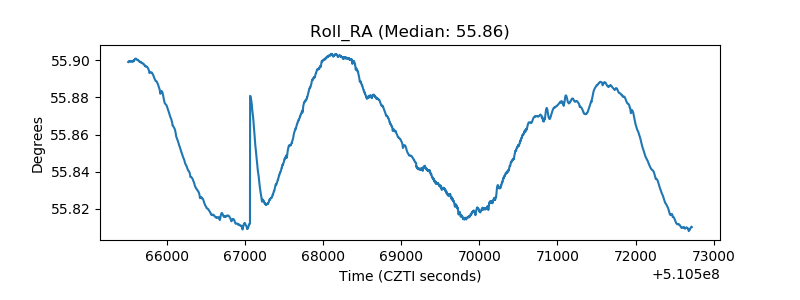 |
| Veto Counter | 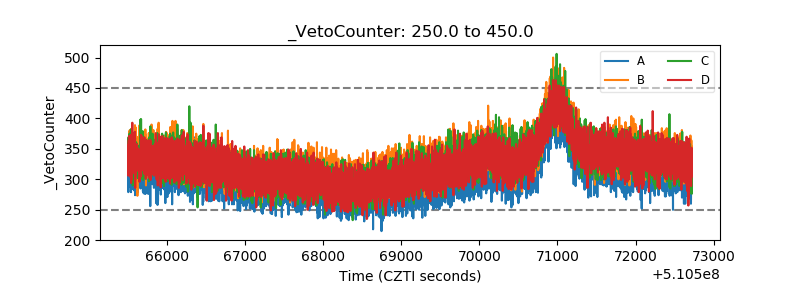 |