| Param | Original file | Final file |
|---|---|---|
| Filename | modeM0/AS1A14_060T01_9000006556_56486cztM0_level2.fits | modeM0/AS1A14_060T01_9000006556_56486cztM0_level2_quad_clean.evt |
| Size (bytes) | 981,072,000 | 197,755,200 |
| Size | 935.6 MB | 188.6 MB |
| Events in quadrant A | 9,877,130 | 1,241,980 |
| Events in quadrant B | 8,025,994 | 1,398,517 |
| Events in quadrant C | 6,647,213 | 1,255,707 |
| Events in quadrant D | 10,677,180 | 1,119,939 |
| Mode M0 | |||
|---|---|---|---|
| Quadrant | BADHDUFLAG | Total packets | Discarded packets |
| A | 0 | 39134 | 3 |
| B | 0 | 33424 | 1 |
| C | 0 | 30455 | 1 |
| D | 0 | 41343 | 1 |
| Mode M9 | |||
|---|---|---|---|
| Quadrant | BADHDUFLAG | Total packets | Discarded packets |
| A | 0 | 3 | 0 |
| B | 0 | 3 | 0 |
| C | 0 | 3 | 0 |
| D | 0 | 3 | 0 |
| Mode SS | |||
|---|---|---|---|
| Quadrant | BADHDUFLAG | Total packets | Discarded packets |
| A | 0 | 284 | 0 |
| B | 0 | 284 | 0 |
| C | 0 | 284 | 0 |
| D | 0 | 284 | 0 |
| Quadrant | Total seconds | Saturated seconds | Saturation percentage |
|---|---|---|---|
| A | 14058 | 853 | 6.067719% |
| B | 14059 | 302 | 2.148090% |
| C | 14059 | 159 | 1.130948% |
| D | 14059 | 958 | 6.814140% |
Noise dominated data is calculated using 1-second bins in cleaned event files. If a bin has >2000 counts, and if more than 50% of those come from <1% of pixels, then it is considered to be noise-dominated and hence unusable.
| Quadrant | # 1 sec bins | Bins with >0 counts | Bins with >2000 counts | High rate bins dominated by noise | Noise dominated (total time) | Noise dominated (detector-on time) | Marked lightcurve |
|---|---|---|---|---|---|---|---|
| A | 14348 | 14059 | 515 | 515 | 3.59% | 3.66% |  |
| B | 14349 | 14060 | 70 | 70 | 0.49% | 0.50% |  |
| C | 14349 | 14060 | 70 | 70 | 0.49% | 0.50% | 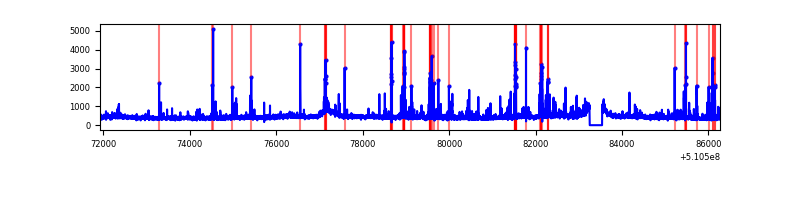 |
| D | 14349 | 14060 | 765 | 765 | 5.33% | 5.44% |  |
Top three noisy pixels from each quadrant. If the there are fewer than three noisy pixels in the level2.evt file, extra rows are filled as -1
| Pixel properties | Quadrant properties | ||||||
|---|---|---|---|---|---|---|---|
| Quadrant | DetID | PixID | Counts | Sigma | Mean | Median | Sigma |
| A | 12 | 3 | 978955 | 2632.37 | 1495 | 1455 | 371.3 |
| A | 3 | 45 | 918604 | 2469.85 | 1495 | 1455 | 371.3 |
| A | 0 | 8 | 508960 | 1366.69 | 1495 | 1455 | 371.3 |
| B | 5 | 172 | 1039240 | 3238.11 | 1509 | 1455 | 320.5 |
| B | 0 | 153 | 180884 | 559.86 | 1509 | 1455 | 320.5 |
| B | 0 | 213 | 135114 | 417.04 | 1509 | 1455 | 320.5 |
| C | 12 | 252 | 229215 | 563.84 | 1481 | 1468 | 403.9 |
| C | 12 | 249 | 198435 | 487.64 | 1481 | 1468 | 403.9 |
| C | 15 | 147 | 117789 | 287.98 | 1481 | 1468 | 403.9 |
| D | 12 | 4 | 1431135 | 3501.14 | 1441 | 1376 | 408.4 |
| D | 2 | 249 | 1362817 | 3333.84 | 1441 | 1376 | 408.4 |
| D | 11 | 176 | 586107 | 1431.87 | 1441 | 1376 | 408.4 |
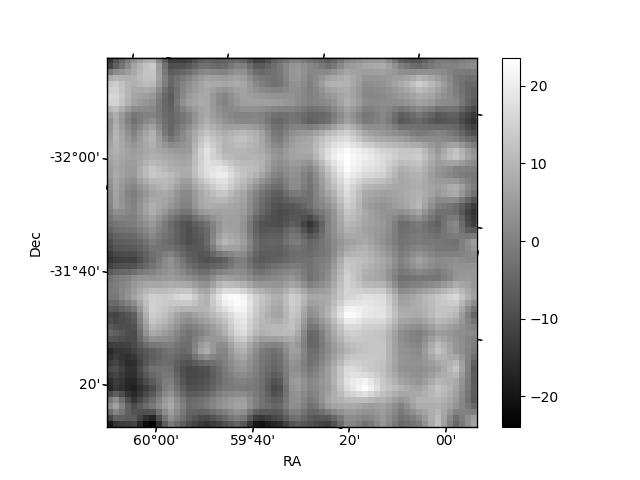
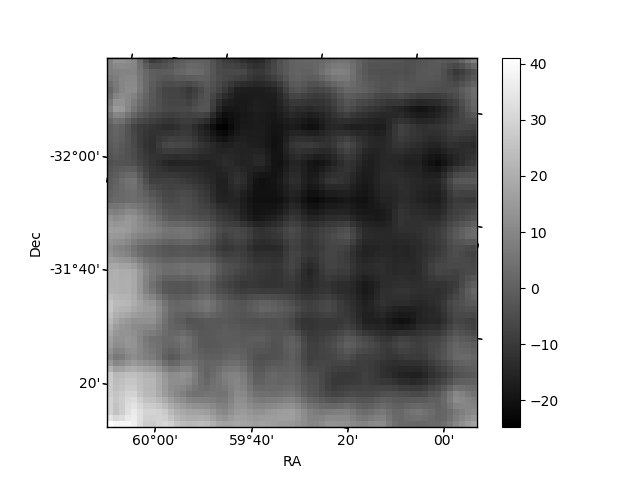
Histogram calculated using DETX and DETY for each event in the final _common_clean file
| Quadrant A | 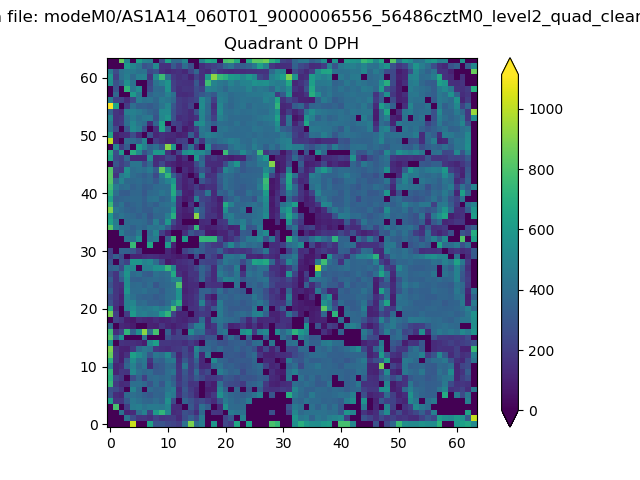 |
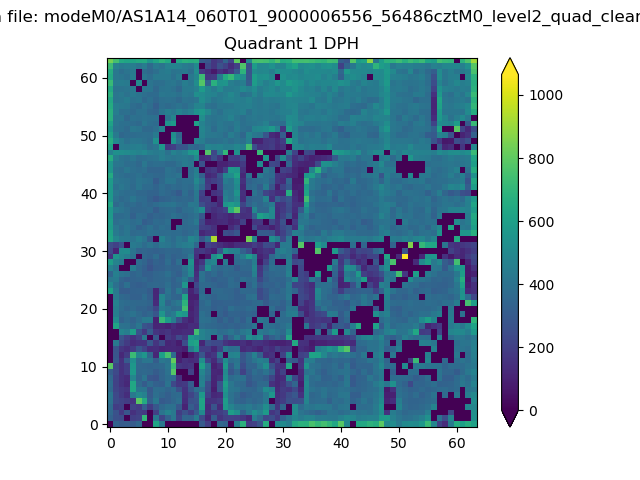 |
Quadrant B |
|---|---|---|---|
| Quadrant D | 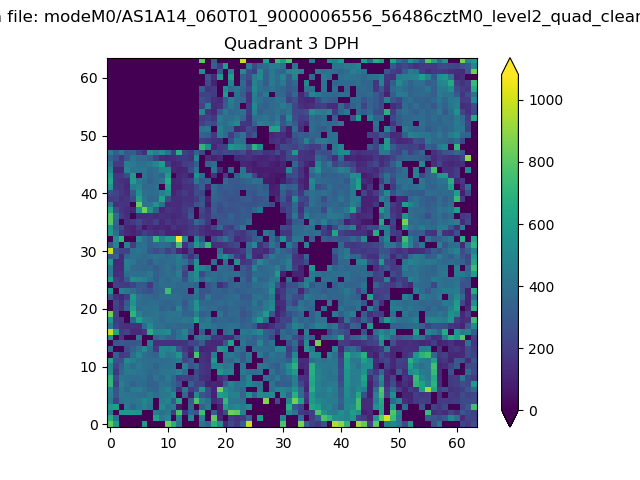 |
 |
Quadrant C |
| Plot type | Count rate plots | Images |
|---|---|---|
| Comparison with Poisson distribution Blue bars denote a histogram of data divided into 1 sec bins. Red curve is a Poisson curve with rate = median count rate of data. |
 |
 |
| Quadrant-wise count rates Data is divided into 100 sec bins |
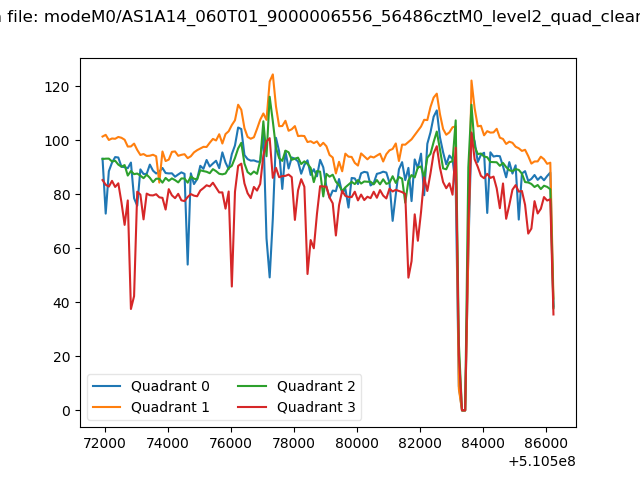 |
|
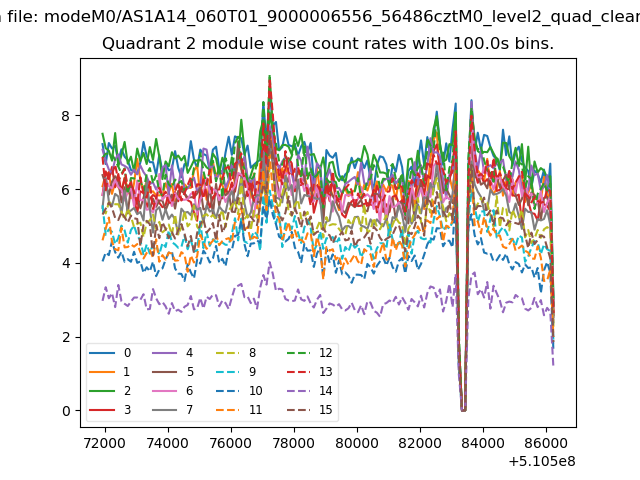
| Module-wise count rates for Quadrant A Data is divided into 100 sec bins |
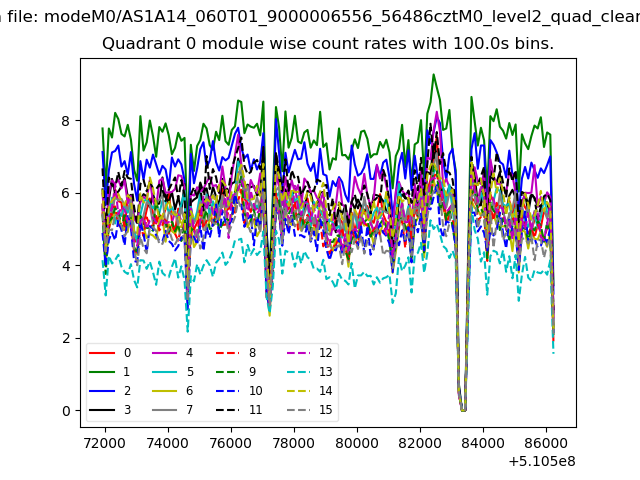 |
 |
| Module-wise count rates for Quadrant B Data is divided into 100 sec bins |
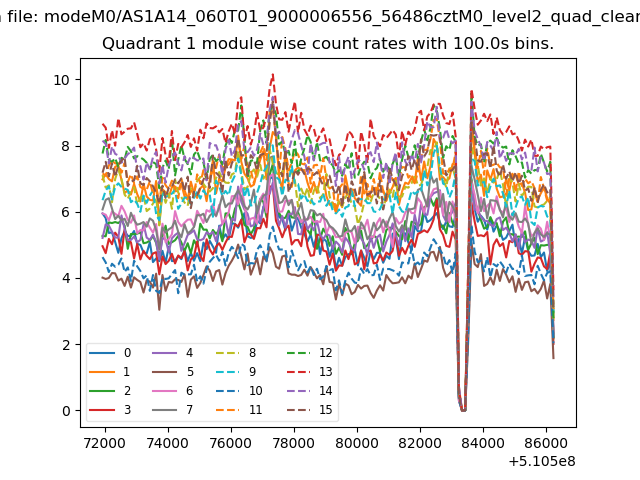 |
 |
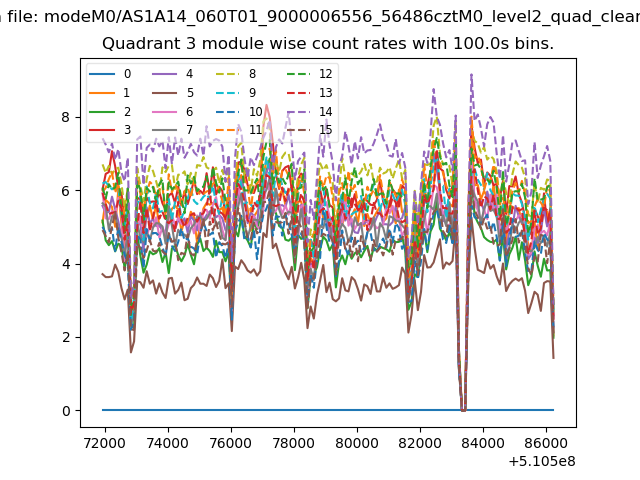
| Module-wise count rates for Quadrant C Data is divided into 100 sec bins |
 |
 |
| Module-wise count rates for Quadrant D Data is divided into 100 sec bins |
 |
 |
| Parameter | Plot |
|---|---|
| CZT HV Monitor |  |
| D_VDD |  |
| Temperature 1 | 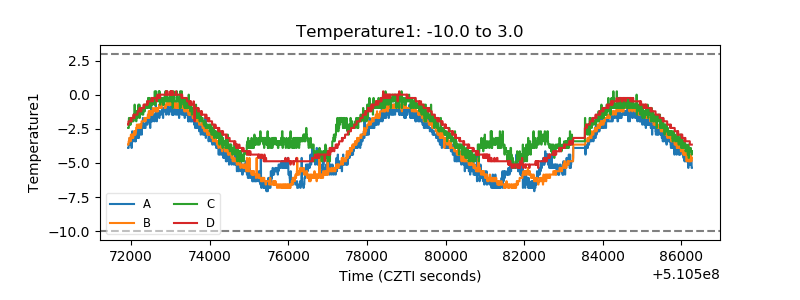 |
| Veto HV Monitor | 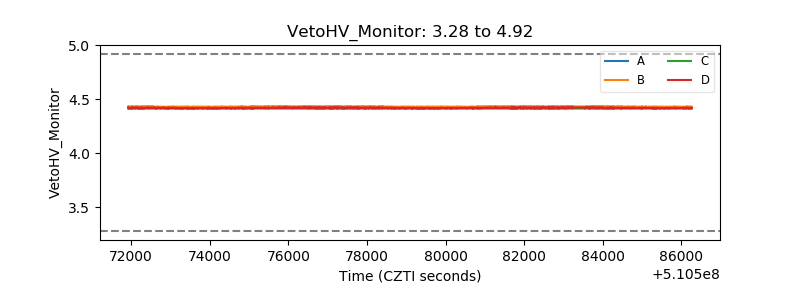 |
| Veto LLD | 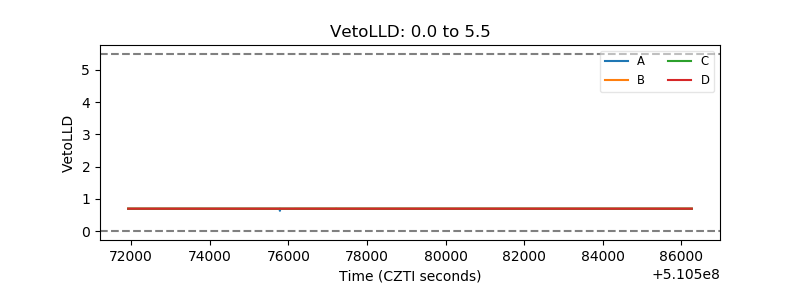 |
| Alpha Counter |  |
| _CPM_Rate | 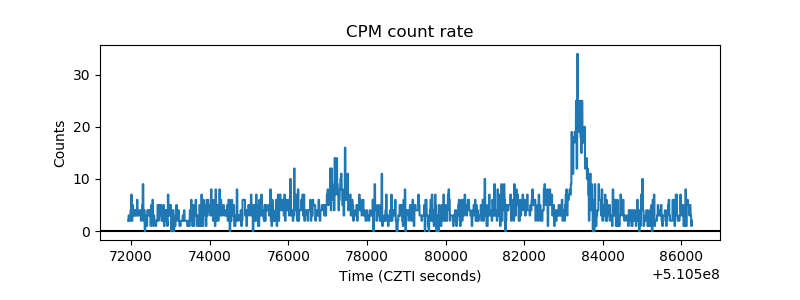 |
| CZT Counter | 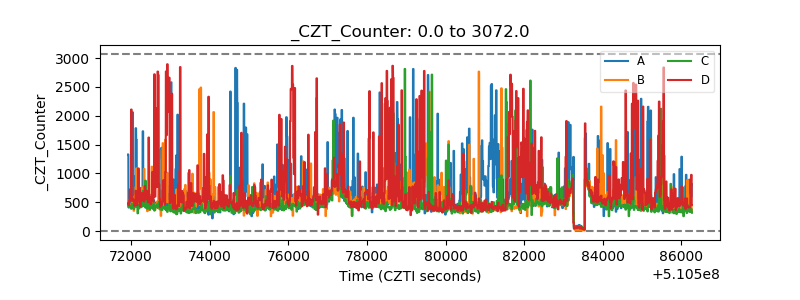 |
| +2.5 Volts monitor |  |
| +5 Volts monitor |  |
| _ROLL_ROT | 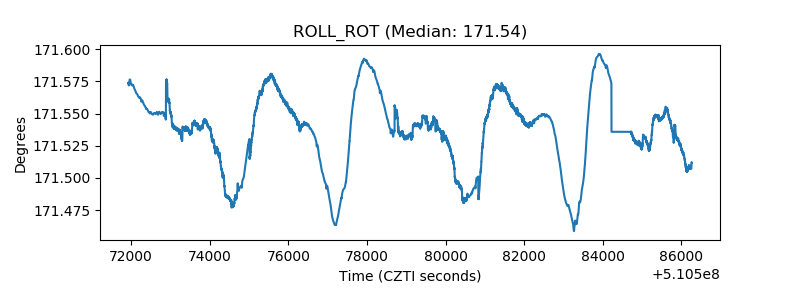 |
| _Roll_DEC | 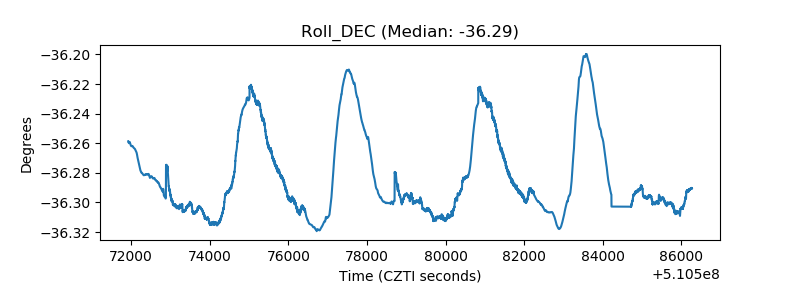 |
| _Roll_RA |  |
| Veto Counter | 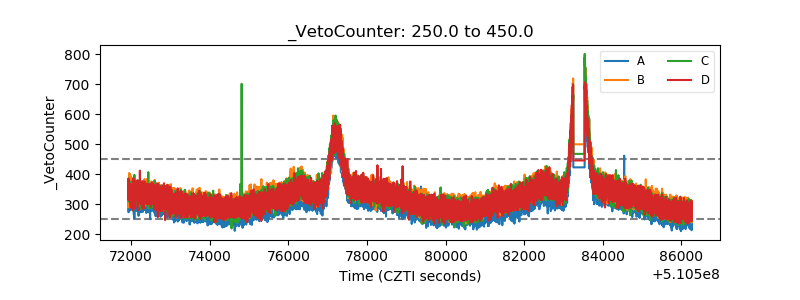 |