| Param | Original file | Final file |
|---|---|---|
| Filename | modeM0/AS1A14_060T01_9000006556_56488cztM0_level2.fits | modeM0/AS1A14_060T01_9000006556_56488cztM0_level2_quad_clean.evt |
| Size (bytes) | 2,078,812,800 | 413,432,640 |
| Size | 1.9 GB | 394.3 MB |
| Events in quadrant A | 20,649,994 | 2,643,466 |
| Events in quadrant B | 15,404,311 | 2,951,060 |
| Events in quadrant C | 17,490,458 | 2,511,016 |
| Events in quadrant D | 21,138,700 | 2,394,896 |
| Mode M0 | |||
|---|---|---|---|
| Quadrant | BADHDUFLAG | Total packets | Discarded packets |
| A | 0 | 81811 | 4 |
| B | 0 | 66095 | 4 |
| C | 0 | 74030 | 4 |
| D | 0 | 82918 | 4 |
| Mode M9 | |||
|---|---|---|---|
| Quadrant | BADHDUFLAG | Total packets | Discarded packets |
| A | 0 | 27 | 0 |
| B | 0 | 27 | 0 |
| C | 0 | 27 | 0 |
| D | 0 | 27 | 0 |
| Mode SS | |||
|---|---|---|---|
| Quadrant | BADHDUFLAG | Total packets | Discarded packets |
| A | 0 | 594 | 0 |
| B | 0 | 594 | 0 |
| C | 0 | 594 | 0 |
| D | 0 | 594 | 0 |
| Quadrant | Total seconds | Saturated seconds | Saturation percentage |
|---|---|---|---|
| A | 29336 | 1618 | 5.515408% |
| B | 29336 | 420 | 1.431688% |
| C | 29336 | 1772 | 6.040360% |
| D | 29336 | 1548 | 5.276793% |
Noise dominated data is calculated using 1-second bins in cleaned event files. If a bin has >2000 counts, and if more than 50% of those come from <1% of pixels, then it is considered to be noise-dominated and hence unusable.
| Quadrant | # 1 sec bins | Bins with >0 counts | Bins with >2000 counts | High rate bins dominated by noise | Noise dominated (total time) | Noise dominated (detector-on time) | Marked lightcurve |
|---|---|---|---|---|---|---|---|
| A | 32041 | 29340 | 1152 | 1152 | 3.60% | 3.93% |  |
| B | 32041 | 29340 | 92 | 92 | 0.29% | 0.31% | 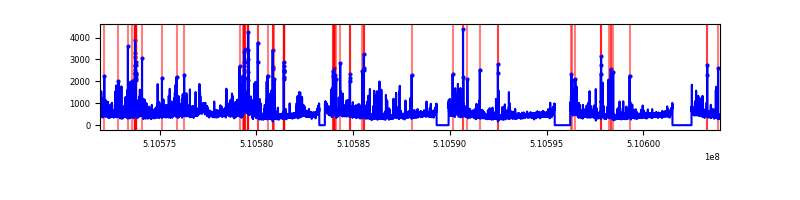 |
| C | 32041 | 29340 | 1544 | 1544 | 4.82% | 5.26% |  |
| D | 32041 | 29340 | 1256 | 1256 | 3.92% | 4.28% |  |
Top three noisy pixels from each quadrant. If the there are fewer than three noisy pixels in the level2.evt file, extra rows are filled as -1
| Pixel properties | Quadrant properties | ||||||
|---|---|---|---|---|---|---|---|
| Quadrant | DetID | PixID | Counts | Sigma | Mean | Median | Sigma |
| A | 4 | 95 | 2031485 | 2610.61 | 3109 | 3031 | 777.0 |
| A | 0 | 8 | 1424336 | 1829.21 | 3109 | 3031 | 777.0 |
| A | 12 | 3 | 1227981 | 1576.5 | 3109 | 3031 | 777.0 |
| B | 5 | 172 | 1082270 | 1624.32 | 3140 | 3027 | 664.4 |
| B | 0 | 63 | 427322 | 638.59 | 3140 | 3027 | 664.4 |
| B | 0 | 153 | 218608 | 324.46 | 3140 | 3027 | 664.4 |
| C | 15 | 230 | 4091870 | 5066.13 | 2973 | 2949 | 807.1 |
| C | 12 | 252 | 467254 | 575.27 | 2973 | 2949 | 807.1 |
| C | 6 | 223 | 321955 | 395.25 | 2973 | 2949 | 807.1 |
| D | 2 | 249 | 2692091 | 3154.31 | 3001 | 2867 | 852.6 |
| D | 12 | 4 | 2122887 | 2486.66 | 3001 | 2867 | 852.6 |
| D | 11 | 176 | 1205750 | 1410.91 | 3001 | 2867 | 852.6 |
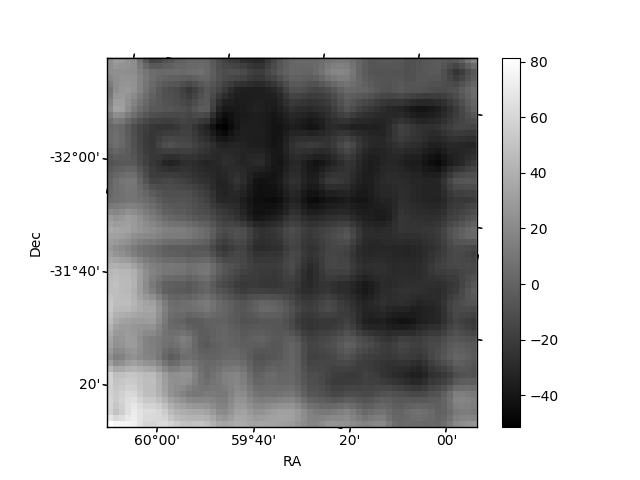
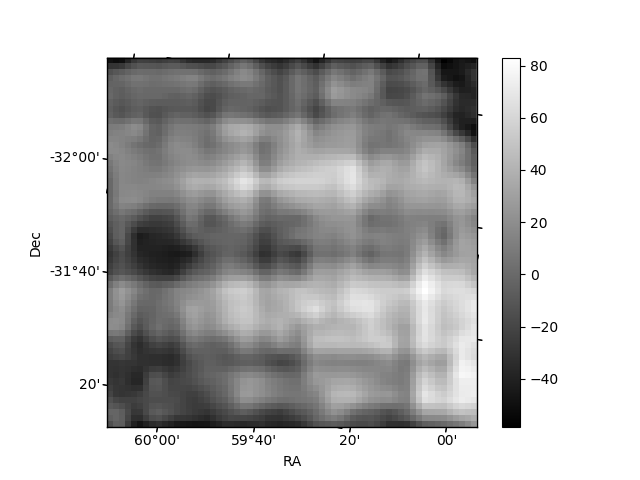
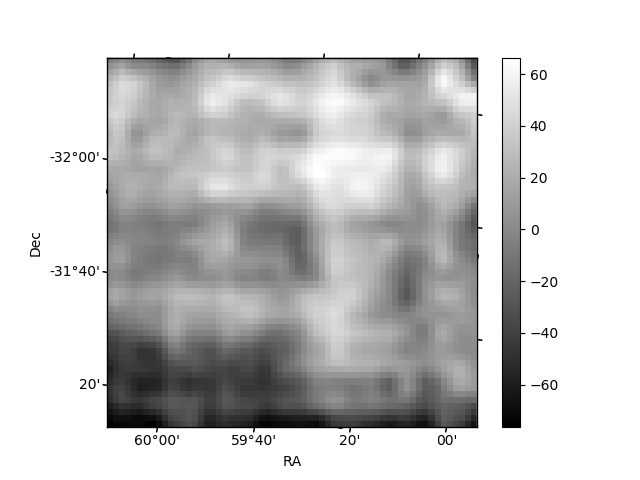
Histogram calculated using DETX and DETY for each event in the final _common_clean file
| Quadrant A | 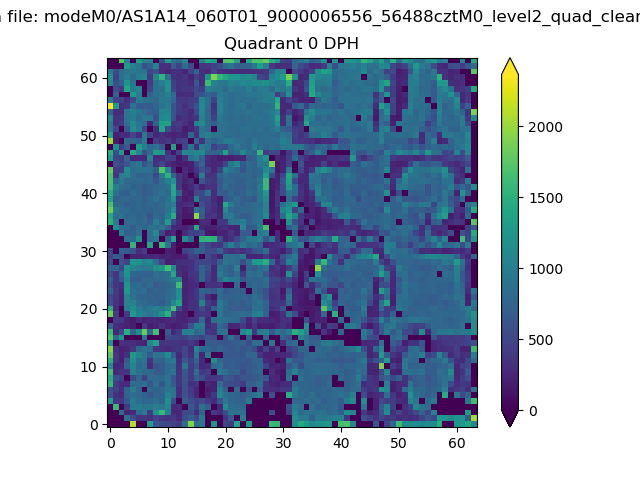 |
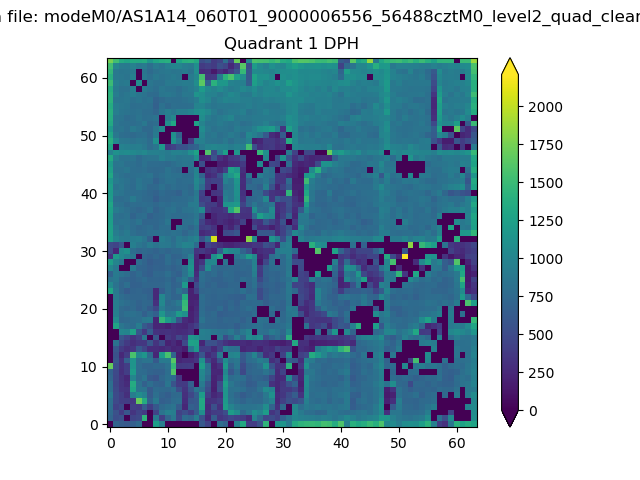 |
Quadrant B |
|---|---|---|---|
| Quadrant D | 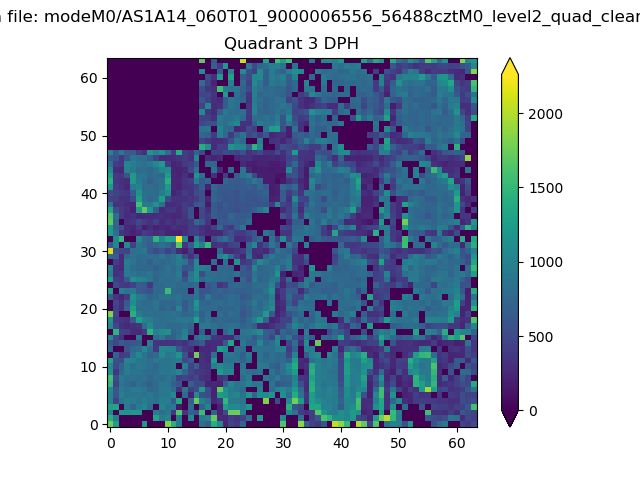 |
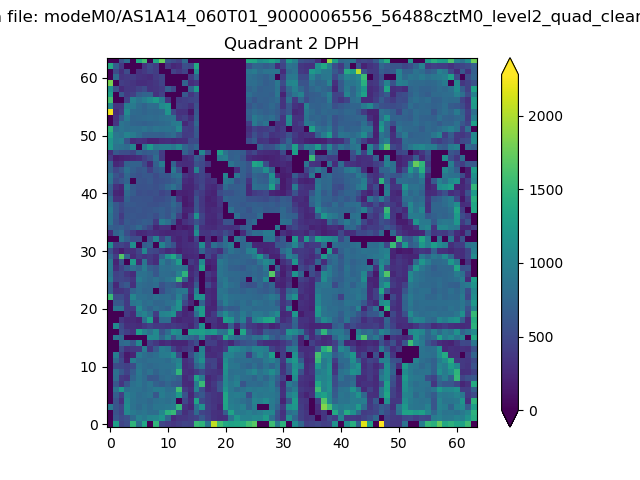 |
Quadrant C |
| Plot type | Count rate plots | Images |
|---|---|---|
| Comparison with Poisson distribution Blue bars denote a histogram of data divided into 1 sec bins. Red curve is a Poisson curve with rate = median count rate of data. |
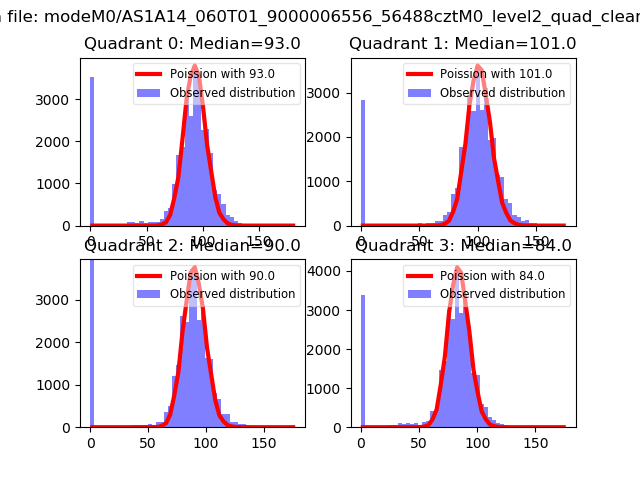 |
 |
| Quadrant-wise count rates Data is divided into 100 sec bins |
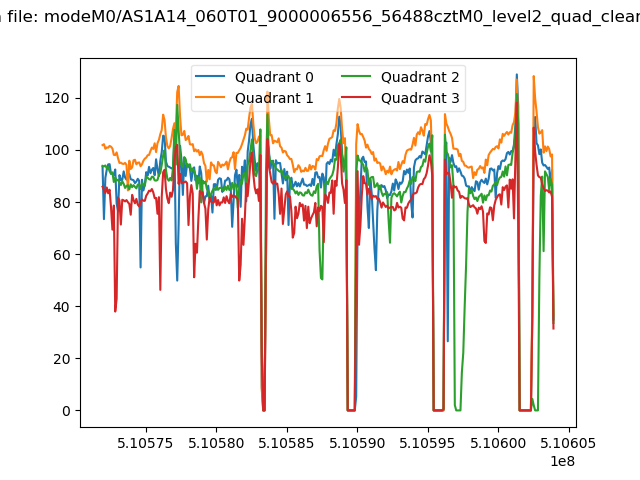 |
|
| Module-wise count rates for Quadrant A Data is divided into 100 sec bins |
 |
 |
| Module-wise count rates for Quadrant B Data is divided into 100 sec bins |
 |
 |
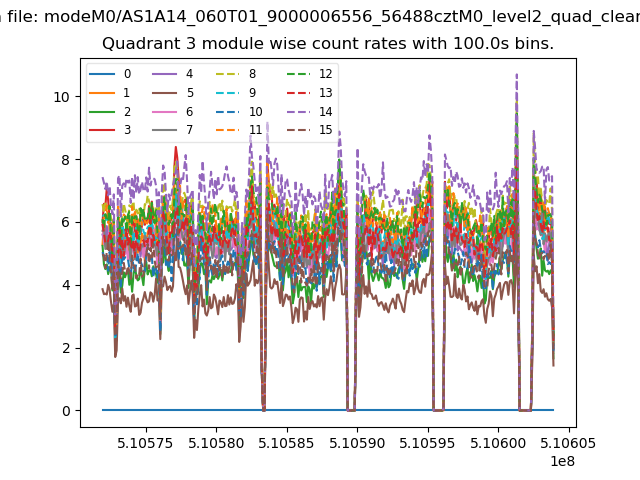
| Module-wise count rates for Quadrant C Data is divided into 100 sec bins |
 |
 |
| Module-wise count rates for Quadrant D Data is divided into 100 sec bins |
 |
 |
| Parameter | Plot |
|---|---|
| CZT HV Monitor | 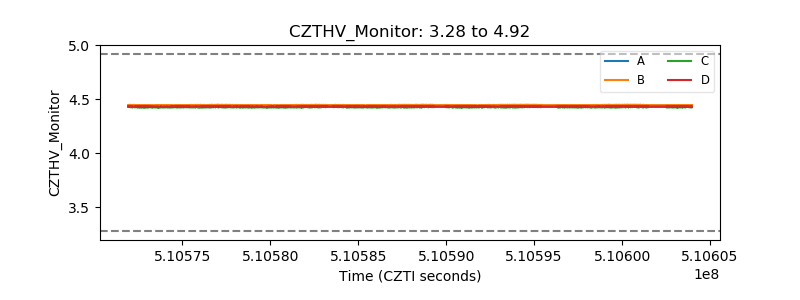 |
| D_VDD |  |
| Temperature 1 | 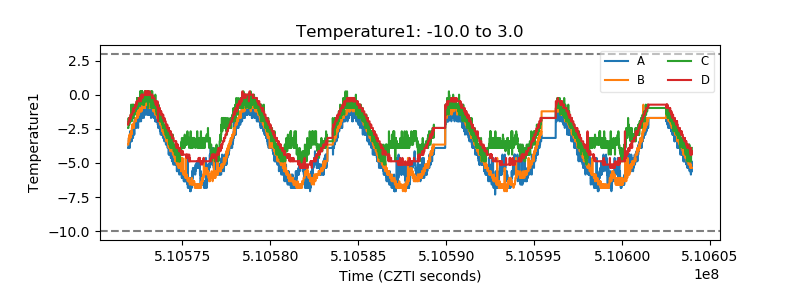 |
| Veto HV Monitor | 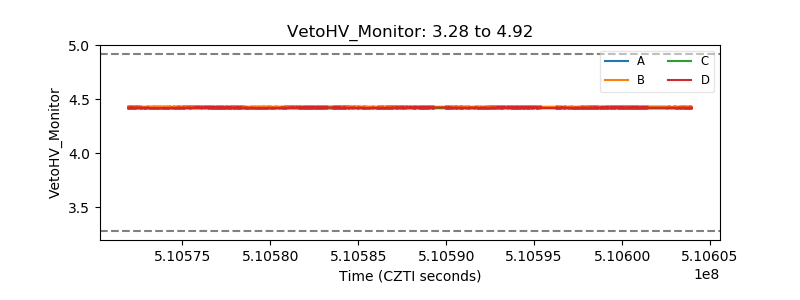 |
| Veto LLD |  |
| Alpha Counter |  |
| _CPM_Rate |  |
| CZT Counter | 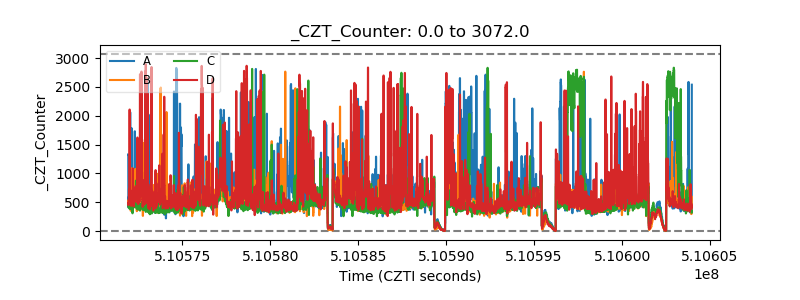 |
| +2.5 Volts monitor | 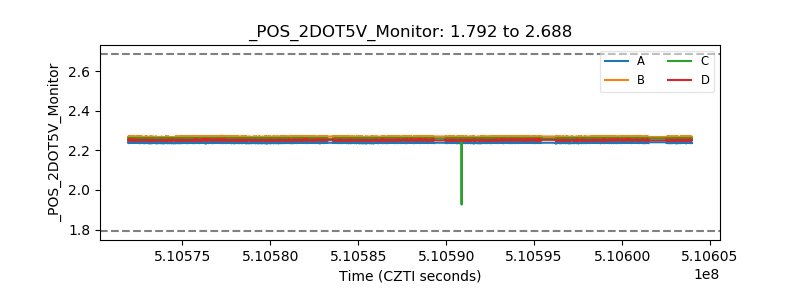 |
| +5 Volts monitor |  |
| _ROLL_ROT | 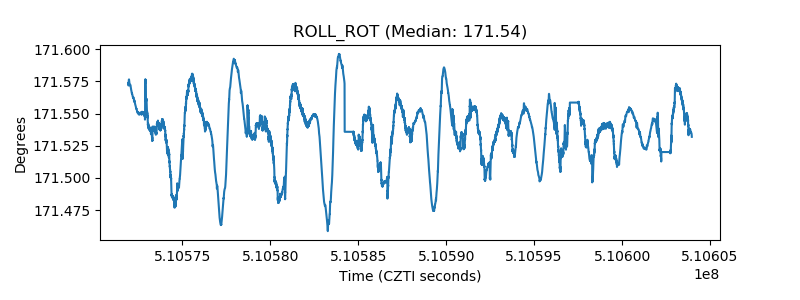 |
| _Roll_DEC |  |
| _Roll_RA | 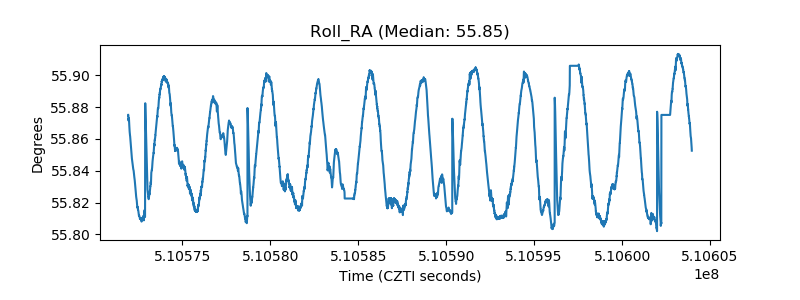 |
| Veto Counter | 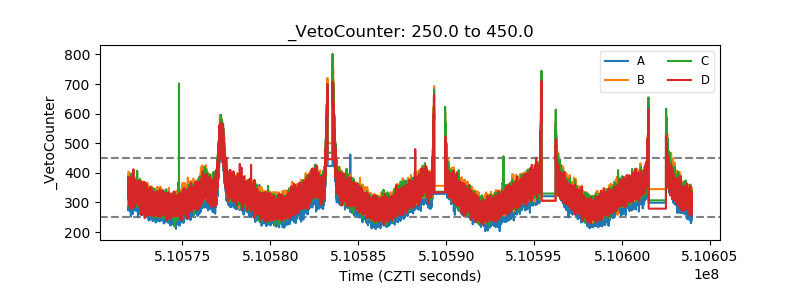 |