| Param | Original file | Final file |
|---|---|---|
| Filename | modeM0/AS1A14_060T01_9000006556_56490cztM0_level2.fits | modeM0/AS1A14_060T01_9000006556_56490cztM0_level2_quad_clean.evt |
| Size (bytes) | 405,469,440 | 90,630,720 |
| Size | 386.7 MB | 86.4 MB |
| Events in quadrant A | 3,965,648 | 590,341 |
| Events in quadrant B | 3,007,351 | 645,641 |
| Events in quadrant C | 3,959,441 | 543,266 |
| Events in quadrant D | 3,592,783 | 530,832 |
| Mode M0 | |||
|---|---|---|---|
| Quadrant | BADHDUFLAG | Total packets | Discarded packets |
| A | 0 | 16300 | 1 |
| B | 0 | 13396 | 1 |
| C | 0 | 16436 | 1 |
| D | 0 | 15012 | 1 |
| Mode M9 | |||
|---|---|---|---|
| Quadrant | BADHDUFLAG | Total packets | Discarded packets |
| A | 0 | 11 | 0 |
| B | 0 | 11 | 0 |
| C | 0 | 11 | 0 |
| D | 0 | 11 | 0 |
| Mode SS | |||
|---|---|---|---|
| Quadrant | BADHDUFLAG | Total packets | Discarded packets |
| A | 0 | 126 | 0 |
| B | 0 | 126 | 0 |
| C | 0 | 126 | 0 |
| D | 0 | 126 | 0 |
| Quadrant | Total seconds | Saturated seconds | Saturation percentage |
|---|---|---|---|
| A | 6223 | 125 | 2.008677% |
| B | 6222 | 50 | 0.803600% |
| C | 6222 | 392 | 6.300225% |
| D | 6223 | 104 | 1.671220% |
Noise dominated data is calculated using 1-second bins in cleaned event files. If a bin has >2000 counts, and if more than 50% of those come from <1% of pixels, then it is considered to be noise-dominated and hence unusable.
| Quadrant | # 1 sec bins | Bins with >0 counts | Bins with >2000 counts | High rate bins dominated by noise | Noise dominated (total time) | Noise dominated (detector-on time) | Marked lightcurve |
|---|---|---|---|---|---|---|---|
| A | 7318 | 6224 | 80 | 80 | 1.09% | 1.29% |  |
| B | 7317 | 6223 | 24 | 24 | 0.33% | 0.39% |  |
| C | 7317 | 6223 | 385 | 385 | 5.26% | 6.19% | 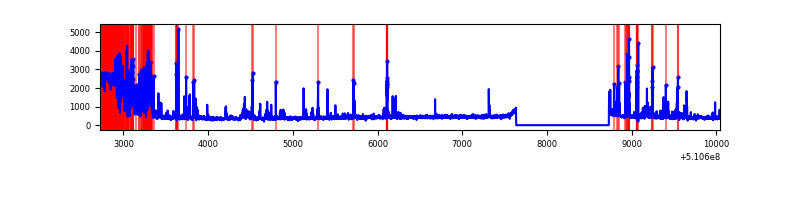 |
| D | 7318 | 6224 | 91 | 91 | 1.24% | 1.46% |  |
Top three noisy pixels from each quadrant. If the there are fewer than three noisy pixels in the level2.evt file, extra rows are filled as -1
| Pixel properties | Quadrant properties | ||||||
|---|---|---|---|---|---|---|---|
| Quadrant | DetID | PixID | Counts | Sigma | Mean | Median | Sigma |
| A | 4 | 95 | 781223 | 4679.04 | 662 | 643 | 166.8 |
| A | 0 | 8 | 337501 | 2019.23 | 662 | 643 | 166.8 |
| A | 12 | 3 | 95453 | 568.32 | 662 | 643 | 166.8 |
| B | 0 | 63 | 115599 | 814.27 | 664 | 643 | 141.2 |
| B | 10 | 247 | 77262 | 542.72 | 664 | 643 | 141.2 |
| B | 4 | 171 | 67147 | 471.07 | 664 | 643 | 141.2 |
| C | 15 | 230 | 1077130 | 6267.04 | 621 | 616 | 171.8 |
| C | 13 | 3 | 263280 | 1529.13 | 621 | 616 | 171.8 |
| C | 6 | 223 | 98624 | 570.56 | 621 | 616 | 171.8 |
| D | 3 | 12 | 427805 | 2338.89 | 635 | 606 | 182.6 |
| D | 2 | 249 | 148058 | 807.29 | 635 | 606 | 182.6 |
| D | 11 | 176 | 120454 | 656.16 | 635 | 606 | 182.6 |
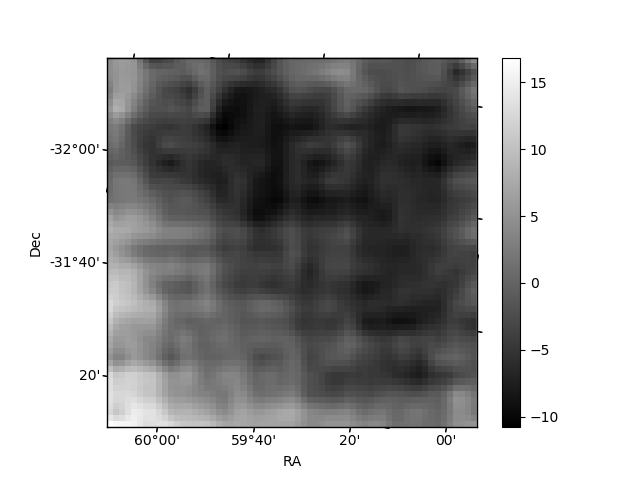
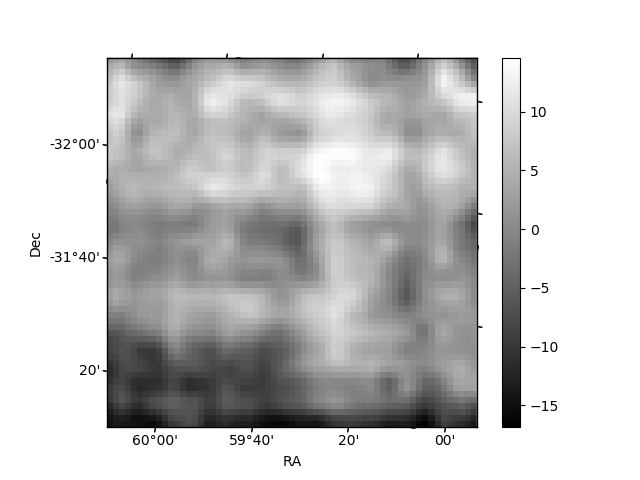
Histogram calculated using DETX and DETY for each event in the final _common_clean file
| Quadrant A | 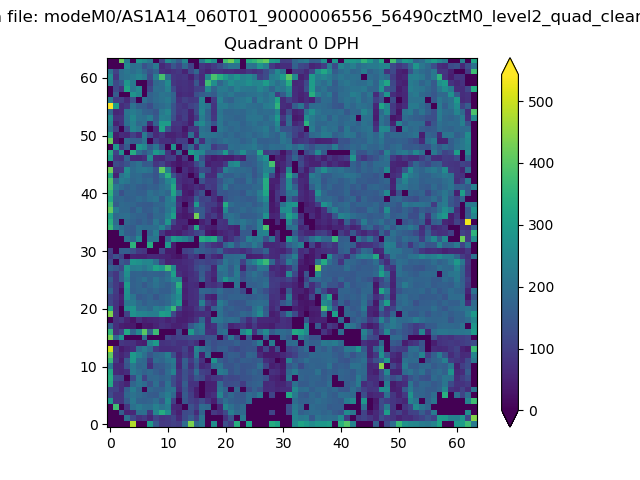 |
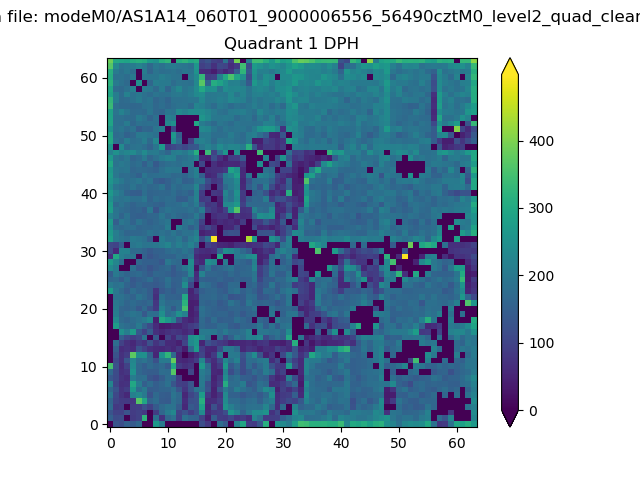 |
Quadrant B |
|---|---|---|---|
| Quadrant D | 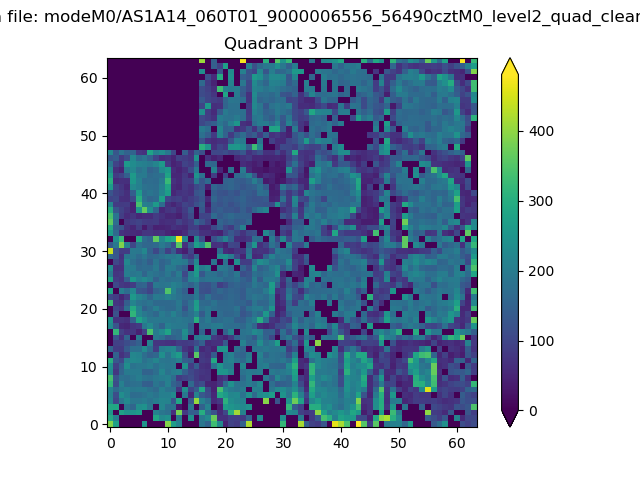 |
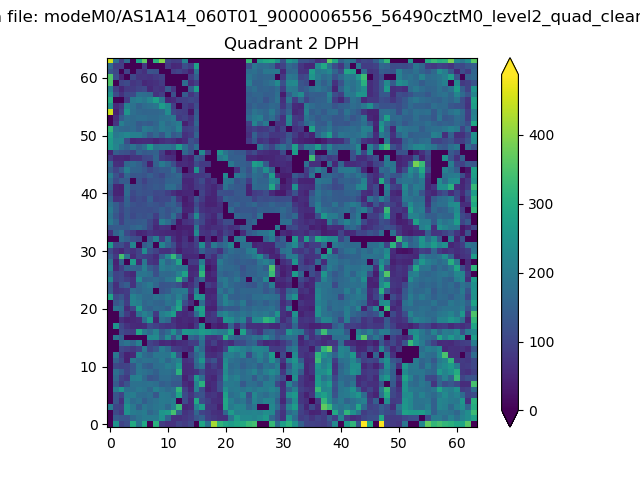 |
Quadrant C |
| Plot type | Count rate plots | Images |
|---|---|---|
| Comparison with Poisson distribution Blue bars denote a histogram of data divided into 1 sec bins. Red curve is a Poisson curve with rate = median count rate of data. |
 |
 |
| Quadrant-wise count rates Data is divided into 100 sec bins |
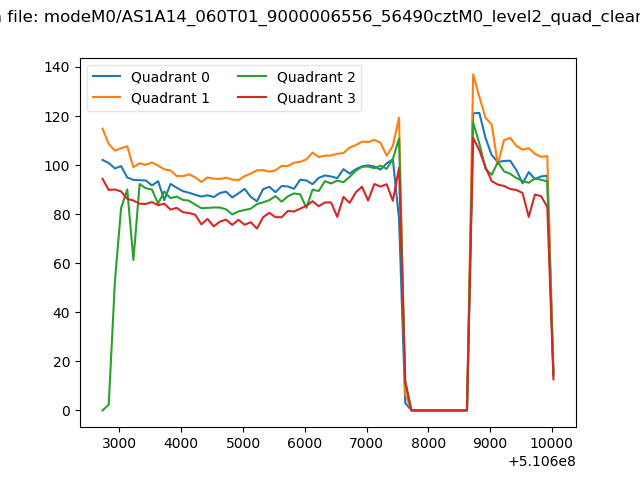 |
|
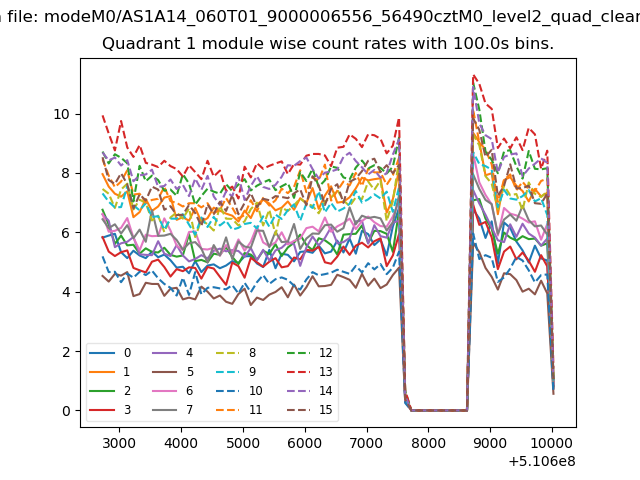
| Module-wise count rates for Quadrant A Data is divided into 100 sec bins |
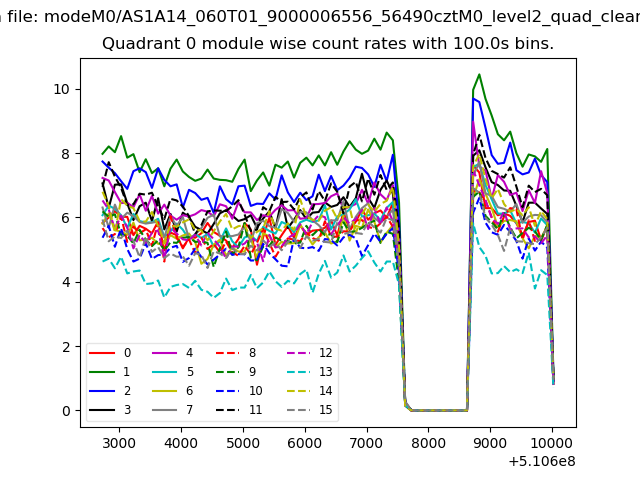 |
 |
| Module-wise count rates for Quadrant B Data is divided into 100 sec bins |
 |
 |
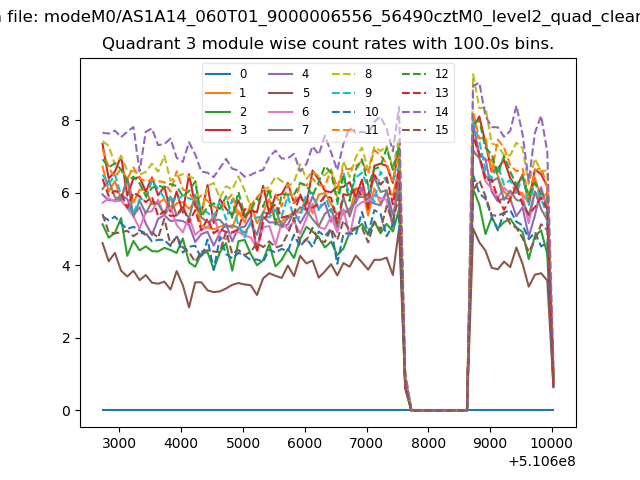
| Module-wise count rates for Quadrant C Data is divided into 100 sec bins |
 |
 |
| Module-wise count rates for Quadrant D Data is divided into 100 sec bins |
 |
 |
| Parameter | Plot |
|---|---|
| CZT HV Monitor |  |
| D_VDD | 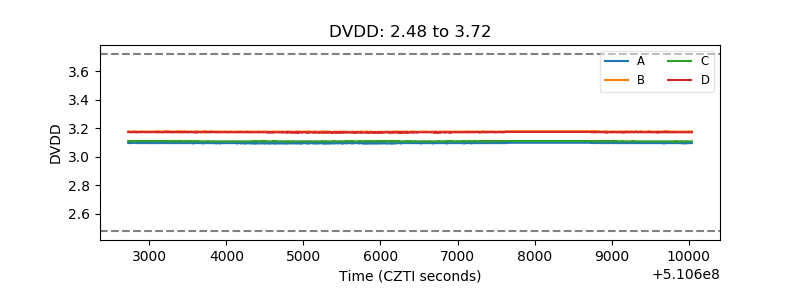 |
| Temperature 1 |  |
| Veto HV Monitor | 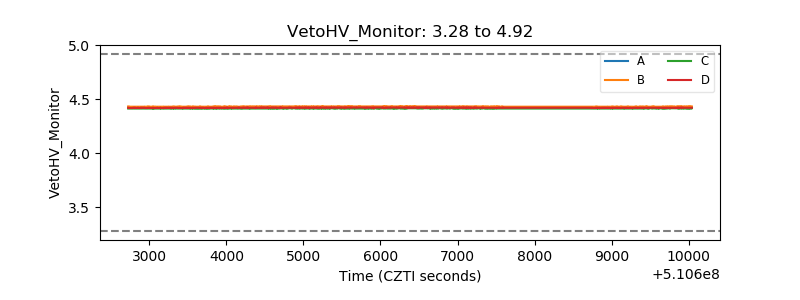 |
| Veto LLD | 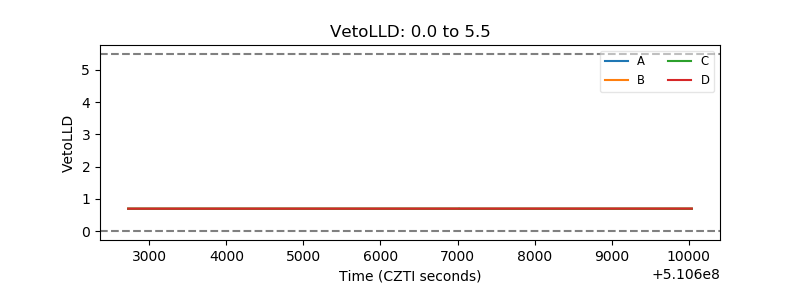 |
| Alpha Counter |  |
| _CPM_Rate |  |
| CZT Counter | 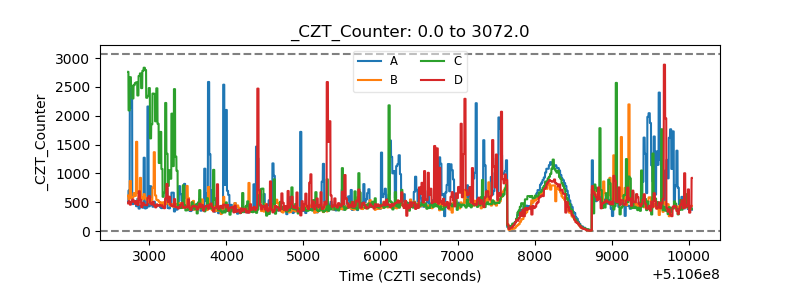 |
| +2.5 Volts monitor | 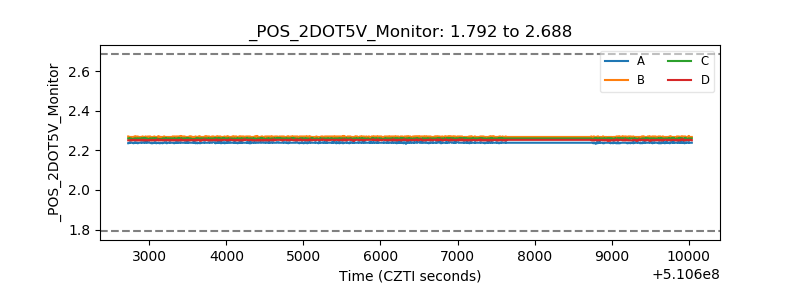 |
| +5 Volts monitor |  |
| _ROLL_ROT | 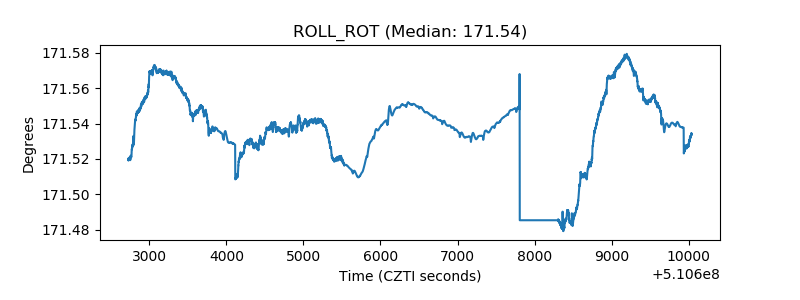 |
| _Roll_DEC | 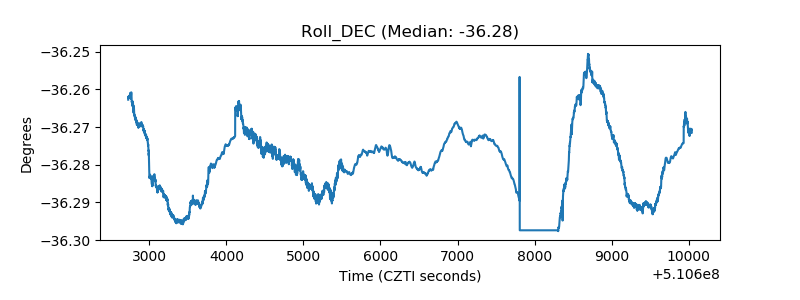 |
| _Roll_RA |  |
| Veto Counter | 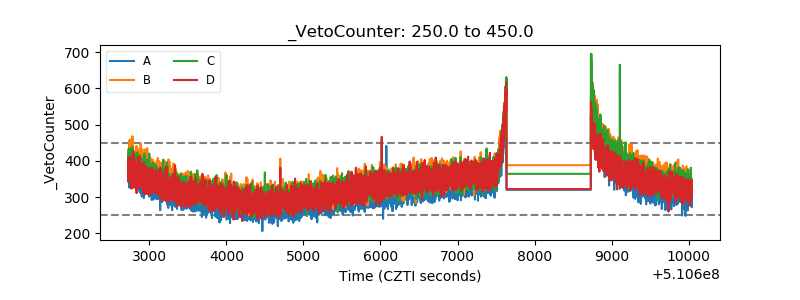 |