| Param | Original file | Final file |
|---|---|---|
| Filename | modeM0/AS1A14_060T01_9000006556_56491cztM0_level2.fits | modeM0/AS1A14_060T01_9000006556_56491cztM0_level2_quad_clean.evt |
| Size (bytes) | 417,389,760 | 96,033,600 |
| Size | 398.1 MB | 91.6 MB |
| Events in quadrant A | 4,019,000 | 622,531 |
| Events in quadrant B | 3,387,535 | 682,150 |
| Events in quadrant C | 3,827,175 | 593,429 |
| Events in quadrant D | 3,718,088 | 562,090 |
| Mode M0 | |||
|---|---|---|---|
| Quadrant | BADHDUFLAG | Total packets | Discarded packets |
| A | 0 | 16430 | 2 |
| B | 0 | 14451 | 2 |
| C | 0 | 16023 | 2 |
| D | 0 | 15398 | 2 |
| Mode M9 | |||
|---|---|---|---|
| Quadrant | BADHDUFLAG | Total packets | Discarded packets |
| A | 0 | 14 | 0 |
| B | 0 | 15 | 0 |
| C | 0 | 15 | 0 |
| D | 0 | 15 | 0 |
| Mode SS | |||
|---|---|---|---|
| Quadrant | BADHDUFLAG | Total packets | Discarded packets |
| A | 0 | 132 | 0 |
| B | 0 | 132 | 0 |
| C | 0 | 132 | 0 |
| D | 0 | 132 | 0 |
| Quadrant | Total seconds | Saturated seconds | Saturation percentage |
|---|---|---|---|
| A | 6410 | 154 | 2.402496% |
| B | 6410 | 127 | 1.981279% |
| C | 6410 | 240 | 3.744150% |
| D | 6410 | 84 | 1.310452% |
Noise dominated data is calculated using 1-second bins in cleaned event files. If a bin has >2000 counts, and if more than 50% of those come from <1% of pixels, then it is considered to be noise-dominated and hence unusable.
| Quadrant | # 1 sec bins | Bins with >0 counts | Bins with >2000 counts | High rate bins dominated by noise | Noise dominated (total time) | Noise dominated (detector-on time) | Marked lightcurve |
|---|---|---|---|---|---|---|---|
| A | 7550 | 6411 | 126 | 126 | 1.67% | 1.97% | 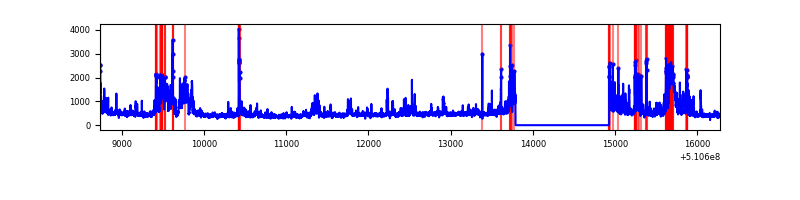 |
| B | 7550 | 6411 | 54 | 54 | 0.72% | 0.84% | 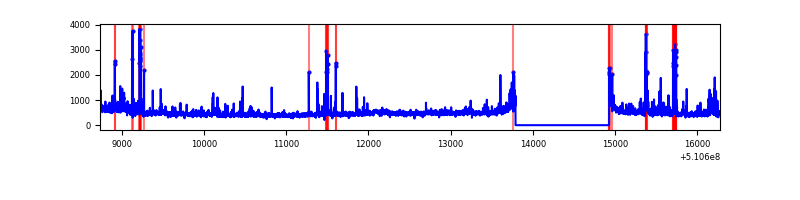 |
| C | 7550 | 6410 | 204 | 204 | 2.70% | 3.18% |  |
| D | 7550 | 6411 | 75 | 75 | 0.99% | 1.17% |  |
Top three noisy pixels from each quadrant. If the there are fewer than three noisy pixels in the level2.evt file, extra rows are filled as -1
| Pixel properties | Quadrant properties | ||||||
|---|---|---|---|---|---|---|---|
| Quadrant | DetID | PixID | Counts | Sigma | Mean | Median | Sigma |
| A | 4 | 95 | 845657 | 4861.16 | 699 | 683 | 173.8 |
| A | 7 | 64 | 128098 | 733.02 | 699 | 683 | 173.8 |
| A | 4 | 206 | 83433 | 476.06 | 699 | 683 | 173.8 |
| B | 4 | 206 | 136513 | 917.88 | 700 | 678 | 148.0 |
| B | 4 | 171 | 125022 | 840.23 | 700 | 678 | 148.0 |
| B | 0 | 63 | 101384 | 680.5 | 700 | 678 | 148.0 |
| C | 15 | 230 | 408370 | 2200.86 | 670 | 666 | 185.2 |
| C | 13 | 3 | 288494 | 1553.75 | 670 | 666 | 185.2 |
| C | 6 | 223 | 179998 | 968.07 | 670 | 666 | 185.2 |
| D | 3 | 12 | 268919 | 1390.53 | 673 | 642 | 192.9 |
| D | 2 | 249 | 139139 | 717.86 | 673 | 642 | 192.9 |
| D | 9 | 49 | 115632 | 596.01 | 673 | 642 | 192.9 |
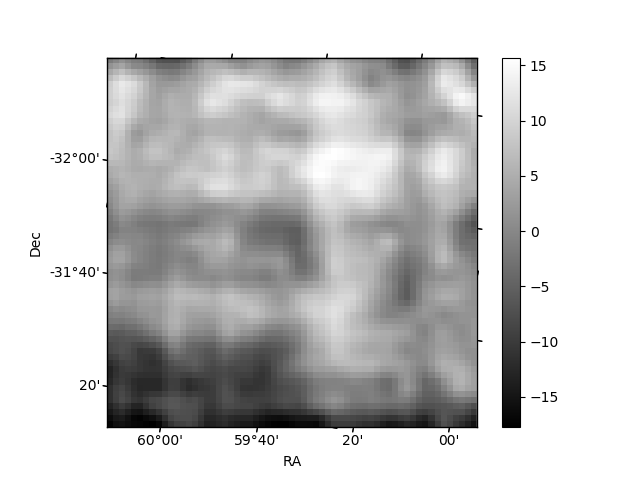
Histogram calculated using DETX and DETY for each event in the final _common_clean file
| Quadrant A | 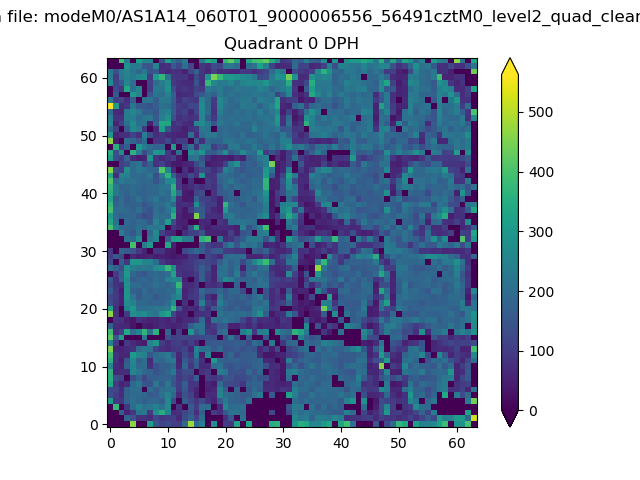 |
 |
Quadrant B |
|---|---|---|---|
| Quadrant D | 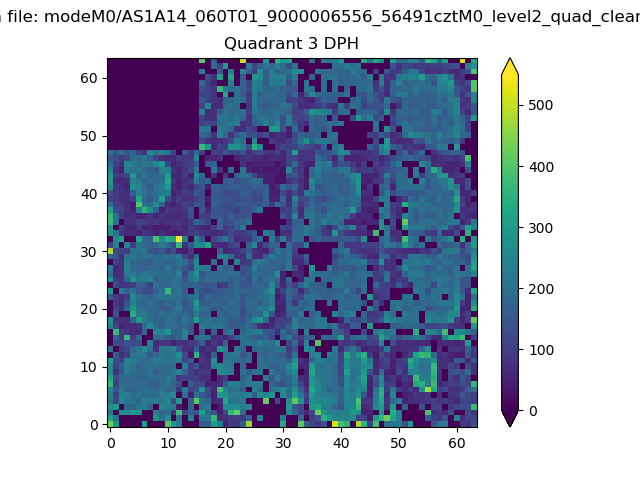 |
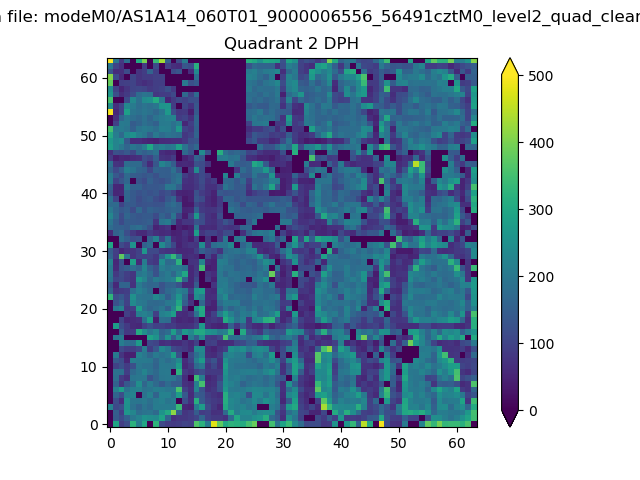 |
Quadrant C |
| Plot type | Count rate plots | Images |
|---|---|---|
| Comparison with Poisson distribution Blue bars denote a histogram of data divided into 1 sec bins. Red curve is a Poisson curve with rate = median count rate of data. |
 |
 |
| Quadrant-wise count rates Data is divided into 100 sec bins |
 |
|
| Module-wise count rates for Quadrant A Data is divided into 100 sec bins |
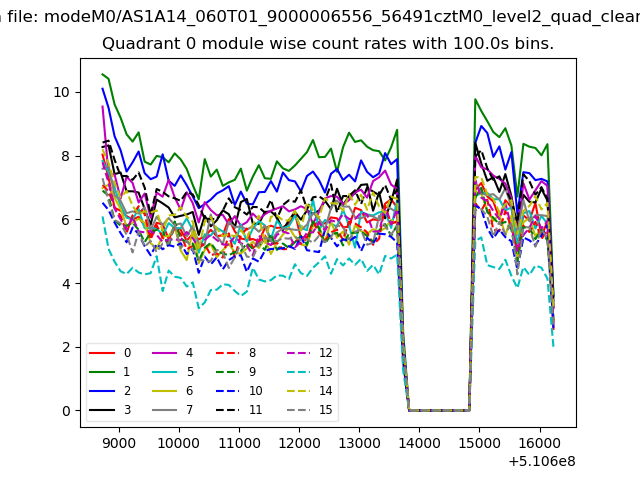 |
 |
| Module-wise count rates for Quadrant B Data is divided into 100 sec bins |
 |
 |
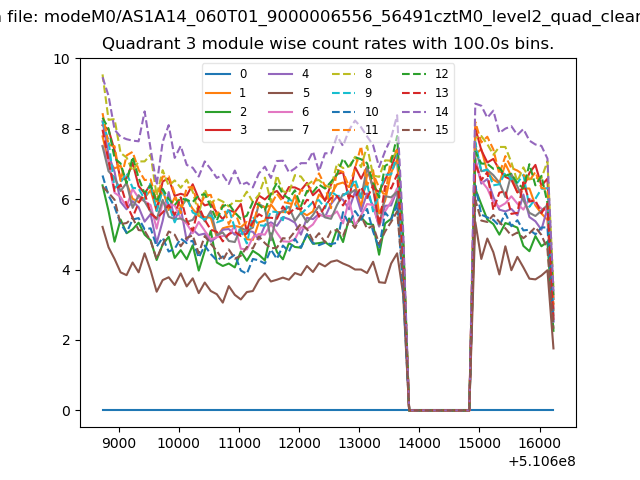
| Module-wise count rates for Quadrant C Data is divided into 100 sec bins |
 |
 |
| Module-wise count rates for Quadrant D Data is divided into 100 sec bins |
 |
 |
| Parameter | Plot |
|---|---|
| CZT HV Monitor | 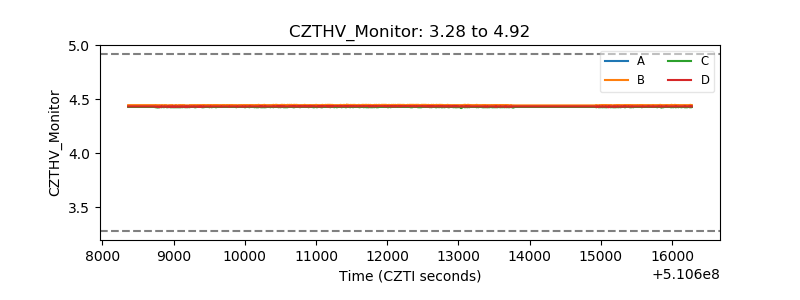 |
| D_VDD |  |
| Temperature 1 | 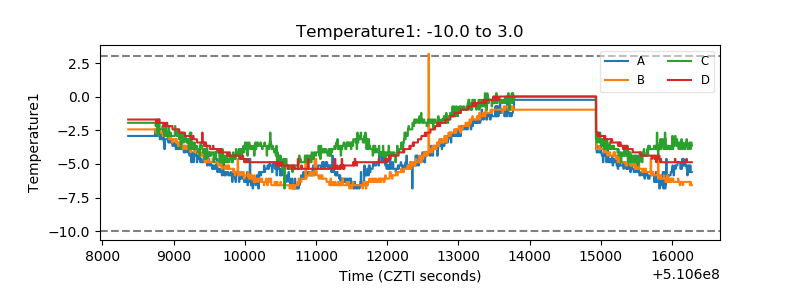 |
| Veto HV Monitor | 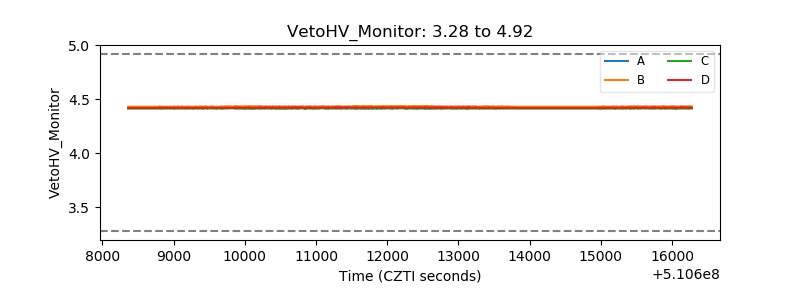 |
| Veto LLD |  |
| Alpha Counter |  |
| _CPM_Rate |  |
| CZT Counter | 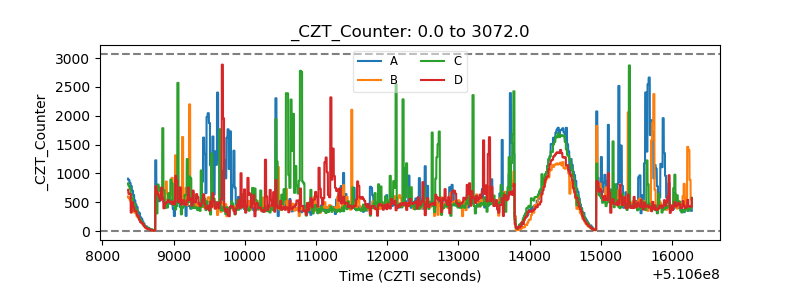 |
| +2.5 Volts monitor | 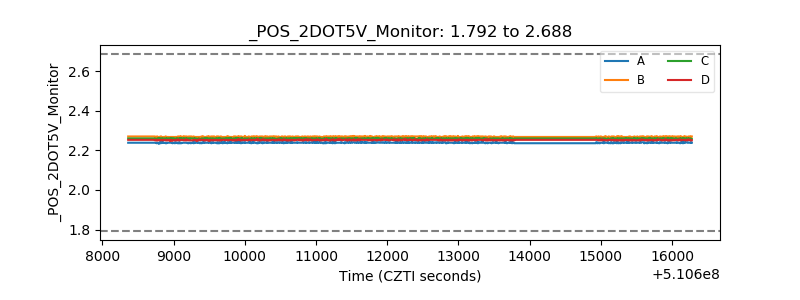 |
| +5 Volts monitor |  |
| _ROLL_ROT | 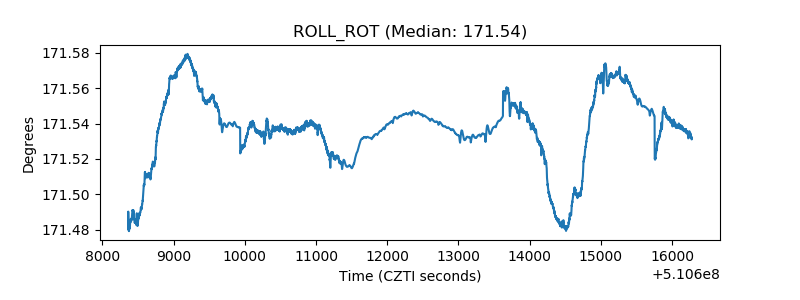 |
| _Roll_DEC | 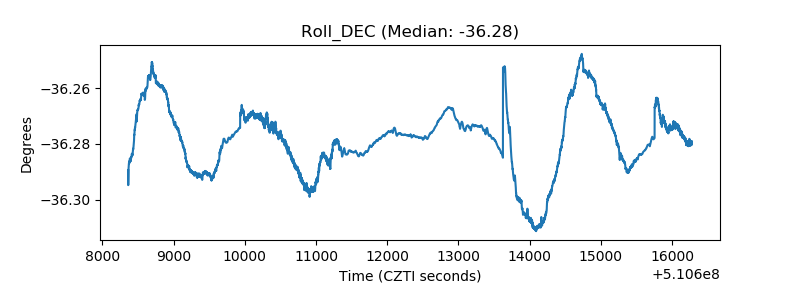 |
| _Roll_RA | 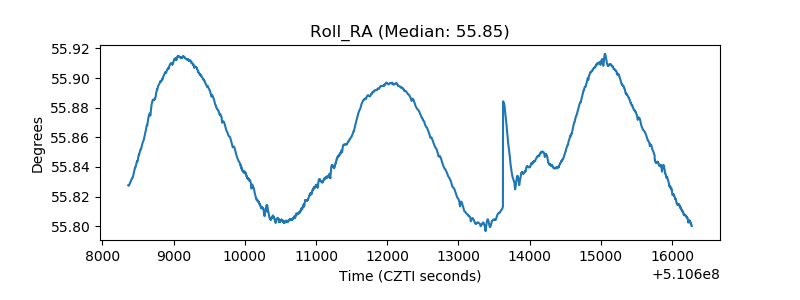 |
| Veto Counter | 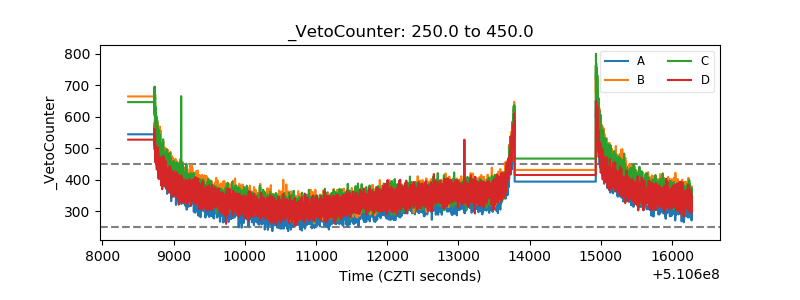 |