| Param | Original file | Final file |
|---|---|---|
| Filename | modeM0/AS1A14_060T01_9000006556_56492cztM0_level2.fits | modeM0/AS1A14_060T01_9000006556_56492cztM0_level2_quad_clean.evt |
| Size (bytes) | 486,466,560 | 92,718,720 |
| Size | 463.9 MB | 88.4 MB |
| Events in quadrant A | 6,061,647 | 579,045 |
| Events in quadrant B | 3,521,772 | 675,061 |
| Events in quadrant C | 3,731,075 | 572,989 |
| Events in quadrant D | 4,205,665 | 542,282 |
| Mode M0 | |||
|---|---|---|---|
| Quadrant | BADHDUFLAG | Total packets | Discarded packets |
| A | 0 | 22370 | 2 |
| B | 0 | 14735 | 2 |
| C | 0 | 15571 | 2 |
| D | 0 | 16835 | 2 |
| Mode M9 | |||
|---|---|---|---|
| Quadrant | BADHDUFLAG | Total packets | Discarded packets |
| A | 0 | 20 | 0 |
| B | 0 | 20 | 0 |
| C | 0 | 21 | 0 |
| D | 0 | 21 | 0 |
| Mode SS | |||
|---|---|---|---|
| Quadrant | BADHDUFLAG | Total packets | Discarded packets |
| A | 0 | 128 | 0 |
| B | 0 | 128 | 0 |
| C | 0 | 128 | 0 |
| D | 0 | 128 | 0 |
| Quadrant | Total seconds | Saturated seconds | Saturation percentage |
|---|---|---|---|
| A | 6275 | 651 | 10.374502% |
| B | 6275 | 139 | 2.215139% |
| C | 6275 | 348 | 5.545817% |
| D | 6275 | 244 | 3.888446% |
Noise dominated data is calculated using 1-second bins in cleaned event files. If a bin has >2000 counts, and if more than 50% of those come from <1% of pixels, then it is considered to be noise-dominated and hence unusable.
| Quadrant | # 1 sec bins | Bins with >0 counts | Bins with >2000 counts | High rate bins dominated by noise | Noise dominated (total time) | Noise dominated (detector-on time) | Marked lightcurve |
|---|---|---|---|---|---|---|---|
| A | 7475 | 6275 | 579 | 579 | 7.75% | 9.23% |  |
| B | 7475 | 6276 | 55 | 55 | 0.74% | 0.88% |  |
| C | 7475 | 6276 | 236 | 236 | 3.16% | 3.76% | 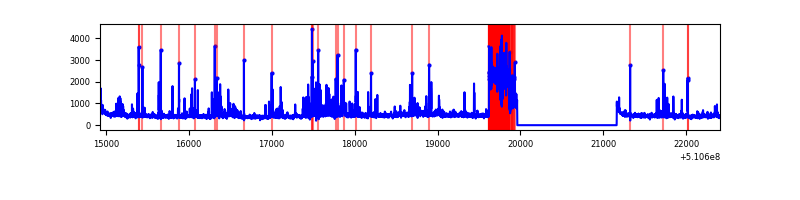 |
| D | 7475 | 6276 | 208 | 208 | 2.78% | 3.31% |  |
Top three noisy pixels from each quadrant. If the there are fewer than three noisy pixels in the level2.evt file, extra rows are filled as -1
| Pixel properties | Quadrant properties | ||||||
|---|---|---|---|---|---|---|---|
| Quadrant | DetID | PixID | Counts | Sigma | Mean | Median | Sigma |
| A | 7 | 64 | 1702830 | 10226.44 | 672 | 657 | 166.4 |
| A | 4 | 95 | 1120011 | 6724.93 | 672 | 657 | 166.4 |
| A | 3 | 14 | 299556 | 1795.75 | 672 | 657 | 166.4 |
| B | 4 | 206 | 448791 | 3072.88 | 692 | 668 | 145.8 |
| B | 4 | 171 | 88292 | 600.86 | 692 | 668 | 145.8 |
| B | 0 | 213 | 57004 | 386.31 | 692 | 668 | 145.8 |
| C | 15 | 230 | 682549 | 3764.3 | 656 | 651 | 181.1 |
| C | 13 | 3 | 213363 | 1174.24 | 656 | 651 | 181.1 |
| C | 12 | 249 | 105486 | 578.72 | 656 | 651 | 181.1 |
| D | 3 | 12 | 509465 | 2674.86 | 662 | 631 | 190.2 |
| D | 11 | 176 | 432893 | 2272.34 | 662 | 631 | 190.2 |
| D | 2 | 249 | 221610 | 1161.65 | 662 | 631 | 190.2 |
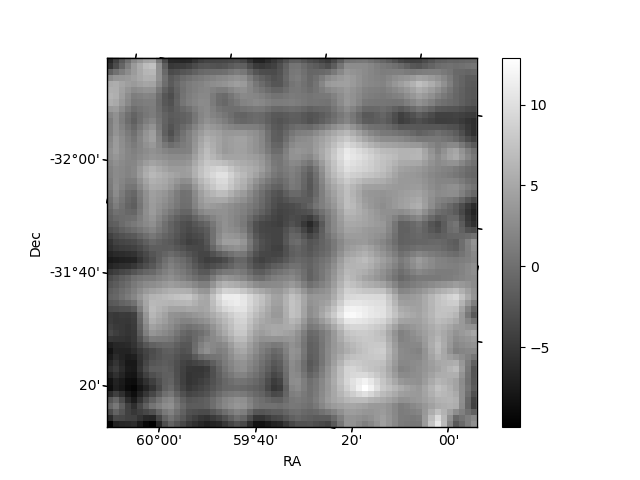
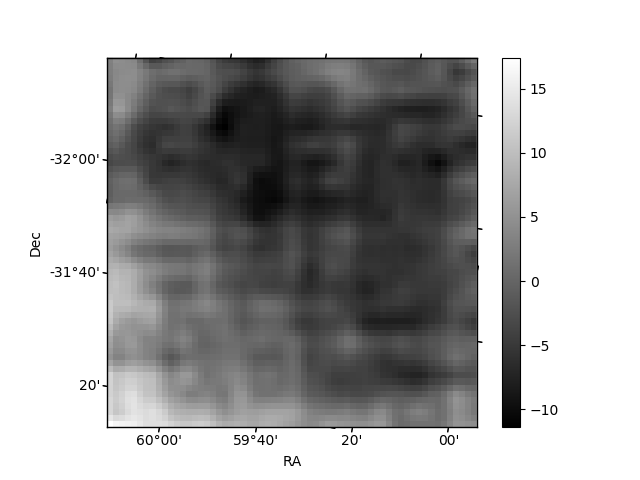
Histogram calculated using DETX and DETY for each event in the final _common_clean file
| Quadrant A | 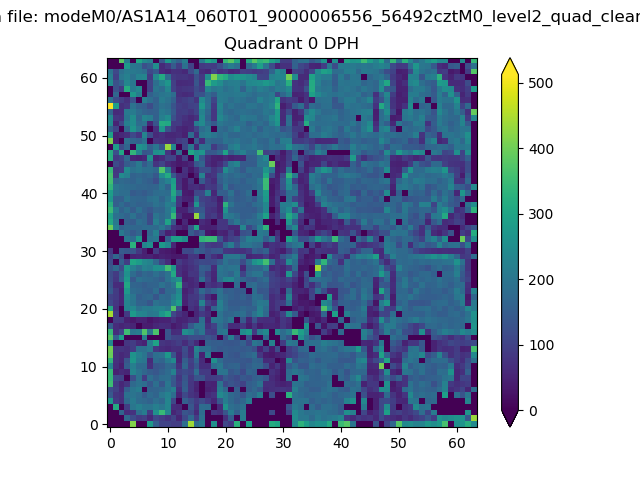 |
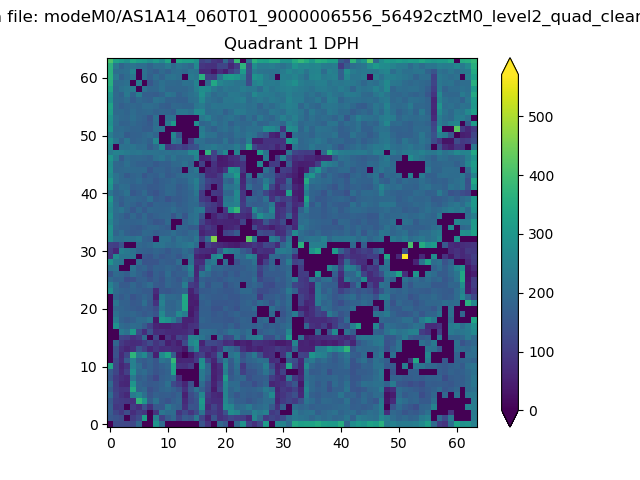 |
Quadrant B |
|---|---|---|---|
| Quadrant D |  |
 |
Quadrant C |
| Plot type | Count rate plots | Images |
|---|---|---|
| Comparison with Poisson distribution Blue bars denote a histogram of data divided into 1 sec bins. Red curve is a Poisson curve with rate = median count rate of data. |
 |
 |
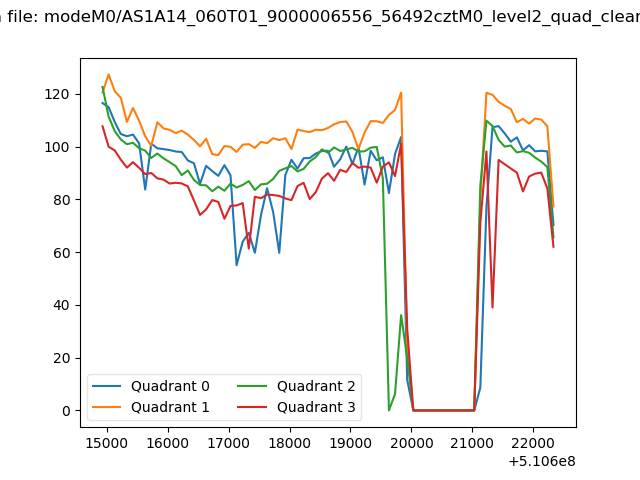
| Quadrant-wise count rates Data is divided into 100 sec bins |
 |
|
| Module-wise count rates for Quadrant A Data is divided into 100 sec bins |
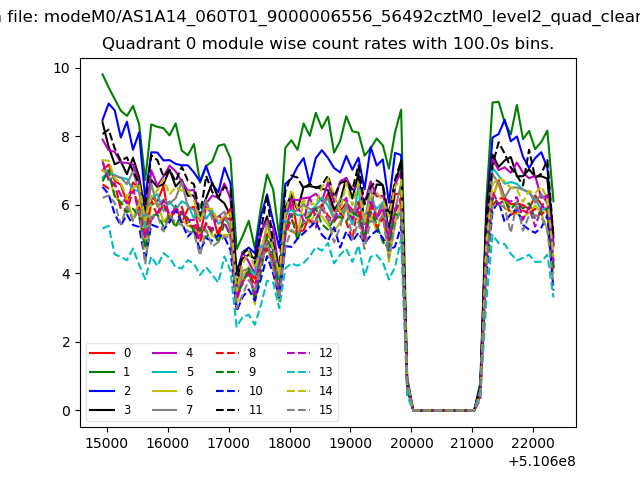 |
 |
| Module-wise count rates for Quadrant B Data is divided into 100 sec bins |
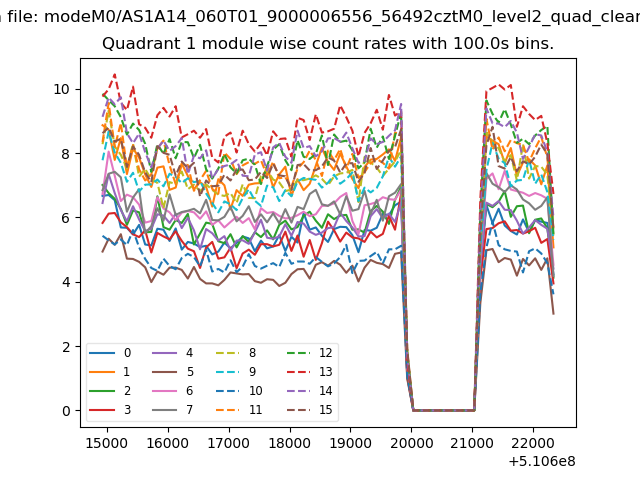 |
 |
| Module-wise count rates for Quadrant C Data is divided into 100 sec bins |
 |
 |
| Module-wise count rates for Quadrant D Data is divided into 100 sec bins |
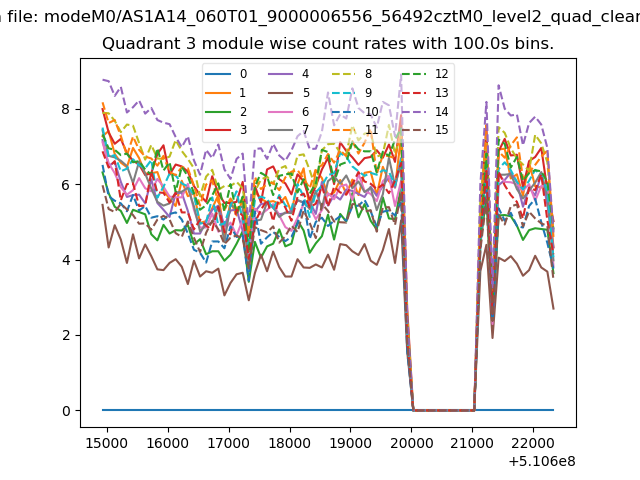 |
 |
| Parameter | Plot |
|---|---|
| CZT HV Monitor |  |
| D_VDD |  |
| Temperature 1 |  |
| Veto HV Monitor | 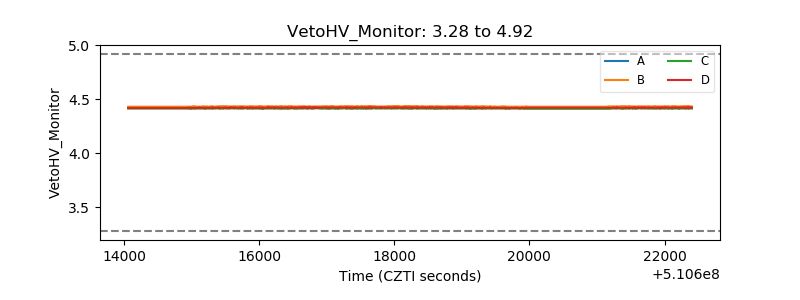 |
| Veto LLD | 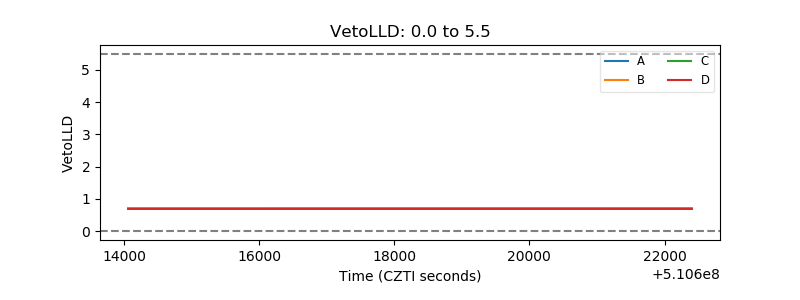 |
| Alpha Counter |  |
| _CPM_Rate | 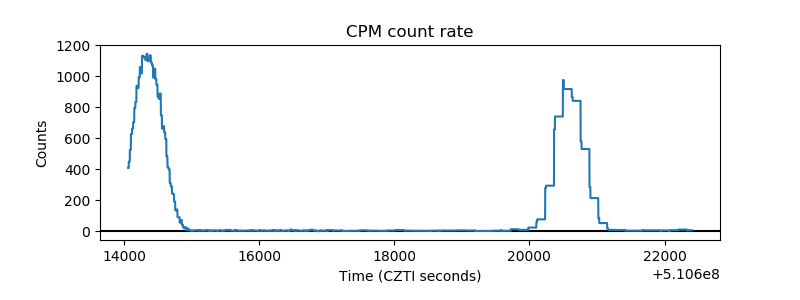 |
| CZT Counter | 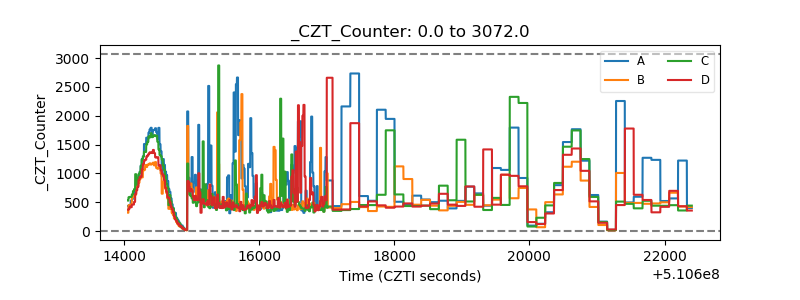 |
| +2.5 Volts monitor |  |
| +5 Volts monitor |  |
| _ROLL_ROT | 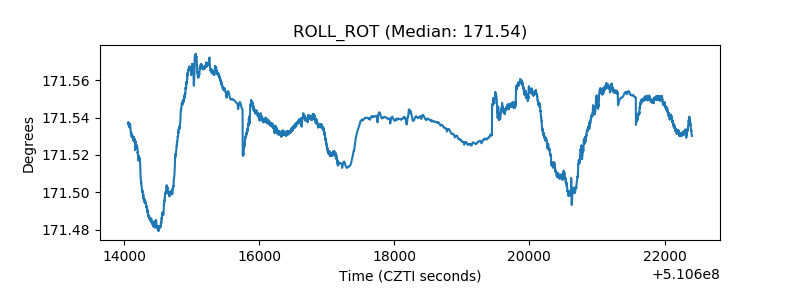 |
| _Roll_DEC | 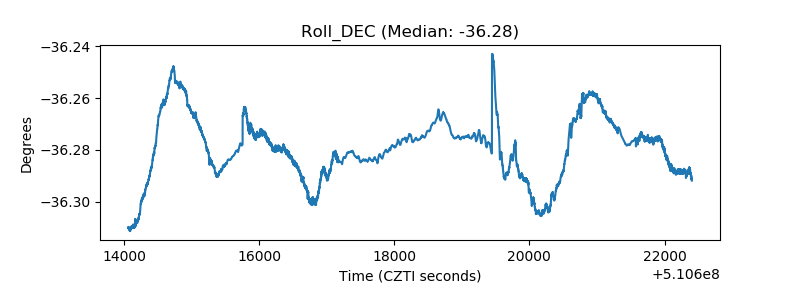 |
| _Roll_RA | 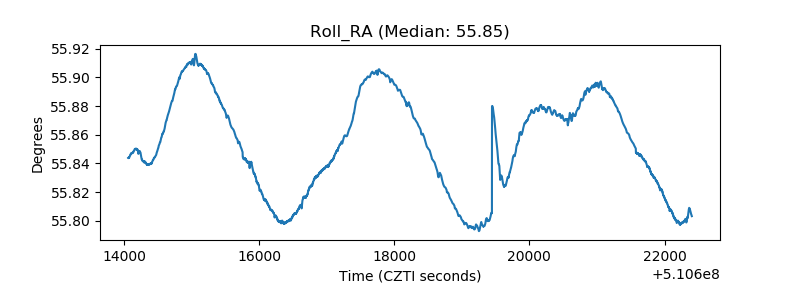 |
| Veto Counter | 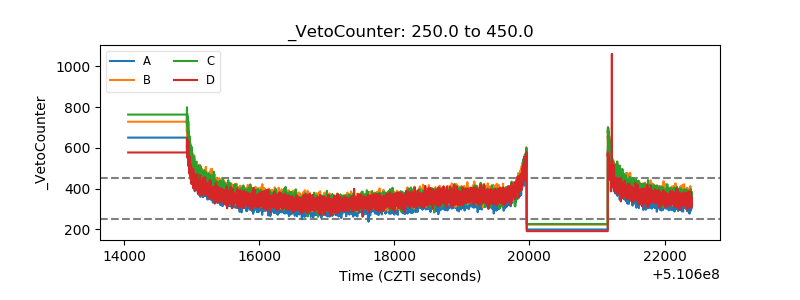 |