| Param | Original file | Final file |
|---|---|---|
| Filename | modeM0/AS1A14_060T01_9000006556_56493cztM0_level2.fits | modeM0/AS1A14_060T01_9000006556_56493cztM0_level2_quad_clean.evt |
| Size (bytes) | 431,660,160 | 99,584,640 |
| Size | 411.7 MB | 95.0 MB |
| Events in quadrant A | 4,480,837 | 636,924 |
| Events in quadrant B | 3,301,308 | 717,132 |
| Events in quadrant C | 3,282,200 | 627,840 |
| Events in quadrant D | 4,395,671 | 567,851 |
| Mode M0 | |||
|---|---|---|---|
| Quadrant | BADHDUFLAG | Total packets | Discarded packets |
| A | 0 | 17944 | 2 |
| B | 0 | 14431 | 2 |
| C | 0 | 14662 | 2 |
| D | 0 | 17736 | 2 |
| Mode M9 | |||
|---|---|---|---|
| Quadrant | BADHDUFLAG | Total packets | Discarded packets |
| A | 0 | 15 | 0 |
| B | 0 | 15 | 0 |
| C | 0 | 16 | 0 |
| D | 0 | 16 | 0 |
| Mode SS | |||
|---|---|---|---|
| Quadrant | BADHDUFLAG | Total packets | Discarded packets |
| A | 0 | 138 | 0 |
| B | 0 | 138 | 0 |
| C | 0 | 138 | 0 |
| D | 0 | 138 | 0 |
| Quadrant | Total seconds | Saturated seconds | Saturation percentage |
|---|---|---|---|
| A | 6673 | 257 | 3.851341% |
| B | 6673 | 76 | 1.138918% |
| C | 6673 | 110 | 1.648434% |
| D | 6673 | 293 | 4.390829% |
Noise dominated data is calculated using 1-second bins in cleaned event files. If a bin has >2000 counts, and if more than 50% of those come from <1% of pixels, then it is considered to be noise-dominated and hence unusable.
| Quadrant | # 1 sec bins | Bins with >0 counts | Bins with >2000 counts | High rate bins dominated by noise | Noise dominated (total time) | Noise dominated (detector-on time) | Marked lightcurve |
|---|---|---|---|---|---|---|---|
| A | 7823 | 6674 | 216 | 216 | 2.76% | 3.24% | 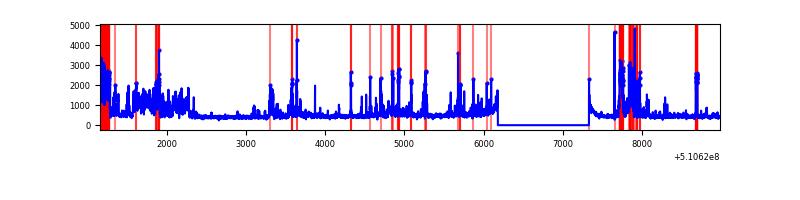 |
| B | 7823 | 6674 | 23 | 23 | 0.29% | 0.34% |  |
| C | 7823 | 6673 | 58 | 58 | 0.74% | 0.87% | 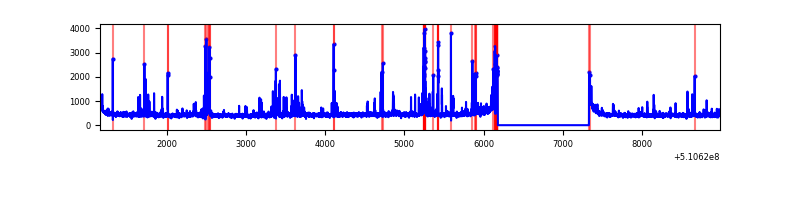 |
| D | 7823 | 6674 | 257 | 257 | 3.29% | 3.85% |  |
Top three noisy pixels from each quadrant. If the there are fewer than three noisy pixels in the level2.evt file, extra rows are filled as -1
| Pixel properties | Quadrant properties | ||||||
|---|---|---|---|---|---|---|---|
| Quadrant | DetID | PixID | Counts | Sigma | Mean | Median | Sigma |
| A | 4 | 95 | 979084 | 5446.89 | 730 | 711 | 179.6 |
| A | 3 | 14 | 206037 | 1143.11 | 730 | 711 | 179.6 |
| A | 0 | 8 | 123518 | 683.7 | 730 | 711 | 179.6 |
| B | 4 | 206 | 109020 | 685.19 | 739 | 712 | 158.1 |
| B | 4 | 190 | 34218 | 211.97 | 739 | 712 | 158.1 |
| B | 0 | 213 | 28309 | 174.59 | 739 | 712 | 158.1 |
| C | 13 | 3 | 216756 | 1089.49 | 722 | 715 | 198.3 |
| C | 6 | 223 | 124058 | 622.02 | 722 | 715 | 198.3 |
| C | 15 | 230 | 35438 | 175.11 | 722 | 715 | 198.3 |
| D | 11 | 176 | 701055 | 3505.71 | 703 | 672 | 199.8 |
| D | 2 | 249 | 334292 | 1669.91 | 703 | 672 | 199.8 |
| D | 3 | 12 | 211114 | 1053.35 | 703 | 672 | 199.8 |
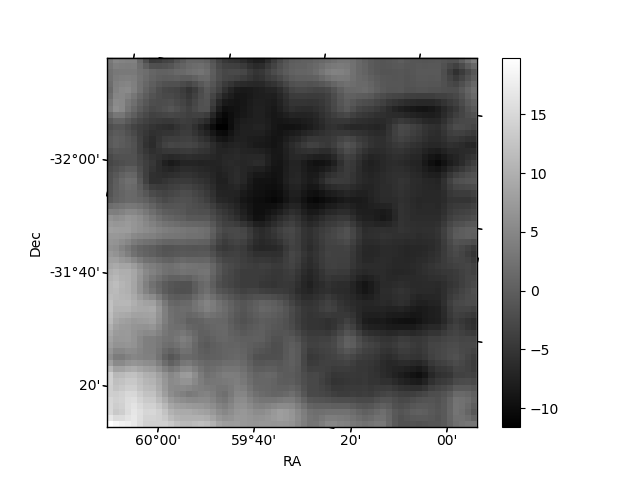
Histogram calculated using DETX and DETY for each event in the final _common_clean file
| Quadrant A | 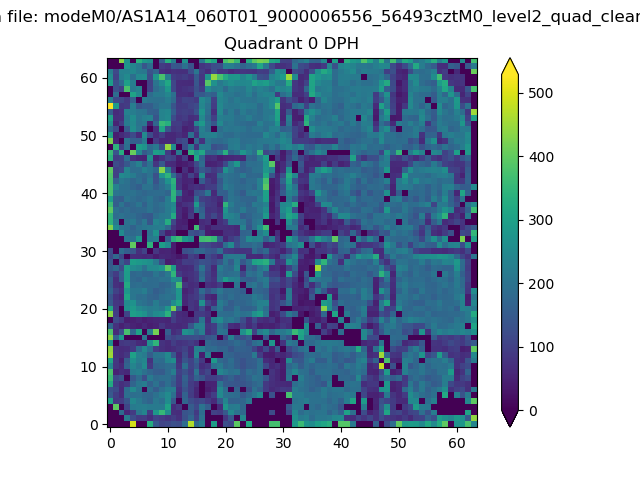 |
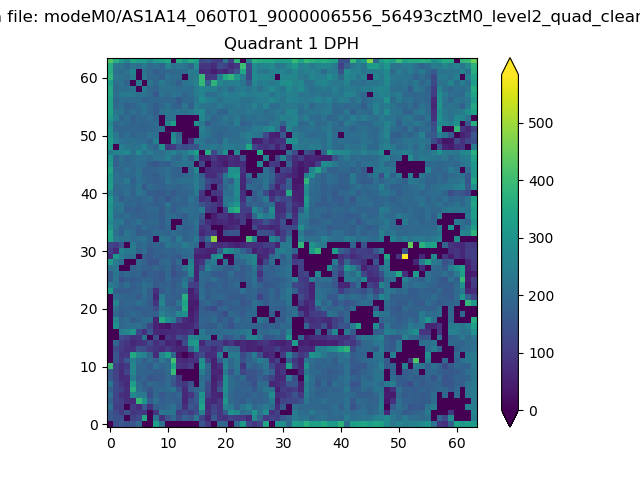 |
Quadrant B |
|---|---|---|---|
| Quadrant D |  |
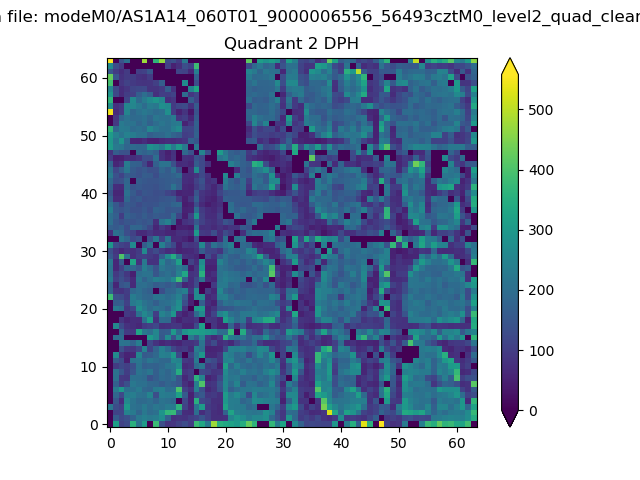 |
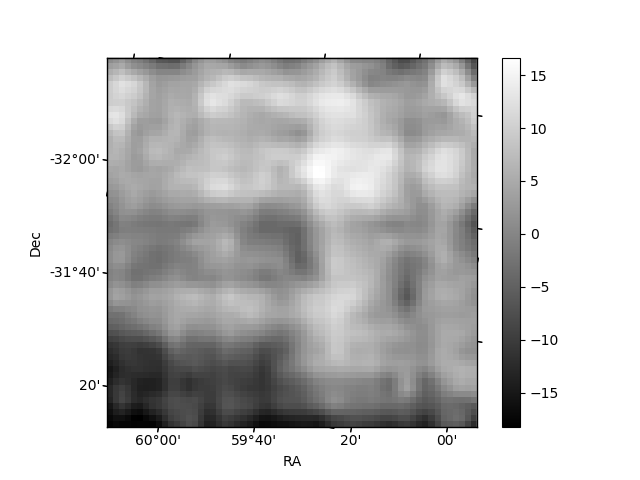
Quadrant C |
| Plot type | Count rate plots | Images |
|---|---|---|
| Comparison with Poisson distribution Blue bars denote a histogram of data divided into 1 sec bins. Red curve is a Poisson curve with rate = median count rate of data. |
 |
 |
| Quadrant-wise count rates Data is divided into 100 sec bins |
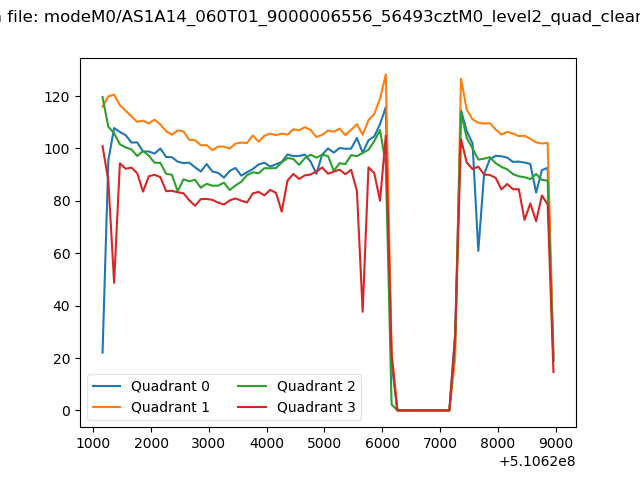 |
|
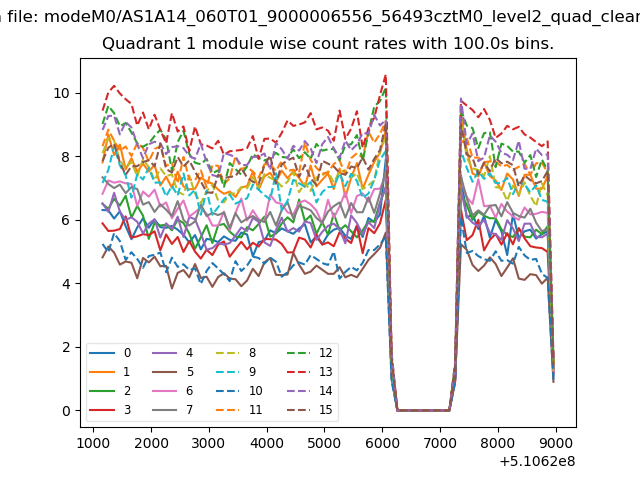
| Module-wise count rates for Quadrant A Data is divided into 100 sec bins |
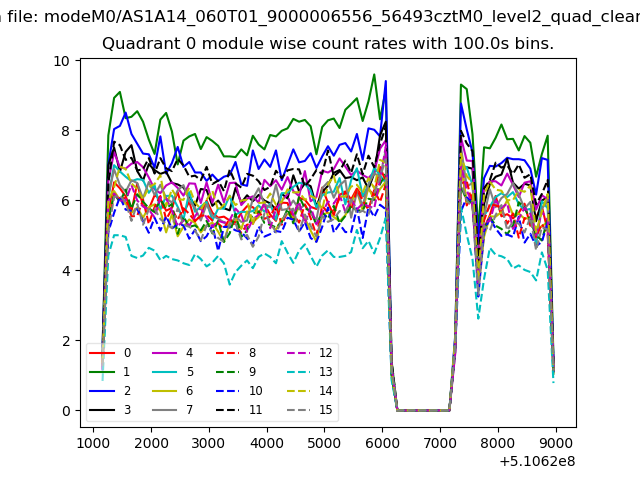 |
 |
| Module-wise count rates for Quadrant B Data is divided into 100 sec bins |
 |
 |
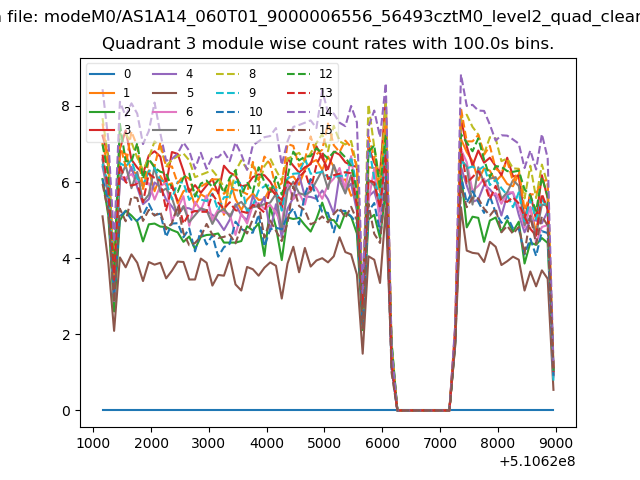
| Module-wise count rates for Quadrant C Data is divided into 100 sec bins |
 |
 |
| Module-wise count rates for Quadrant D Data is divided into 100 sec bins |
 |
 |
| Parameter | Plot |
|---|---|
| CZT HV Monitor | 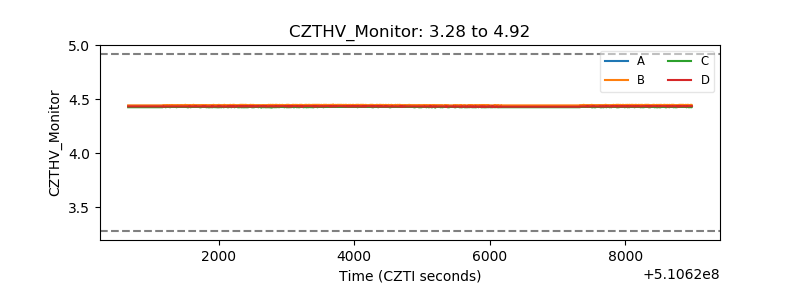 |
| D_VDD | 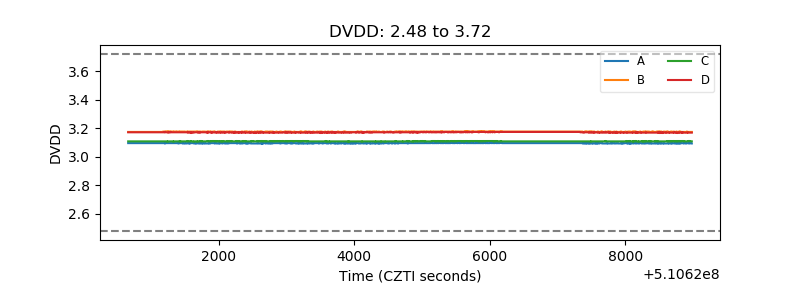 |
| Temperature 1 | 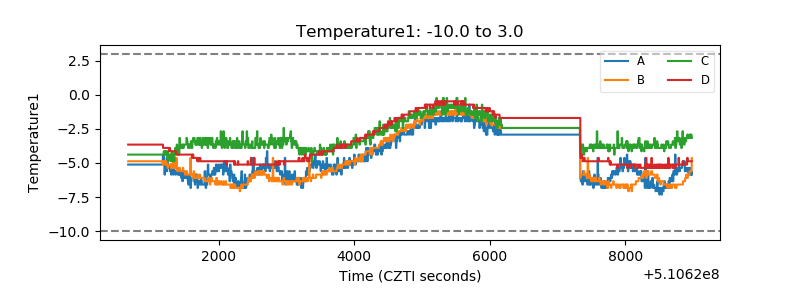 |
| Veto HV Monitor | 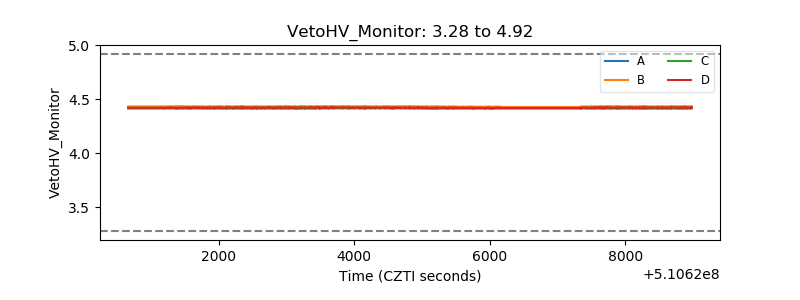 |
| Veto LLD | 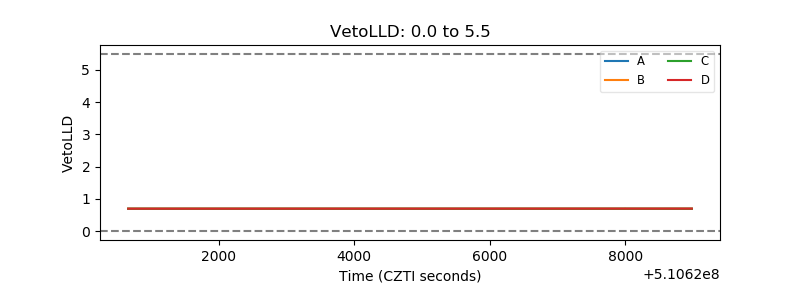 |
| Alpha Counter |  |
| _CPM_Rate |  |
| CZT Counter | 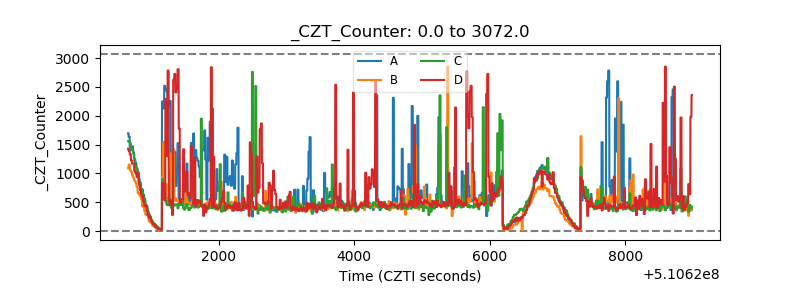 |
| +2.5 Volts monitor | 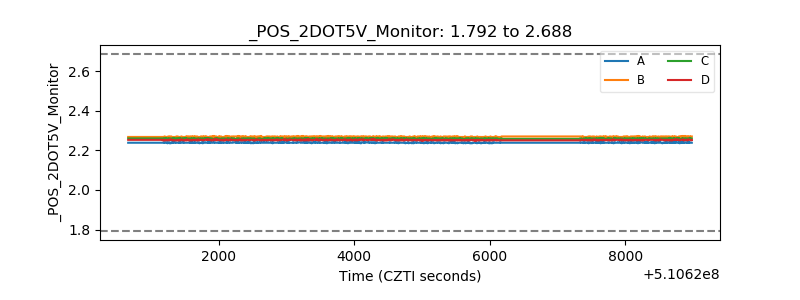 |
| +5 Volts monitor |  |
| _ROLL_ROT | 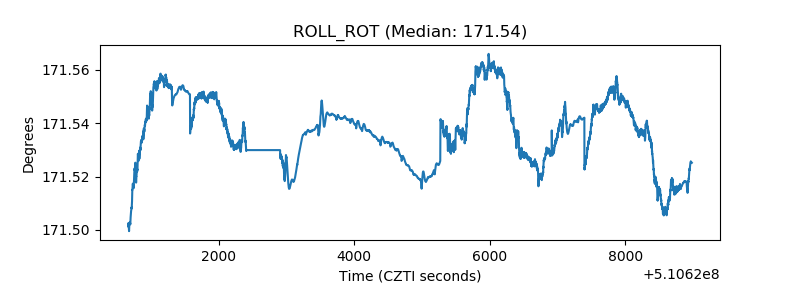 |
| _Roll_DEC | 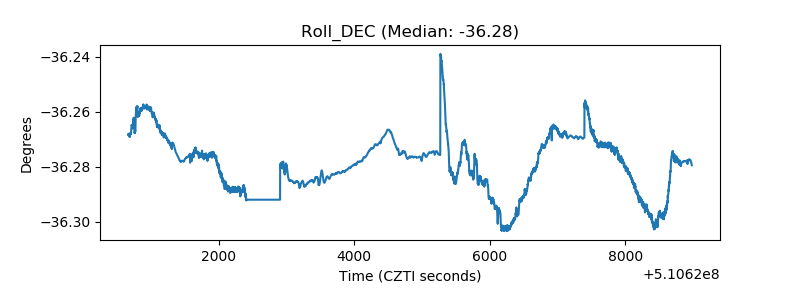 |
| _Roll_RA |  |
| Veto Counter | 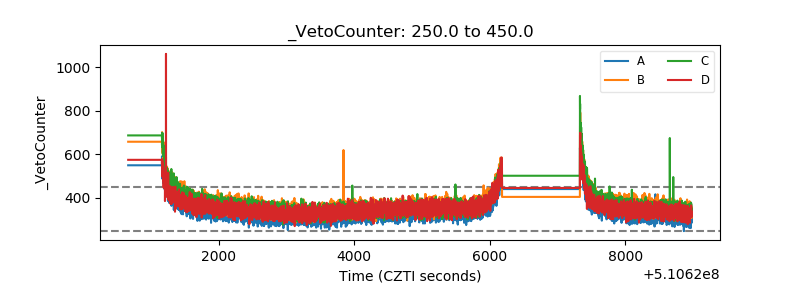 |