| Param | Original file | Final file |
|---|---|---|
| Filename | modeM0/AS1A14_060T01_9000006556_56496cztM0_level2.fits | modeM0/AS1A14_060T01_9000006556_56496cztM0_level2_quad_clean.evt |
| Size (bytes) | 701,115,840 | 110,687,040 |
| Size | 668.6 MB | 105.6 MB |
| Events in quadrant A | 10,110,655 | 566,511 |
| Events in quadrant B | 5,403,662 | 798,284 |
| Events in quadrant C | 4,350,640 | 741,174 |
| Events in quadrant D | 5,447,822 | 672,132 |
| Mode M0 | |||
|---|---|---|---|
| Quadrant | BADHDUFLAG | Total packets | Discarded packets |
| A | 0 | 35665 | 1 |
| B | 0 | 21739 | 1 |
| C | 0 | 18911 | 1 |
| D | 0 | 21741 | 1 |
| Mode M9 | |||
|---|---|---|---|
| Quadrant | BADHDUFLAG | Total packets | Discarded packets |
| A | 0 | 6 | 0 |
| B | 0 | 6 | 0 |
| C | 0 | 6 | 0 |
| D | 0 | 6 | 0 |
| Mode SS | |||
|---|---|---|---|
| Quadrant | BADHDUFLAG | Total packets | Discarded packets |
| A | 0 | 166 | 0 |
| B | 0 | 166 | 0 |
| C | 0 | 166 | 0 |
| D | 0 | 166 | 0 |
| Quadrant | Total seconds | Saturated seconds | Saturation percentage |
|---|---|---|---|
| A | 8249 | 2448 | 29.676324% |
| B | 8250 | 650 | 7.878788% |
| C | 8250 | 228 | 2.763636% |
| D | 8250 | 430 | 5.212121% |
Noise dominated data is calculated using 1-second bins in cleaned event files. If a bin has >2000 counts, and if more than 50% of those come from <1% of pixels, then it is considered to be noise-dominated and hence unusable.
| Quadrant | # 1 sec bins | Bins with >0 counts | Bins with >2000 counts | High rate bins dominated by noise | Noise dominated (total time) | Noise dominated (detector-on time) | Marked lightcurve |
|---|---|---|---|---|---|---|---|
| A | 8818 | 8248 | 1856 | 1856 | 21.05% | 22.50% |  |
| B | 8820 | 8250 | 220 | 220 | 2.49% | 2.67% |  |
| C | 8820 | 8251 | 40 | 40 | 0.45% | 0.48% | 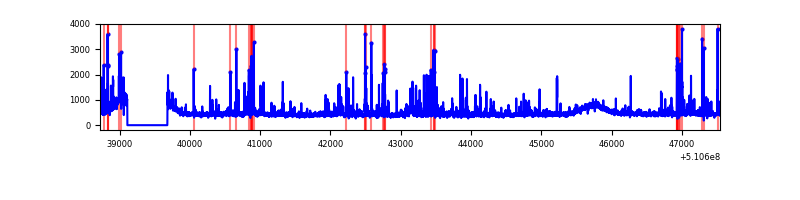 |
| D | 8820 | 8250 | 152 | 152 | 1.72% | 1.84% |  |
Top three noisy pixels from each quadrant. If the there are fewer than three noisy pixels in the level2.evt file, extra rows are filled as -1
| Pixel properties | Quadrant properties | ||||||
|---|---|---|---|---|---|---|---|
| Quadrant | DetID | PixID | Counts | Sigma | Mean | Median | Sigma |
| A | 12 | 3 | 3351718 | 16538.01 | 819 | 795 | 202.6 |
| A | 3 | 62 | 1893223 | 9339.81 | 819 | 795 | 202.6 |
| A | 7 | 64 | 626508 | 3088.12 | 819 | 795 | 202.6 |
| B | 4 | 206 | 1326313 | 6640.83 | 924 | 891 | 199.6 |
| B | 0 | 213 | 116967 | 581.58 | 924 | 891 | 199.6 |
| B | 4 | 171 | 96369 | 478.38 | 924 | 891 | 199.6 |
| C | 12 | 252 | 212877 | 834.4 | 932 | 925 | 254.0 |
| C | 13 | 3 | 186433 | 730.3 | 932 | 925 | 254.0 |
| C | 6 | 223 | 140010 | 547.54 | 932 | 925 | 254.0 |
| D | 2 | 249 | 545135 | 2129.02 | 914 | 876 | 255.6 |
| D | 11 | 176 | 396675 | 1548.28 | 914 | 876 | 255.6 |
| D | 8 | 160 | 318256 | 1241.52 | 914 | 876 | 255.6 |
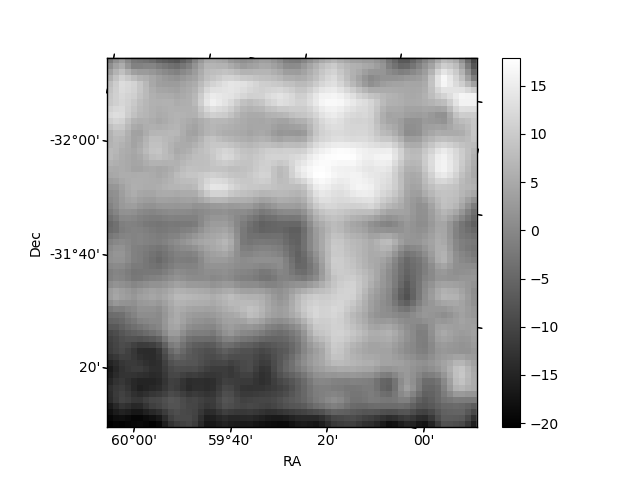
Histogram calculated using DETX and DETY for each event in the final _common_clean file
| Quadrant A | 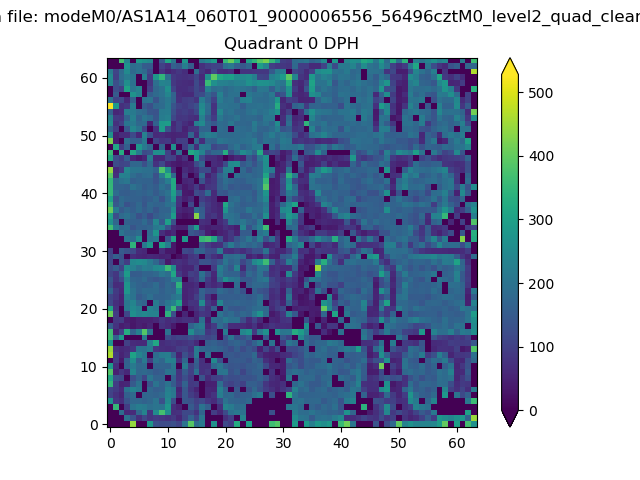 |
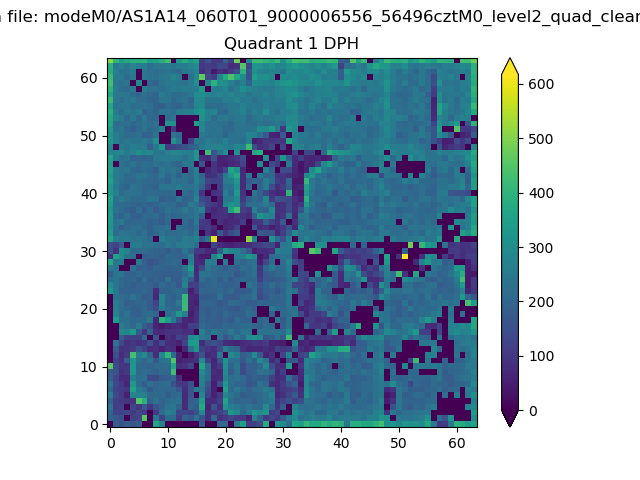 |
Quadrant B |
|---|---|---|---|
| Quadrant D |  |
 |
Quadrant C |
| Plot type | Count rate plots | Images |
|---|---|---|
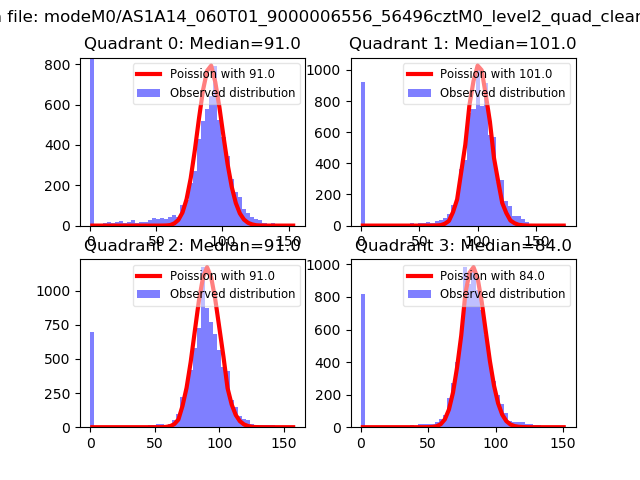
| Comparison with Poisson distribution Blue bars denote a histogram of data divided into 1 sec bins. Red curve is a Poisson curve with rate = median count rate of data. |
 |
 |
| Quadrant-wise count rates Data is divided into 100 sec bins |
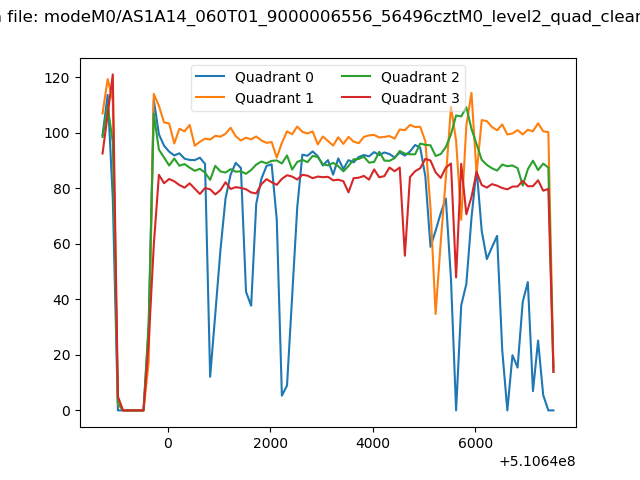 |
|
| Module-wise count rates for Quadrant A Data is divided into 100 sec bins |
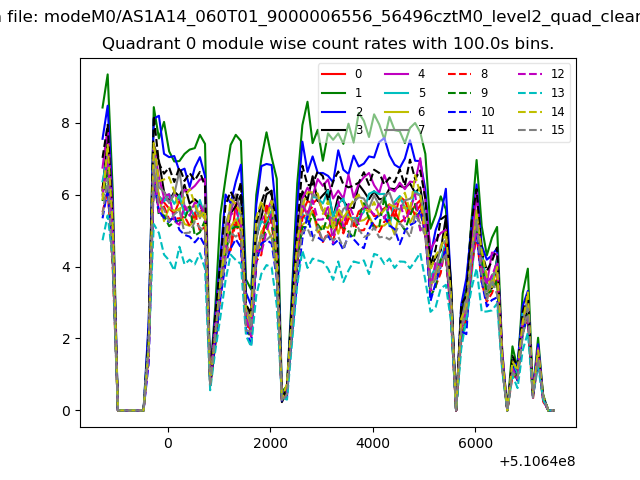 |
 |
| Module-wise count rates for Quadrant B Data is divided into 100 sec bins |
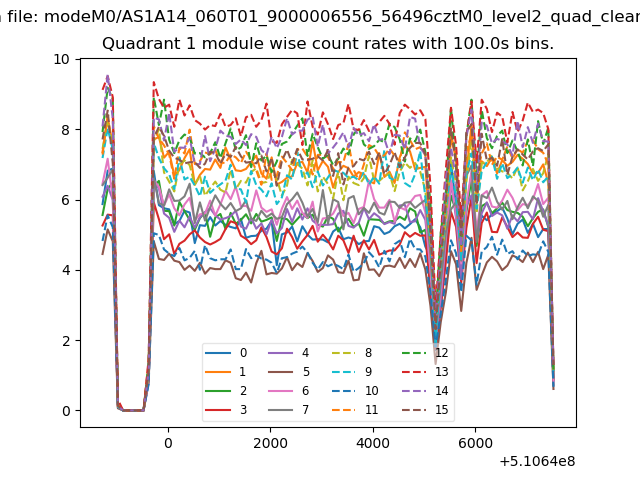 |
 |
| Module-wise count rates for Quadrant C Data is divided into 100 sec bins |
 |
 |
| Module-wise count rates for Quadrant D Data is divided into 100 sec bins |
 |
 |
| Parameter | Plot |
|---|---|
| CZT HV Monitor |  |
| D_VDD |  |
| Temperature 1 |  |
| Veto HV Monitor | 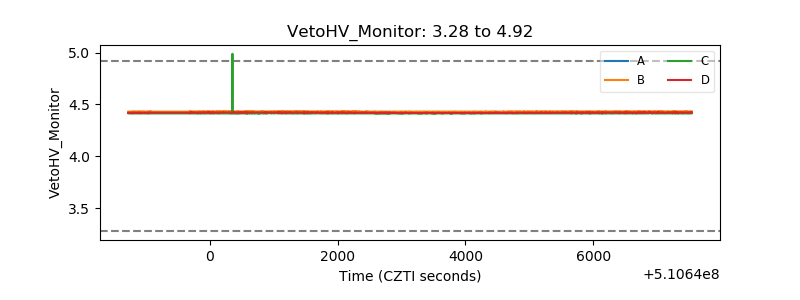 |
| Veto LLD | 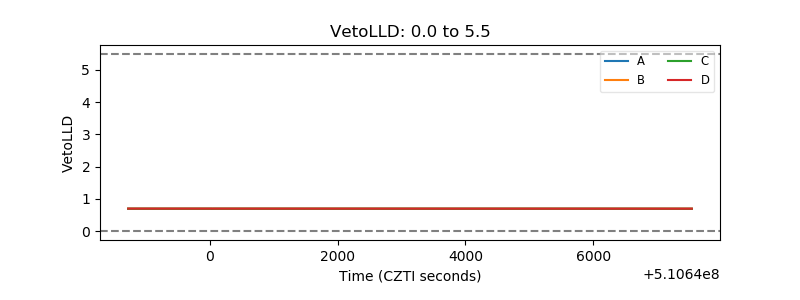 |
| Alpha Counter |  |
| _CPM_Rate | 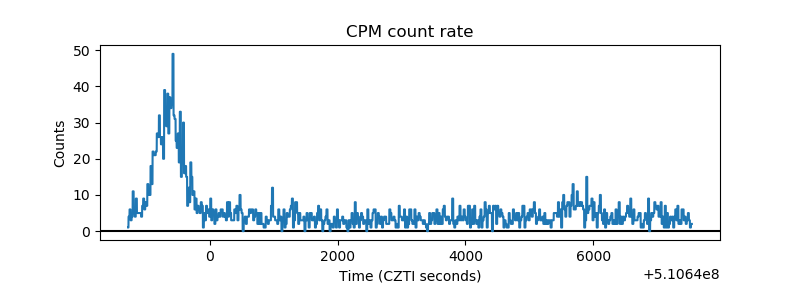 |
| CZT Counter | 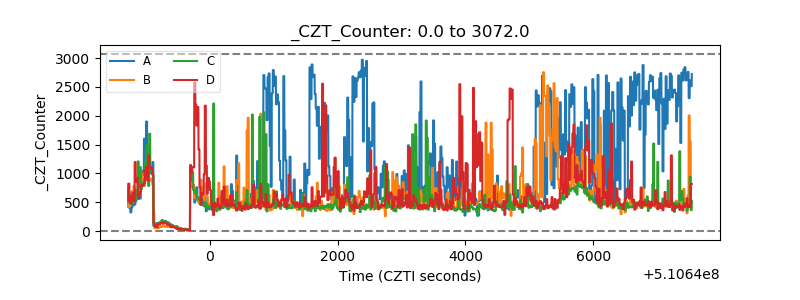 |
| +2.5 Volts monitor |  |
| +5 Volts monitor |  |
| _ROLL_ROT | 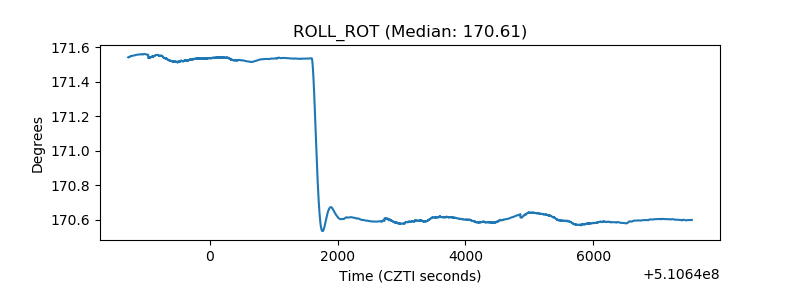 |
| _Roll_DEC | 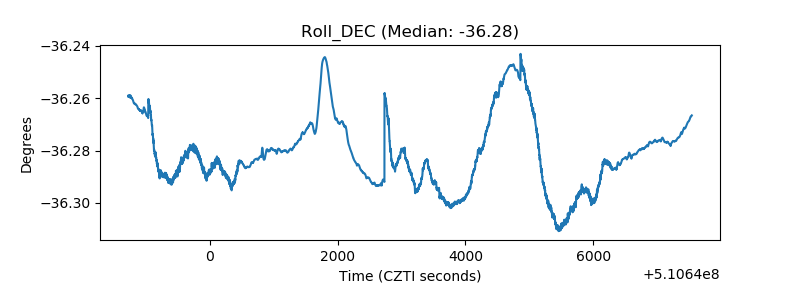 |
| _Roll_RA |  |
| Veto Counter | 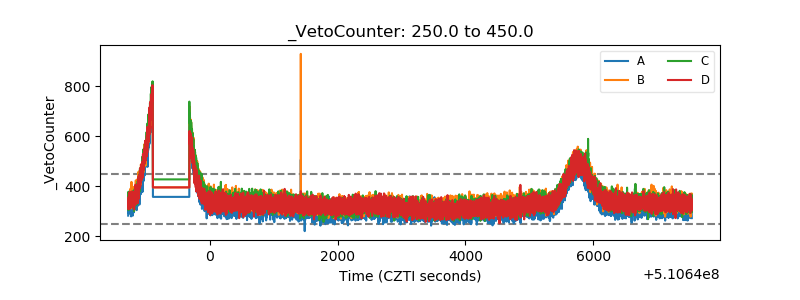 |