| Param | Original file | Final file |
|---|---|---|
| Filename | modeM0/AS1A14_060T01_9000006556_56498cztM0_level2.fits | modeM0/AS1A14_060T01_9000006556_56498cztM0_level2_quad_clean.evt |
| Size (bytes) | 492,886,080 | 114,408,000 |
| Size | 470.1 MB | 109.1 MB |
| Events in quadrant A | 4,768,071 | 738,850 |
| Events in quadrant B | 4,568,895 | 795,849 |
| Events in quadrant C | 4,111,506 | 710,535 |
| Events in quadrant D | 4,181,763 | 668,753 |
| Mode M0 | |||
|---|---|---|---|
| Quadrant | BADHDUFLAG | Total packets | Discarded packets |
| A | 0 | 19323 | 0 |
| B | 0 | 19009 | 0 |
| C | 0 | 17930 | 0 |
| D | 0 | 17818 | 0 |
| Mode SS | |||
|---|---|---|---|
| Quadrant | BADHDUFLAG | Total packets | Discarded packets |
| A | 0 | 158 | 0 |
| B | 0 | 158 | 0 |
| C | 0 | 158 | 0 |
| D | 0 | 158 | 0 |
| Quadrant | Total seconds | Saturated seconds | Saturation percentage |
|---|---|---|---|
| A | 7916 | 41 | 0.517938% |
| B | 7915 | 193 | 2.438408% |
| C | 7916 | 134 | 1.692774% |
| D | 7916 | 40 | 0.505306% |
Noise dominated data is calculated using 1-second bins in cleaned event files. If a bin has >2000 counts, and if more than 50% of those come from <1% of pixels, then it is considered to be noise-dominated and hence unusable.
| Quadrant | # 1 sec bins | Bins with >0 counts | Bins with >2000 counts | High rate bins dominated by noise | Noise dominated (total time) | Noise dominated (detector-on time) | Marked lightcurve |
|---|---|---|---|---|---|---|---|
| A | 7916 | 7916 | 39 | 39 | 0.49% | 0.49% |  |
| B | 7915 | 7915 | 111 | 111 | 1.40% | 1.40% |  |
| C | 7916 | 7916 | 91 | 91 | 1.15% | 1.15% |  |
| D | 7916 | 7916 | 38 | 38 | 0.48% | 0.48% |  |
Top three noisy pixels from each quadrant. If the there are fewer than three noisy pixels in the level2.evt file, extra rows are filled as -1
| Pixel properties | Quadrant properties | ||||||
|---|---|---|---|---|---|---|---|
| Quadrant | DetID | PixID | Counts | Sigma | Mean | Median | Sigma |
| A | 3 | 14 | 877385 | 4073.14 | 866 | 843 | 215.2 |
| A | 0 | 8 | 129273 | 596.79 | 866 | 843 | 215.2 |
| A | 8 | 249 | 103052 | 474.95 | 866 | 843 | 215.2 |
| B | 4 | 206 | 768645 | 4167.05 | 855 | 820 | 184.3 |
| B | 0 | 213 | 67703 | 362.98 | 855 | 820 | 184.3 |
| B | 10 | 247 | 65514 | 351.1 | 855 | 820 | 184.3 |
| C | 15 | 230 | 270278 | 1169.68 | 841 | 832 | 230.4 |
| C | 6 | 223 | 189721 | 819.98 | 841 | 832 | 230.4 |
| C | 12 | 252 | 106834 | 460.16 | 841 | 832 | 230.4 |
| D | 2 | 249 | 339104 | 1424.73 | 841 | 803 | 237.4 |
| D | 3 | 12 | 154799 | 648.54 | 841 | 803 | 237.4 |
| D | 5 | 173 | 86950 | 362.8 | 841 | 803 | 237.4 |
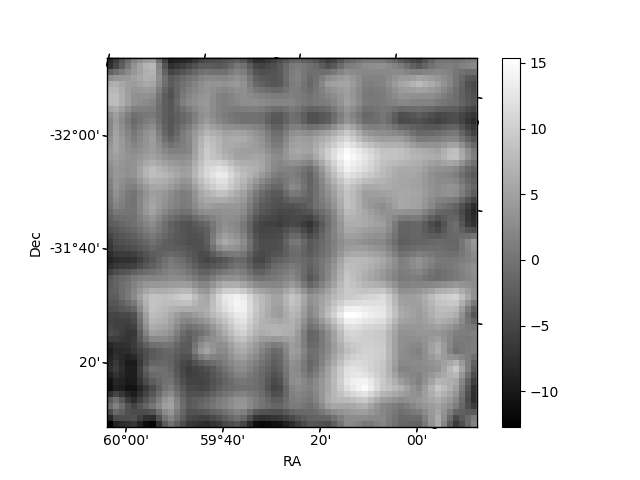
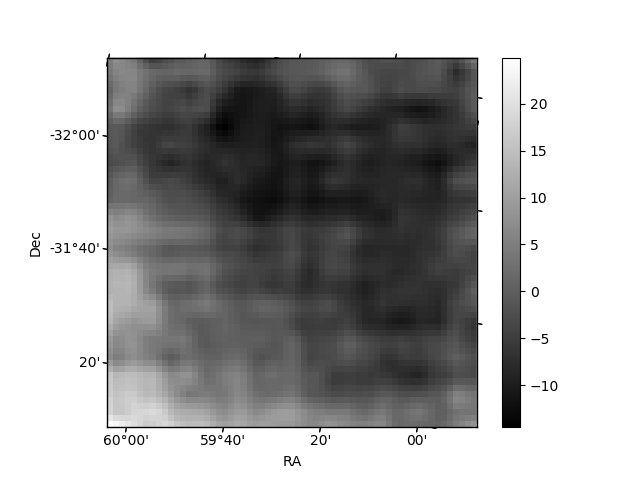
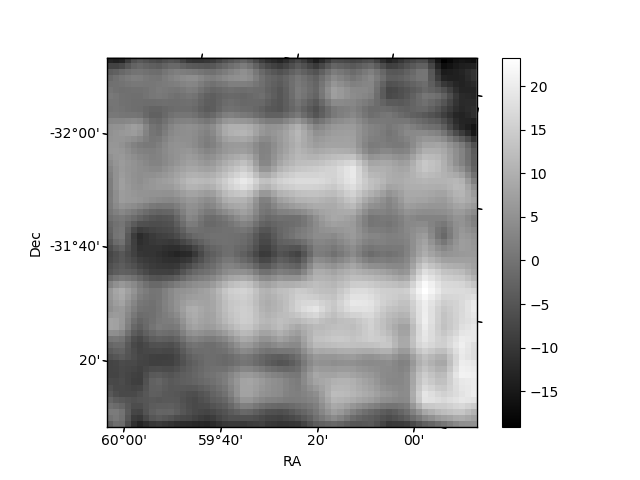
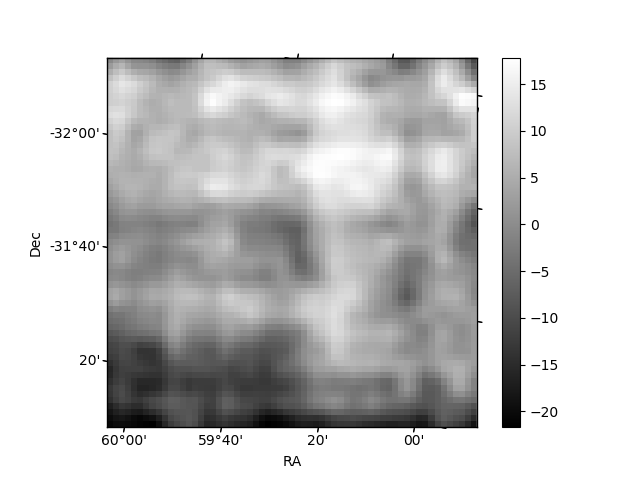
Histogram calculated using DETX and DETY for each event in the final _common_clean file
| Quadrant A | 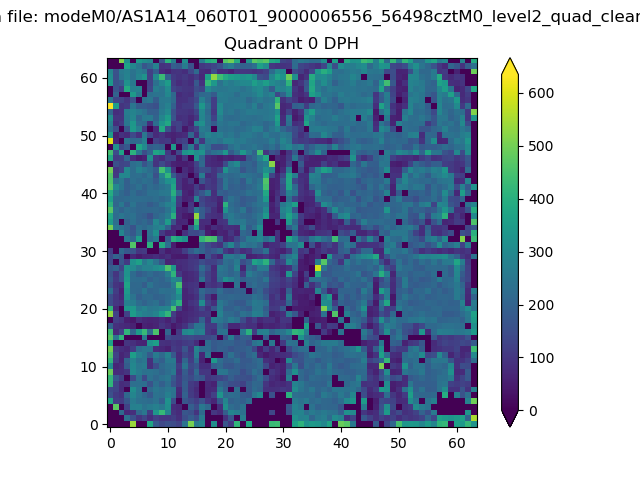 |
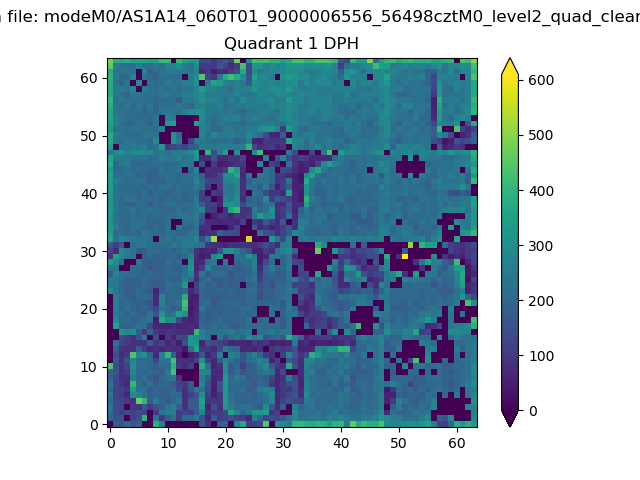 |
Quadrant B |
|---|---|---|---|
| Quadrant D | 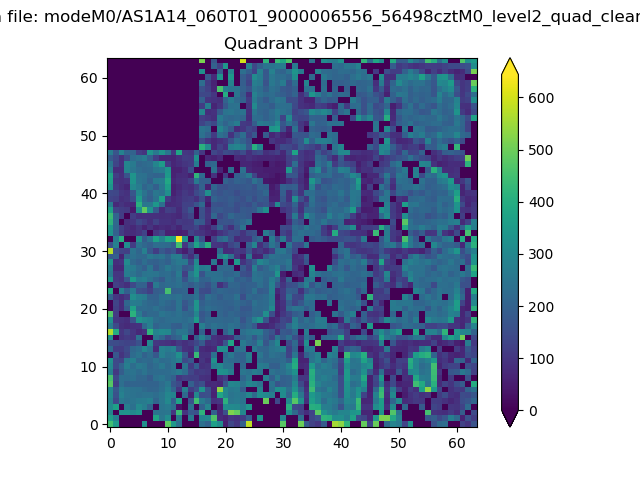 |
 |
Quadrant C |
| Plot type | Count rate plots | Images |
|---|---|---|
| Comparison with Poisson distribution Blue bars denote a histogram of data divided into 1 sec bins. Red curve is a Poisson curve with rate = median count rate of data. |
 |
 |
| Quadrant-wise count rates Data is divided into 100 sec bins |
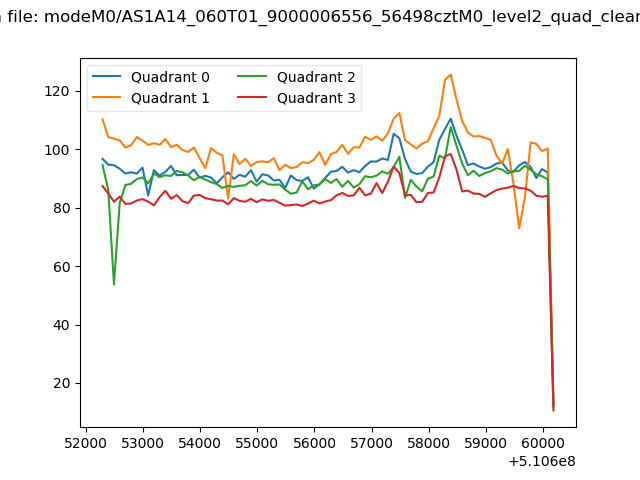 |
|
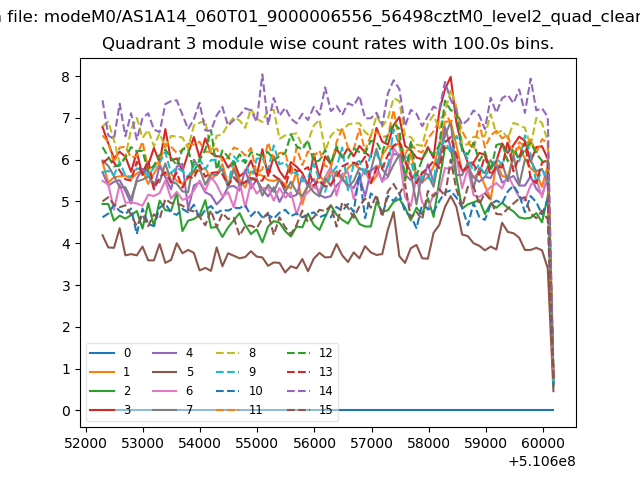
| Module-wise count rates for Quadrant A Data is divided into 100 sec bins |
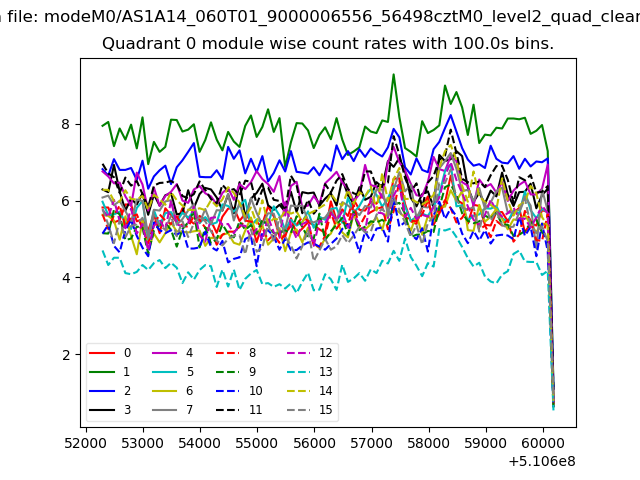 |
 |
| Module-wise count rates for Quadrant B Data is divided into 100 sec bins |
 |
 |
| Module-wise count rates for Quadrant C Data is divided into 100 sec bins |
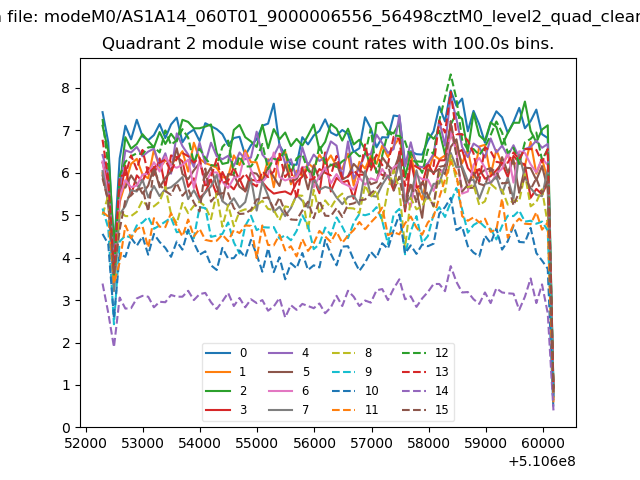 |
 |
| Module-wise count rates for Quadrant D Data is divided into 100 sec bins |
 |
 |
| Parameter | Plot |
|---|---|
| CZT HV Monitor | 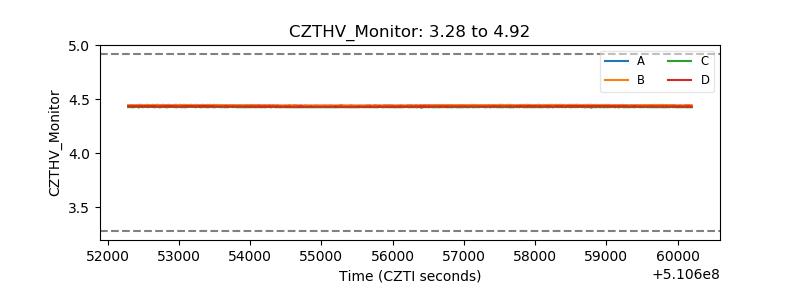 |
| D_VDD |  |
| Temperature 1 | 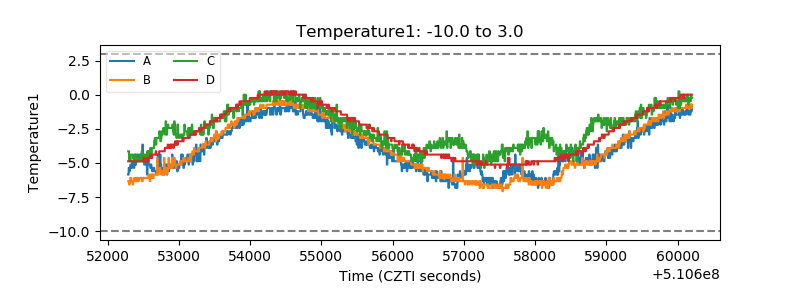 |
| Veto HV Monitor | 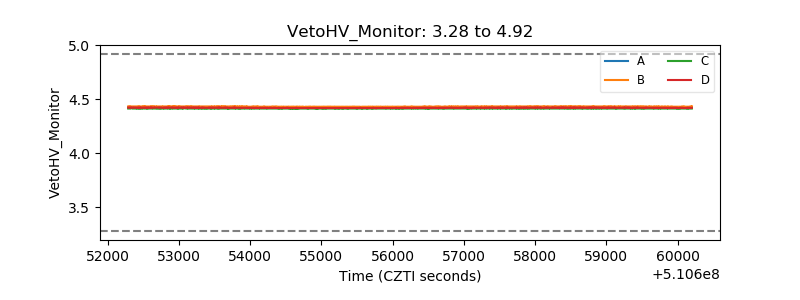 |
| Veto LLD |  |
| Alpha Counter |  |
| _CPM_Rate |  |
| CZT Counter | 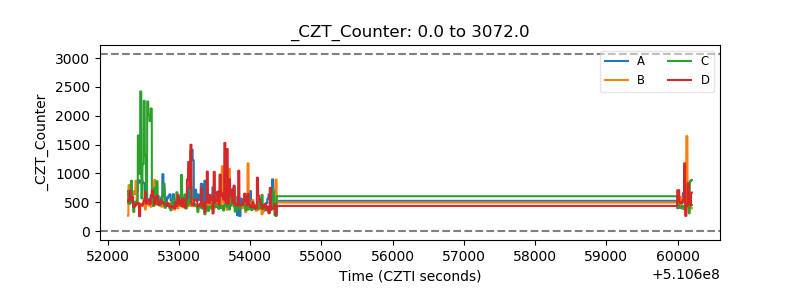 |
| +2.5 Volts monitor | 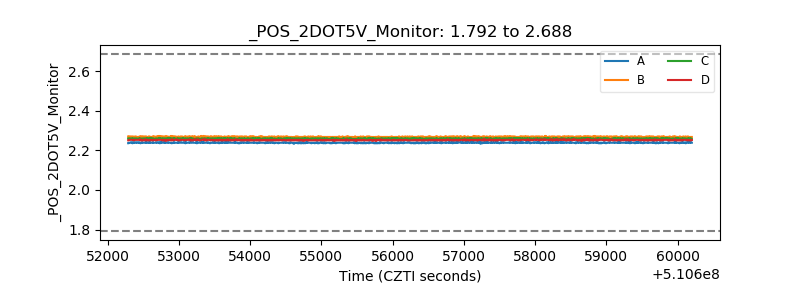 |
| +5 Volts monitor |  |
| _ROLL_ROT | 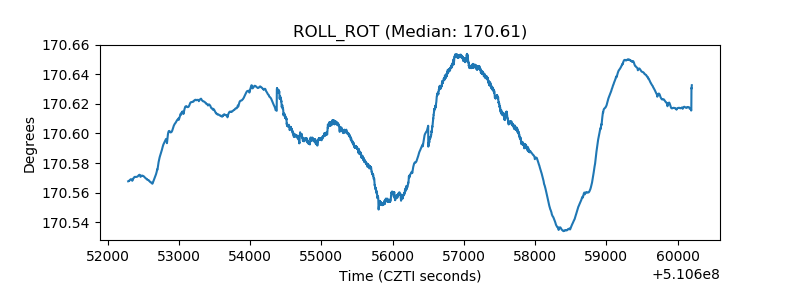 |
| _Roll_DEC | 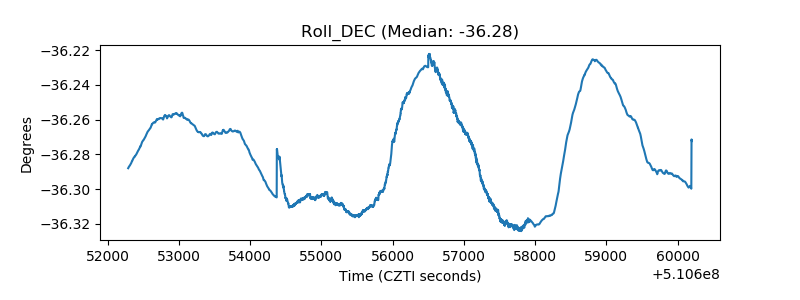 |
| _Roll_RA |  |
| Veto Counter | 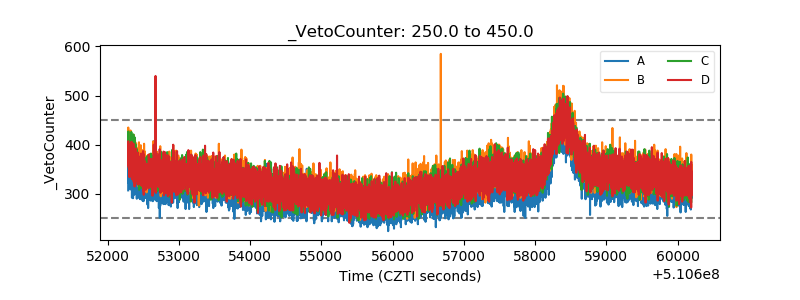 |