| Param | Original file | Final file |
|---|---|---|
| Filename | modeM0/AS1A14_060T01_9000006556_56501cztM0_level2.fits | modeM0/AS1A14_060T01_9000006556_56501cztM0_level2_quad_clean.evt |
| Size (bytes) | 1,382,448,960 | 257,846,400 |
| Size | 1.3 GB | 245.9 MB |
| Events in quadrant A | 14,069,602 | 1,655,692 |
| Events in quadrant B | 11,403,116 | 1,784,866 |
| Events in quadrant C | 10,010,825 | 1,628,432 |
| Events in quadrant D | 14,253,112 | 1,456,745 |
| Mode M0 | |||
|---|---|---|---|
| Quadrant | BADHDUFLAG | Total packets | Discarded packets |
| A | 0 | 54691 | 3 |
| B | 0 | 46726 | 3 |
| C | 0 | 43318 | 3 |
| D | 0 | 55104 | 3 |
| Mode M9 | |||
|---|---|---|---|
| Quadrant | BADHDUFLAG | Total packets | Discarded packets |
| A | 0 | 12 | 0 |
| B | 0 | 12 | 0 |
| C | 0 | 12 | 0 |
| D | 0 | 12 | 0 |
| Mode SS | |||
|---|---|---|---|
| Quadrant | BADHDUFLAG | Total packets | Discarded packets |
| A | 0 | 374 | 0 |
| B | 0 | 374 | 0 |
| C | 0 | 374 | 0 |
| D | 0 | 374 | 0 |
| Quadrant | Total seconds | Saturated seconds | Saturation percentage |
|---|---|---|---|
| A | 18588 | 1054 | 5.670325% |
| B | 18588 | 983 | 5.288358% |
| C | 18588 | 528 | 2.840542% |
| D | 18589 | 1380 | 7.423745% |
Noise dominated data is calculated using 1-second bins in cleaned event files. If a bin has >2000 counts, and if more than 50% of those come from <1% of pixels, then it is considered to be noise-dominated and hence unusable.
| Quadrant | # 1 sec bins | Bins with >0 counts | Bins with >2000 counts | High rate bins dominated by noise | Noise dominated (total time) | Noise dominated (detector-on time) | Marked lightcurve |
|---|---|---|---|---|---|---|---|
| A | 19763 | 18590 | 607 | 607 | 3.07% | 3.27% |  |
| B | 19763 | 18591 | 479 | 479 | 2.42% | 2.58% | 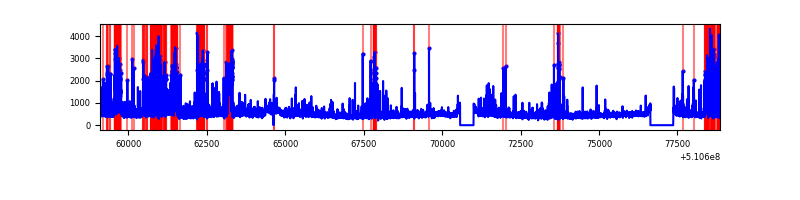 |
| C | 19763 | 18591 | 357 | 357 | 1.81% | 1.92% | 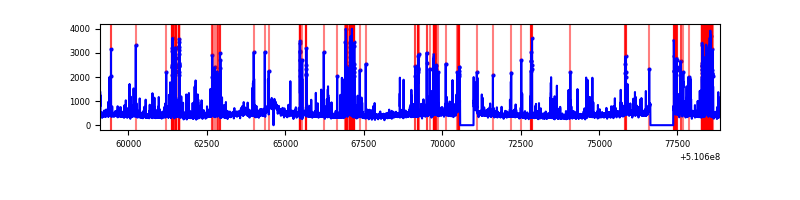 |
| D | 19764 | 18591 | 1128 | 1128 | 5.71% | 6.07% |  |
Top three noisy pixels from each quadrant. If the there are fewer than three noisy pixels in the level2.evt file, extra rows are filled as -1
| Pixel properties | Quadrant properties | ||||||
|---|---|---|---|---|---|---|---|
| Quadrant | DetID | PixID | Counts | Sigma | Mean | Median | Sigma |
| A | 3 | 14 | 1973605 | 3942.94 | 2018 | 1962 | 500.0 |
| A | 4 | 159 | 1944551 | 3884.83 | 2018 | 1962 | 500.0 |
| A | 7 | 64 | 1442065 | 2879.95 | 2018 | 1962 | 500.0 |
| B | 4 | 206 | 1374802 | 3171.42 | 2004 | 1929 | 432.9 |
| B | 4 | 171 | 696997 | 1605.65 | 2004 | 1929 | 432.9 |
| B | 0 | 213 | 694608 | 1600.13 | 2004 | 1929 | 432.9 |
| C | 12 | 252 | 1133089 | 2100.71 | 1967 | 1952 | 538.5 |
| C | 13 | 3 | 654728 | 1212.31 | 1967 | 1952 | 538.5 |
| C | 15 | 230 | 176327 | 323.84 | 1967 | 1952 | 538.5 |
| D | 2 | 249 | 3398303 | 6266.8 | 1927 | 1842 | 542.0 |
| D | 3 | 12 | 1568377 | 2890.41 | 1927 | 1842 | 542.0 |
| D | 5 | 113 | 448967 | 824.99 | 1927 | 1842 | 542.0 |
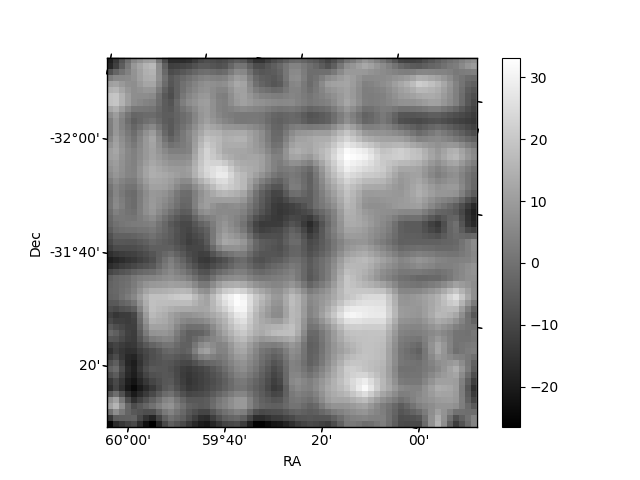
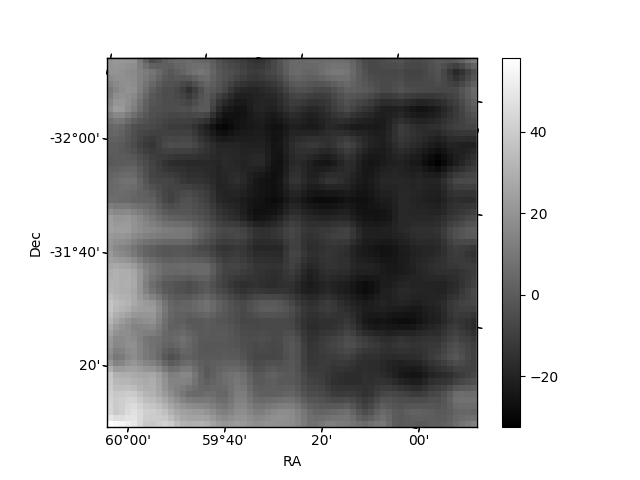
Histogram calculated using DETX and DETY for each event in the final _common_clean file
| Quadrant A | 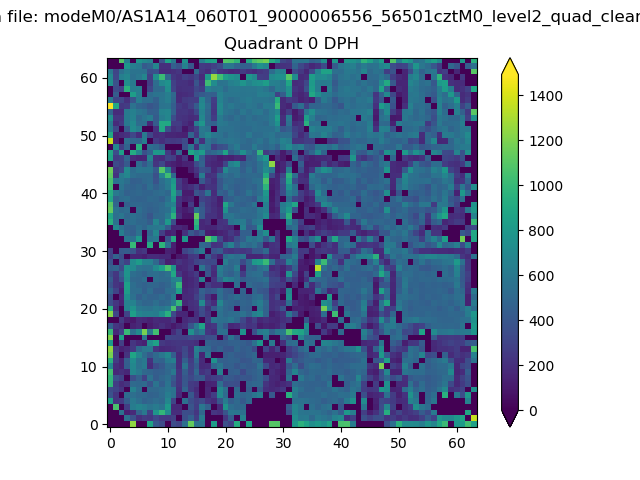 |
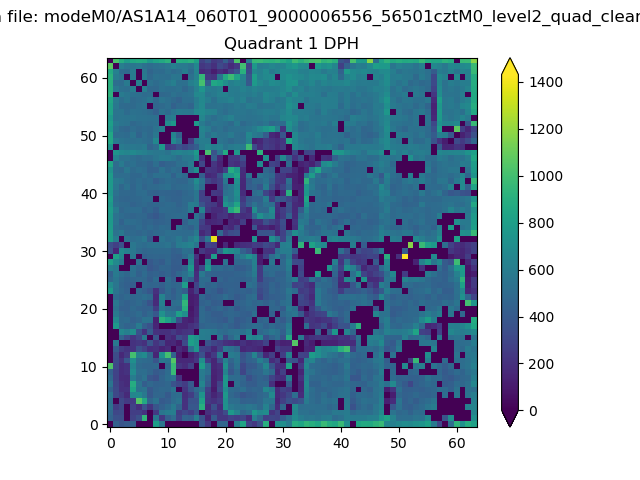 |
Quadrant B |
|---|---|---|---|
| Quadrant D | 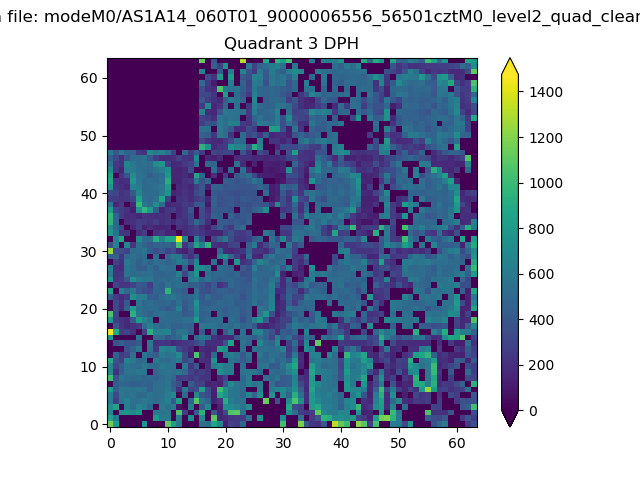 |
 |
Quadrant C |
| Plot type | Count rate plots | Images |
|---|---|---|
| Comparison with Poisson distribution Blue bars denote a histogram of data divided into 1 sec bins. Red curve is a Poisson curve with rate = median count rate of data. |
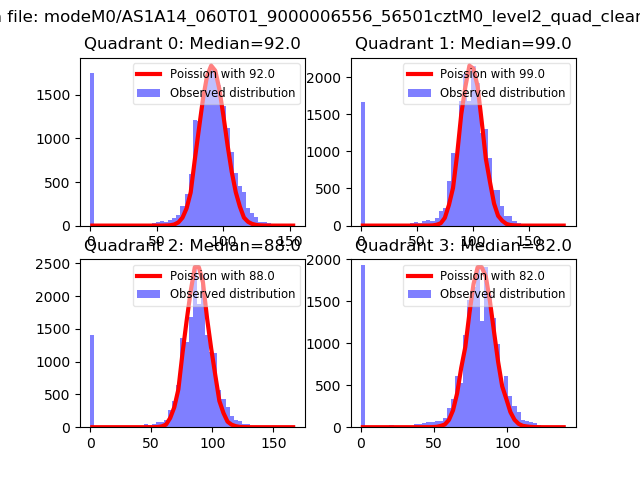 |
 |
| Quadrant-wise count rates Data is divided into 100 sec bins |
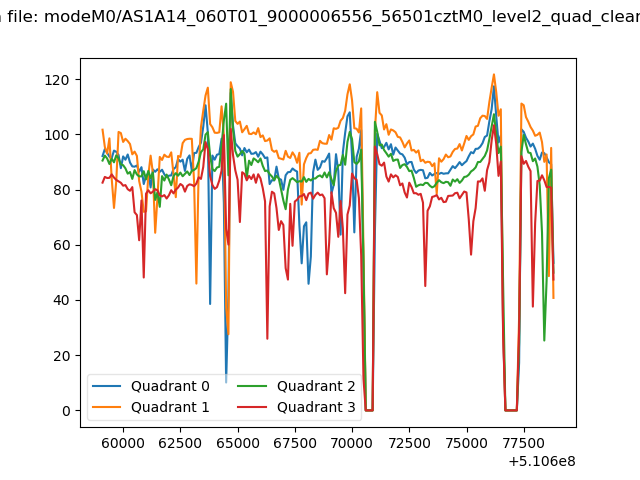 |
|
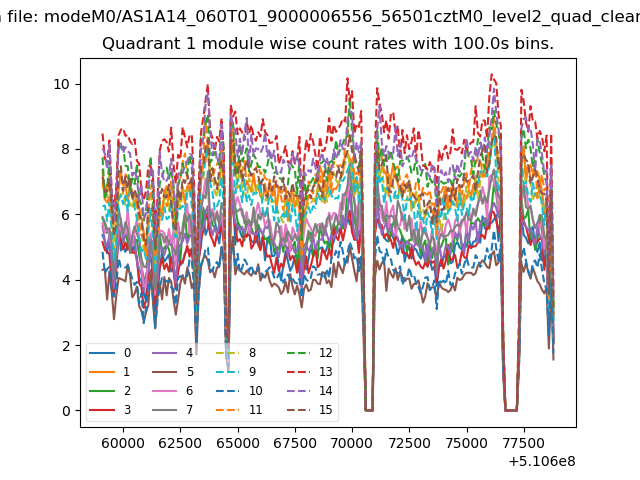
| Module-wise count rates for Quadrant A Data is divided into 100 sec bins |
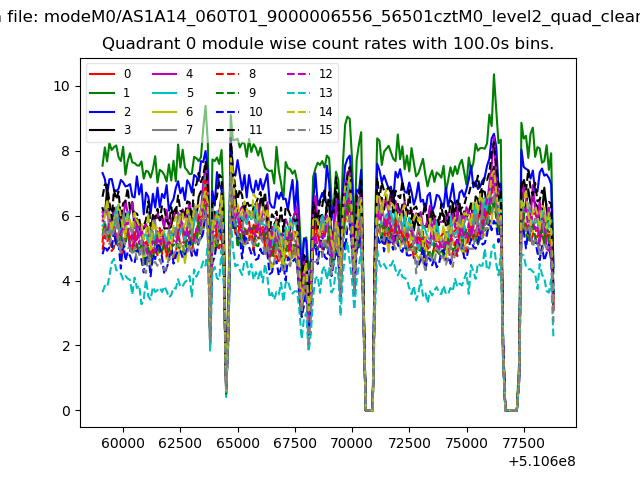 |
 |
| Module-wise count rates for Quadrant B Data is divided into 100 sec bins |
 |
 |
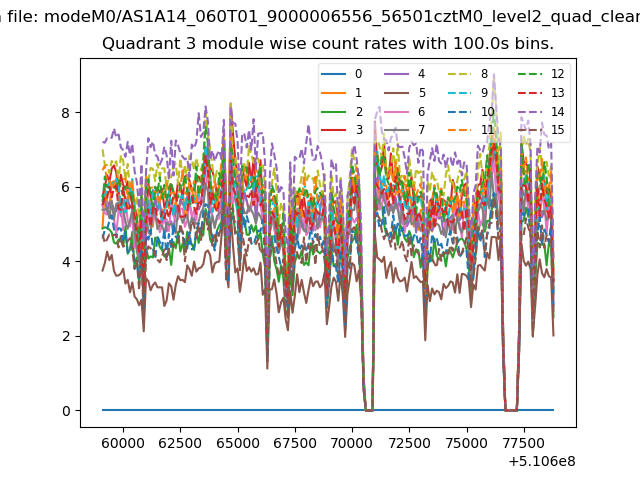
| Module-wise count rates for Quadrant C Data is divided into 100 sec bins |
 |
 |
| Module-wise count rates for Quadrant D Data is divided into 100 sec bins |
 |
 |
| Parameter | Plot |
|---|---|
| CZT HV Monitor |  |
| D_VDD | 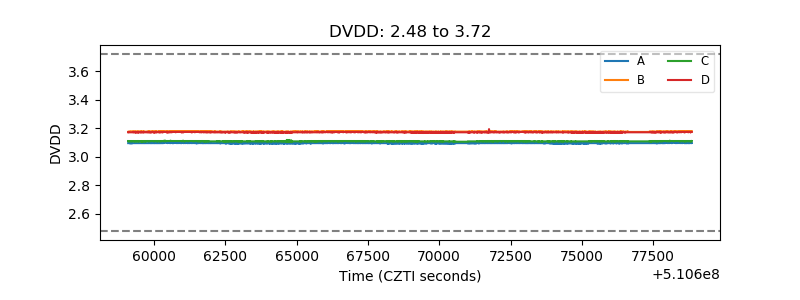 |
| Temperature 1 | 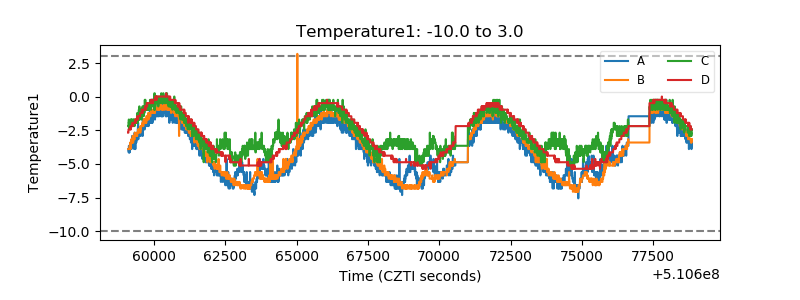 |
| Veto HV Monitor | 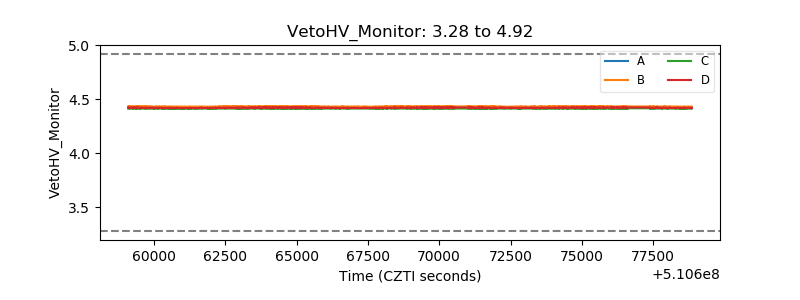 |
| Veto LLD | 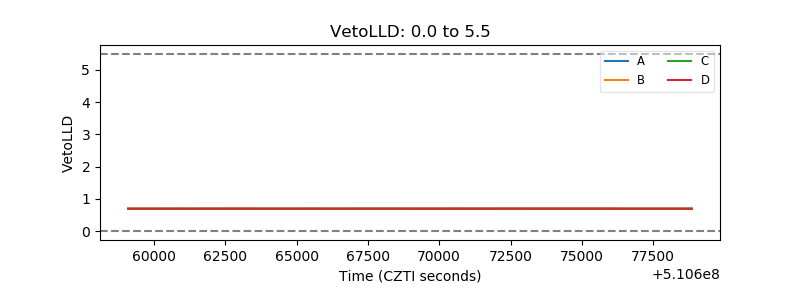 |
| Alpha Counter |  |
| _CPM_Rate | 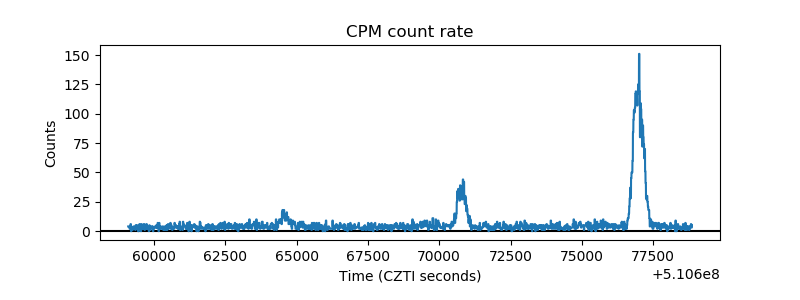 |
| CZT Counter | 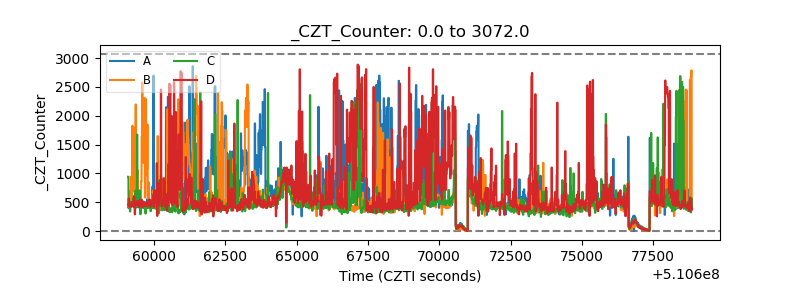 |
| +2.5 Volts monitor |  |
| +5 Volts monitor |  |
| _ROLL_ROT | 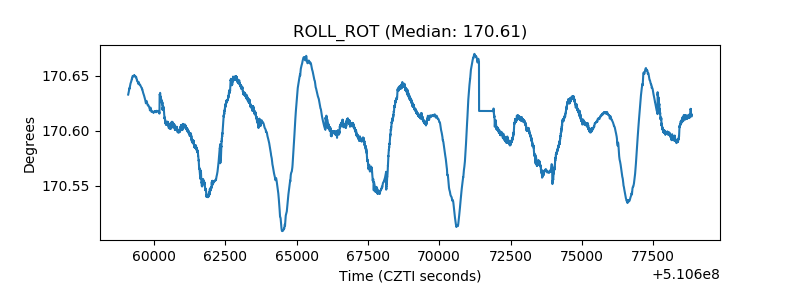 |
| _Roll_DEC | 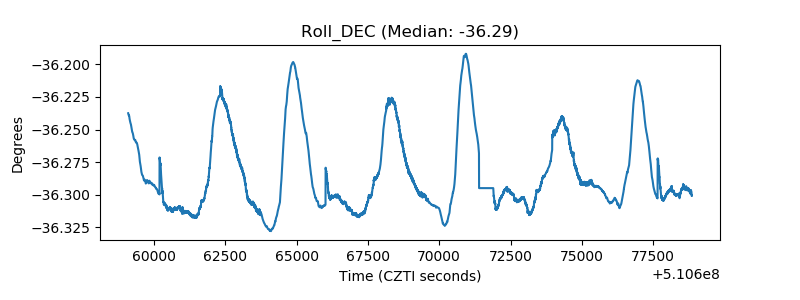 |
| _Roll_RA |  |
| Veto Counter | 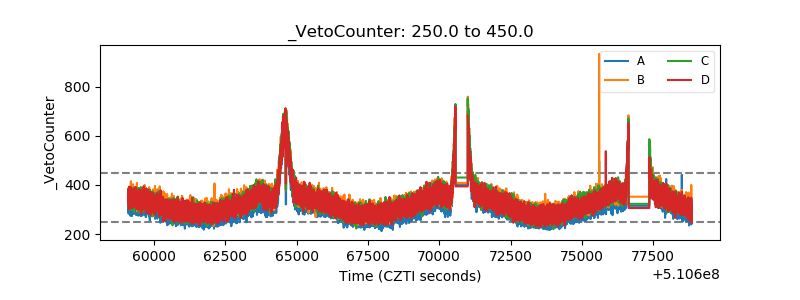 |