| Param | Original file | Final file |
|---|---|---|
| Filename | modeM0/AS1A14_060T01_9000006556_56504cztM0_level2.fits | modeM0/AS1A14_060T01_9000006556_56504cztM0_level2_quad_clean.evt |
| Size (bytes) | 421,410,240 | 97,012,800 |
| Size | 401.9 MB | 92.5 MB |
| Events in quadrant A | 3,674,746 | 636,160 |
| Events in quadrant B | 3,567,165 | 678,296 |
| Events in quadrant C | 3,754,991 | 596,689 |
| Events in quadrant D | 4,086,599 | 563,887 |
| Mode M0 | |||
|---|---|---|---|
| Quadrant | BADHDUFLAG | Total packets | Discarded packets |
| A | 0 | 15545 | 2 |
| B | 0 | 15229 | 2 |
| C | 0 | 16055 | 2 |
| D | 0 | 16793 | 4 |
| Mode M9 | |||
|---|---|---|---|
| Quadrant | BADHDUFLAG | Total packets | Discarded packets |
| A | 0 | 11 | 0 |
| B | 0 | 11 | 0 |
| C | 0 | 11 | 0 |
| D | 0 | 11 | 0 |
| Mode SS | |||
|---|---|---|---|
| Quadrant | BADHDUFLAG | Total packets | Discarded packets |
| A | 0 | 134 | 0 |
| B | 0 | 134 | 0 |
| C | 0 | 134 | 0 |
| D | 0 | 134 | 0 |
| Quadrant | Total seconds | Saturated seconds | Saturation percentage |
|---|---|---|---|
| A | 6630 | 37 | 0.558069% |
| B | 6630 | 159 | 2.398190% |
| C | 6631 | 219 | 3.302669% |
| D | 6630 | 153 | 2.307692% |
Noise dominated data is calculated using 1-second bins in cleaned event files. If a bin has >2000 counts, and if more than 50% of those come from <1% of pixels, then it is considered to be noise-dominated and hence unusable.
| Quadrant | # 1 sec bins | Bins with >0 counts | Bins with >2000 counts | High rate bins dominated by noise | Noise dominated (total time) | Noise dominated (detector-on time) | Marked lightcurve |
|---|---|---|---|---|---|---|---|
| A | 7680 | 6631 | 34 | 34 | 0.44% | 0.51% |  |
| B | 7680 | 6631 | 80 | 80 | 1.04% | 1.21% |  |
| C | 7681 | 6632 | 191 | 191 | 2.49% | 2.88% |  |
| D | 7680 | 6631 | 151 | 151 | 1.97% | 2.28% |  |
Top three noisy pixels from each quadrant. If the there are fewer than three noisy pixels in the level2.evt file, extra rows are filled as -1
| Pixel properties | Quadrant properties | ||||||
|---|---|---|---|---|---|---|---|
| Quadrant | DetID | PixID | Counts | Sigma | Mean | Median | Sigma |
| A | 4 | 95 | 400663 | 2218.46 | 715 | 694 | 180.3 |
| A | 7 | 64 | 126458 | 697.56 | 715 | 694 | 180.3 |
| A | 3 | 14 | 103028 | 567.6 | 715 | 694 | 180.3 |
| B | 4 | 206 | 455780 | 2967.78 | 708 | 683 | 153.3 |
| B | 4 | 171 | 104244 | 675.34 | 708 | 683 | 153.3 |
| B | 4 | 21 | 43032 | 276.17 | 708 | 683 | 153.3 |
| C | 3 | 248 | 325402 | 1699.1 | 686 | 676 | 191.1 |
| C | 13 | 3 | 291058 | 1519.4 | 686 | 676 | 191.1 |
| C | 6 | 223 | 278854 | 1455.54 | 686 | 676 | 191.1 |
| D | 2 | 249 | 672832 | 3446.98 | 679 | 648 | 195.0 |
| D | 3 | 12 | 292678 | 1497.54 | 679 | 648 | 195.0 |
| D | 2 | 252 | 109495 | 558.17 | 679 | 648 | 195.0 |
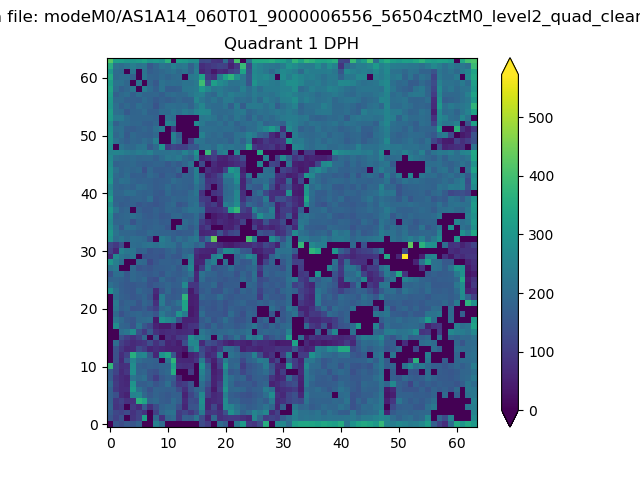
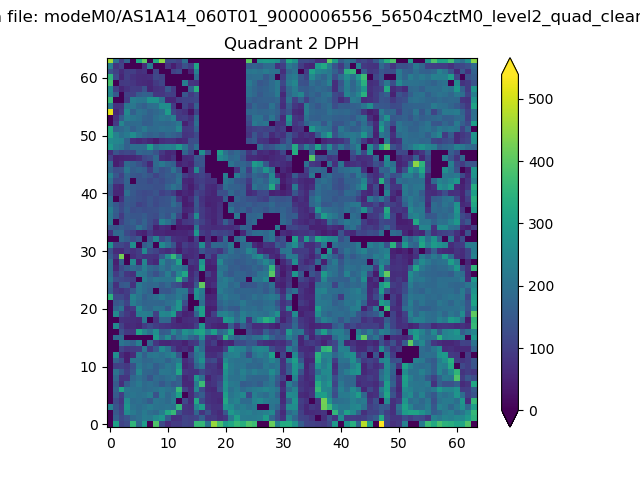
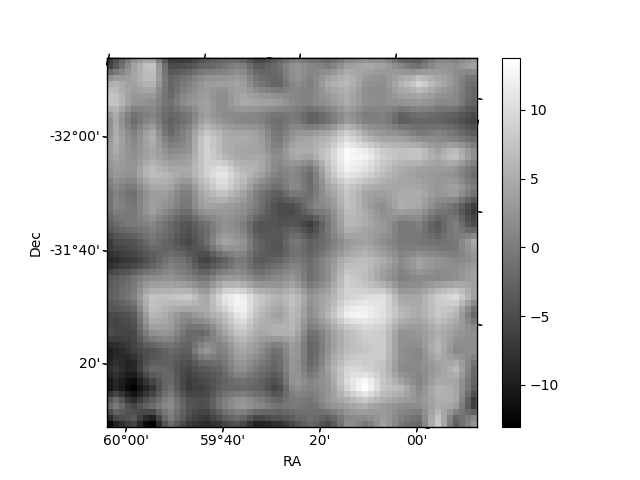
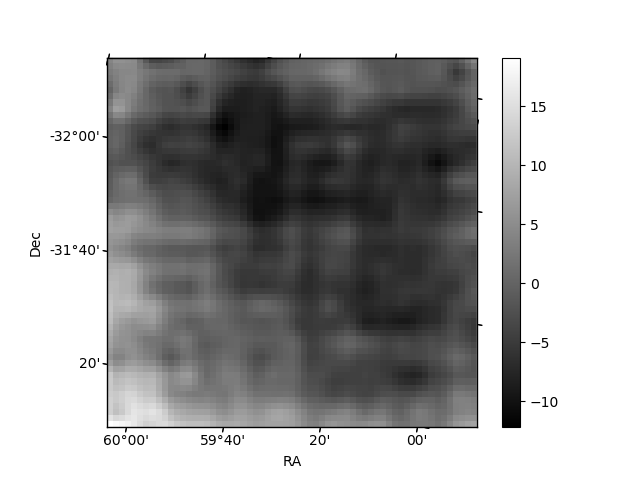
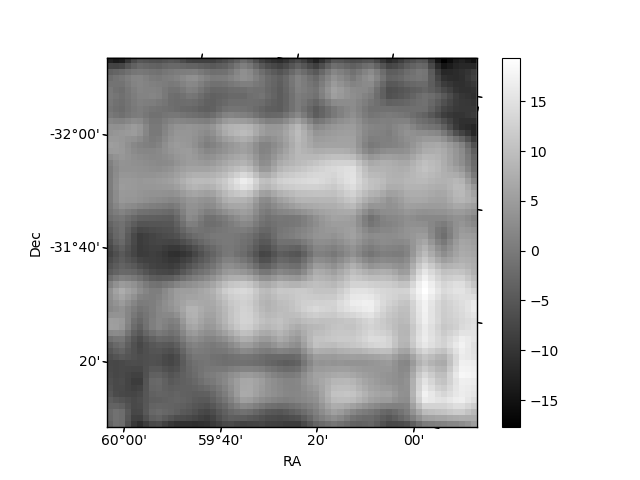
Histogram calculated using DETX and DETY for each event in the final _common_clean file
| Quadrant A |  |
 |
Quadrant B |
|---|---|---|---|
| Quadrant D |  |
 |
Quadrant C |
| Plot type | Count rate plots | Images |
|---|---|---|
| Comparison with Poisson distribution Blue bars denote a histogram of data divided into 1 sec bins. Red curve is a Poisson curve with rate = median count rate of data. |
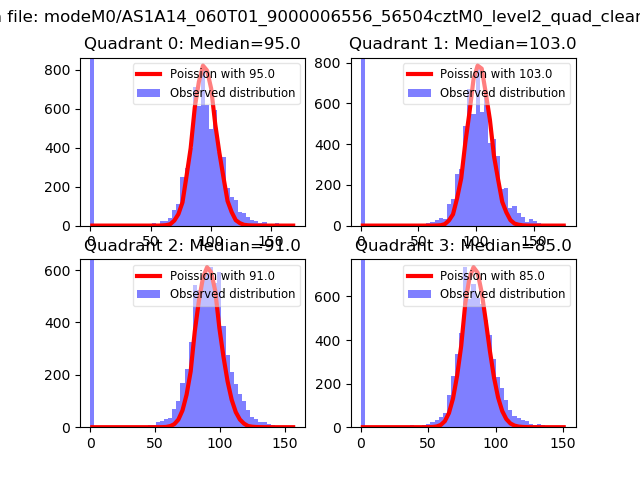 |
 |
| Quadrant-wise count rates Data is divided into 100 sec bins |
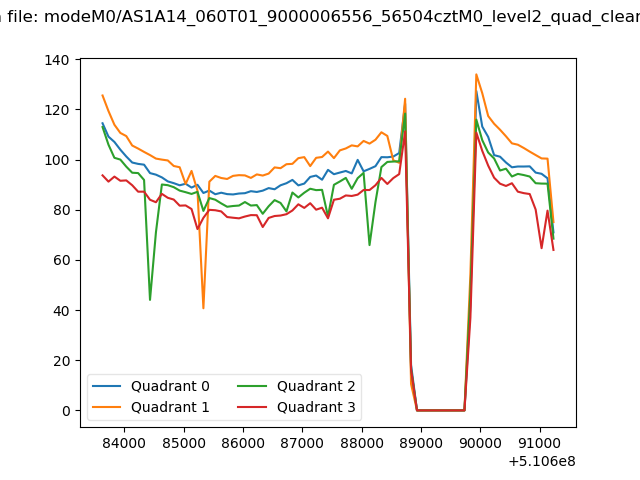 |
|
| Module-wise count rates for Quadrant A Data is divided into 100 sec bins |
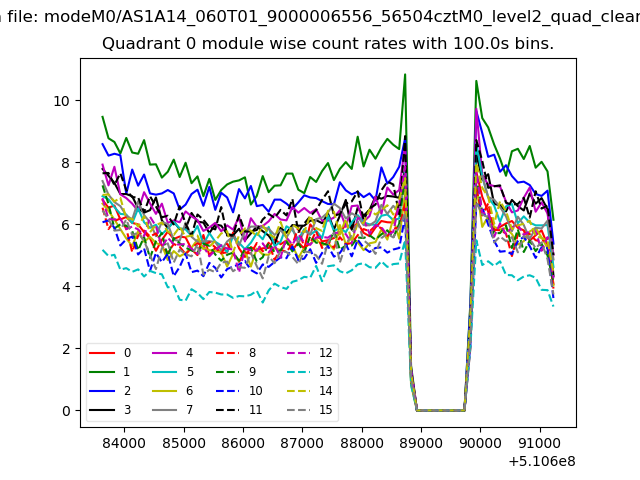 |
 |
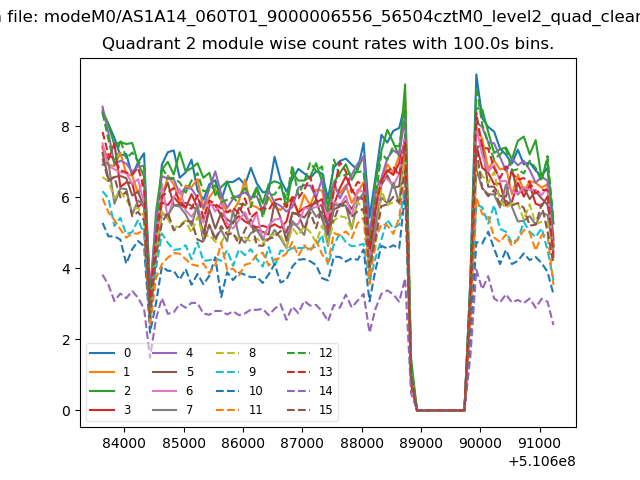
| Module-wise count rates for Quadrant B Data is divided into 100 sec bins |
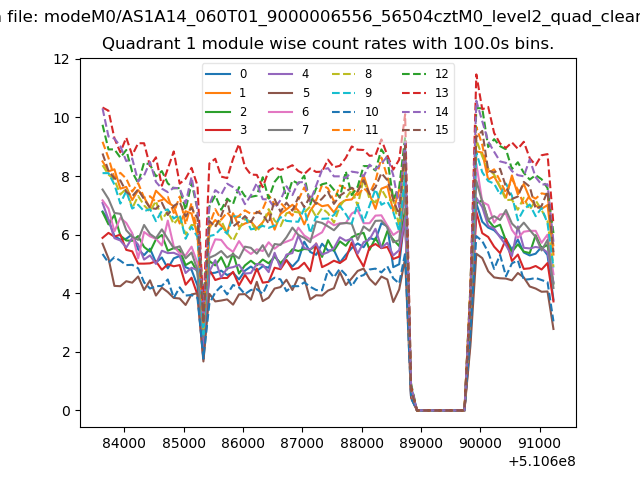 |
 |
| Module-wise count rates for Quadrant C Data is divided into 100 sec bins |
 |
 |
| Module-wise count rates for Quadrant D Data is divided into 100 sec bins |
 |
 |
| Parameter | Plot |
|---|---|
| CZT HV Monitor | 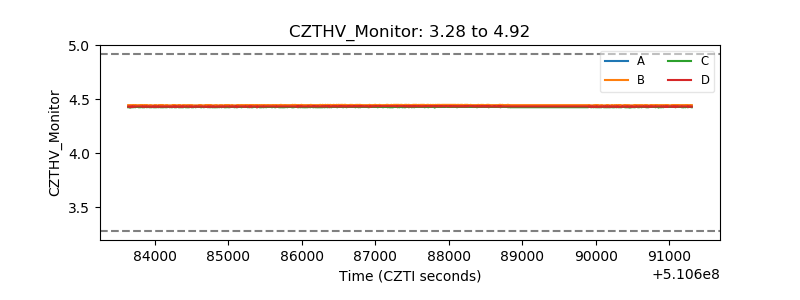 |
| D_VDD |  |
| Temperature 1 | 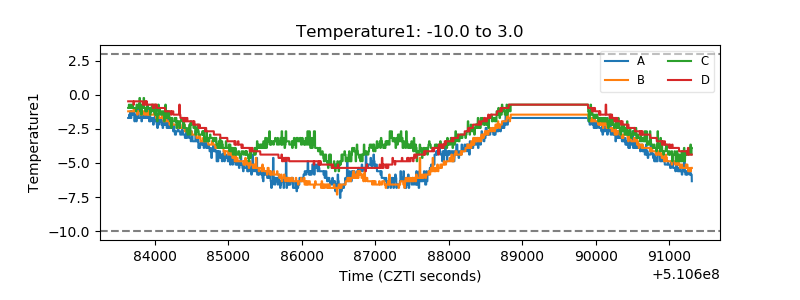 |
| Veto HV Monitor |  |
| Veto LLD | 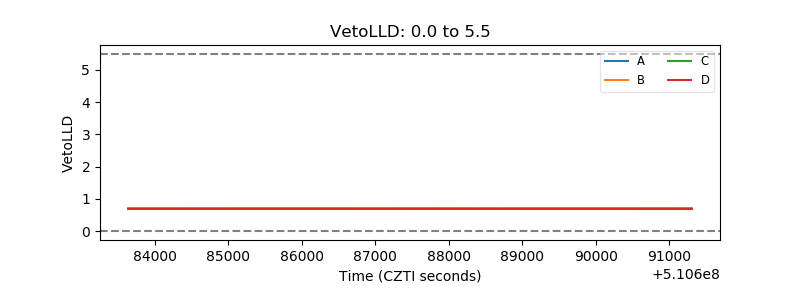 |
| Alpha Counter |  |
| _CPM_Rate | 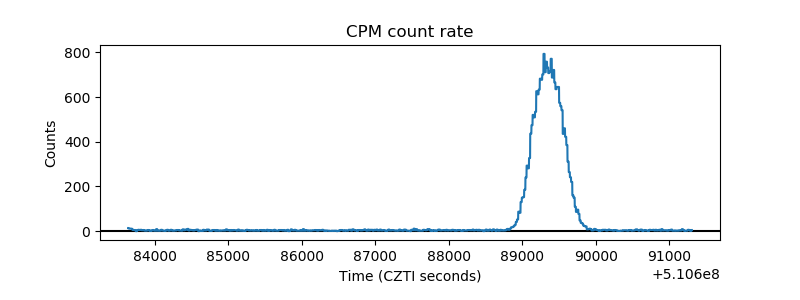 |
| CZT Counter | 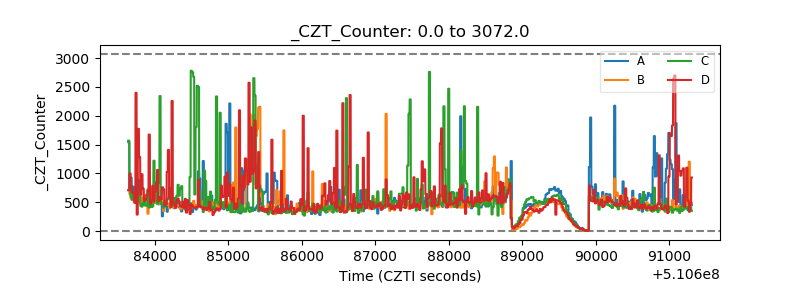 |
| +2.5 Volts monitor | 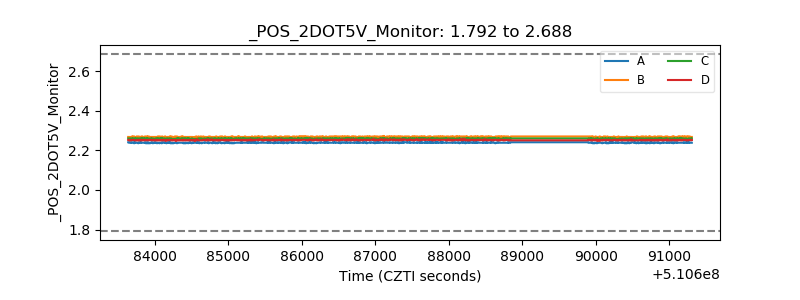 |
| +5 Volts monitor | 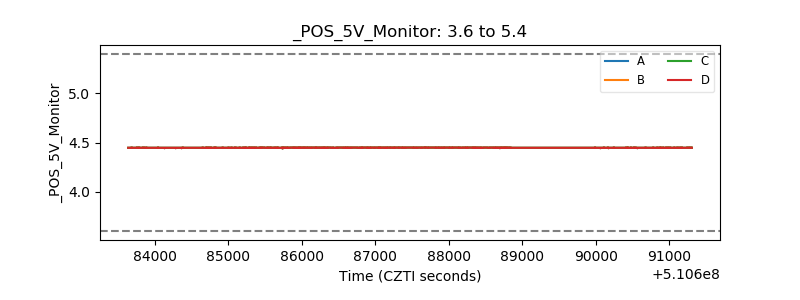 |
| _ROLL_ROT |  |
| _Roll_DEC |  |
| _Roll_RA |  |
| Veto Counter |  |