| Param | Original file | Final file |
|---|---|---|
| Filename | modeM0/AS1A14_060T01_9000006556_56505cztM0_level2.fits | modeM0/AS1A14_060T01_9000006556_56505cztM0_level2_quad_clean.evt |
| Size (bytes) | 424,422,720 | 95,512,320 |
| Size | 404.8 MB | 91.1 MB |
| Events in quadrant A | 4,715,573 | 612,682 |
| Events in quadrant B | 3,699,169 | 678,428 |
| Events in quadrant C | 2,970,390 | 601,271 |
| Events in quadrant D | 3,827,262 | 552,336 |
| Mode M0 | |||
|---|---|---|---|
| Quadrant | BADHDUFLAG | Total packets | Discarded packets |
| A | 0 | 18517 | 2 |
| B | 0 | 15352 | 2 |
| C | 0 | 13575 | 2 |
| D | 0 | 15852 | 2 |
| Mode M9 | |||
|---|---|---|---|
| Quadrant | BADHDUFLAG | Total packets | Discarded packets |
| A | 0 | 17 | 0 |
| B | 0 | 17 | 0 |
| C | 0 | 18 | 0 |
| D | 0 | 18 | 0 |
| Mode SS | |||
|---|---|---|---|
| Quadrant | BADHDUFLAG | Total packets | Discarded packets |
| A | 0 | 130 | 0 |
| B | 0 | 130 | 0 |
| C | 0 | 130 | 0 |
| D | 0 | 130 | 0 |
| Quadrant | Total seconds | Saturated seconds | Saturation percentage |
|---|---|---|---|
| A | 6413 | 197 | 3.071885% |
| B | 6413 | 98 | 1.528146% |
| C | 6413 | 30 | 0.467800% |
| D | 6413 | 157 | 2.448152% |
Noise dominated data is calculated using 1-second bins in cleaned event files. If a bin has >2000 counts, and if more than 50% of those come from <1% of pixels, then it is considered to be noise-dominated and hence unusable.
| Quadrant | # 1 sec bins | Bins with >0 counts | Bins with >2000 counts | High rate bins dominated by noise | Noise dominated (total time) | Noise dominated (detector-on time) | Marked lightcurve |
|---|---|---|---|---|---|---|---|
| A | 7558 | 6414 | 223 | 223 | 2.95% | 3.48% | 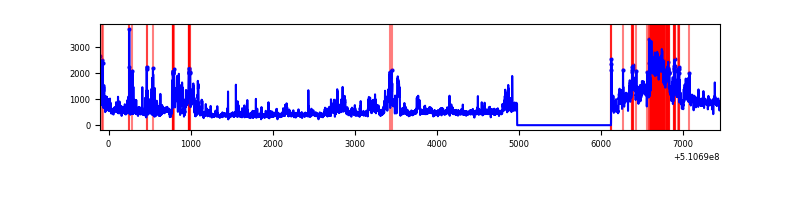 |
| B | 7558 | 6414 | 54 | 54 | 0.71% | 0.84% | 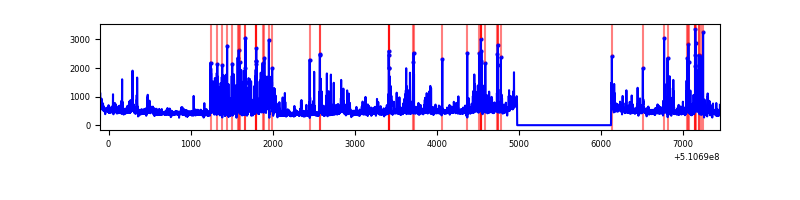 |
| C | 7558 | 6414 | 17 | 17 | 0.22% | 0.27% |  |
| D | 7558 | 6414 | 159 | 159 | 2.10% | 2.48% | 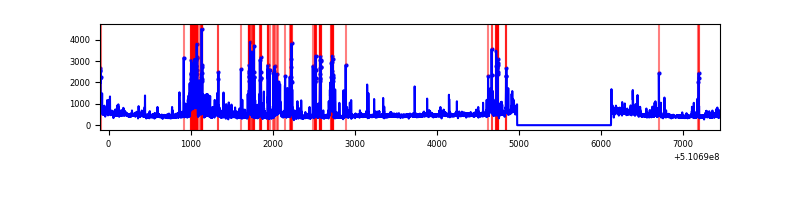 |
Top three noisy pixels from each quadrant. If the there are fewer than three noisy pixels in the level2.evt file, extra rows are filled as -1
| Pixel properties | Quadrant properties | ||||||
|---|---|---|---|---|---|---|---|
| Quadrant | DetID | PixID | Counts | Sigma | Mean | Median | Sigma |
| A | 4 | 95 | 774012 | 4492.02 | 692 | 676 | 172.2 |
| A | 0 | 12 | 685740 | 3979.28 | 692 | 676 | 172.2 |
| A | 7 | 64 | 317037 | 1837.62 | 692 | 676 | 172.2 |
| B | 4 | 206 | 554807 | 3732.97 | 693 | 668 | 148.4 |
| B | 4 | 171 | 155162 | 1040.75 | 693 | 668 | 148.4 |
| B | 0 | 213 | 62456 | 416.24 | 693 | 668 | 148.4 |
| C | 13 | 3 | 95220 | 503.73 | 676 | 669 | 187.7 |
| C | 12 | 252 | 83481 | 441.19 | 676 | 669 | 187.7 |
| C | 6 | 223 | 71119 | 375.33 | 676 | 669 | 187.7 |
| D | 3 | 12 | 369280 | 1955.67 | 661 | 631 | 188.5 |
| D | 2 | 249 | 352503 | 1866.67 | 661 | 631 | 188.5 |
| D | 2 | 252 | 96705 | 509.67 | 661 | 631 | 188.5 |
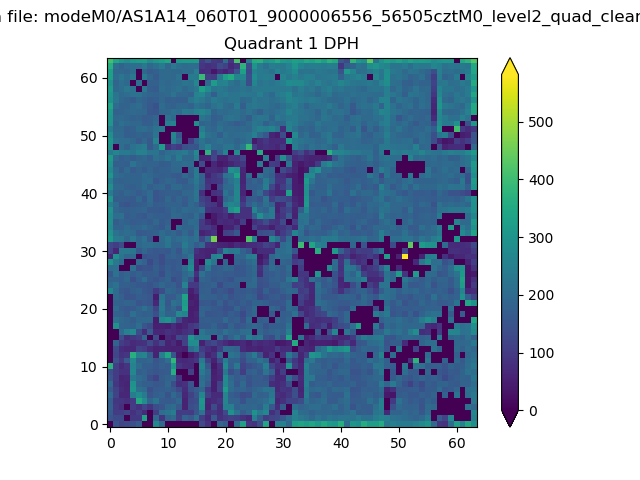
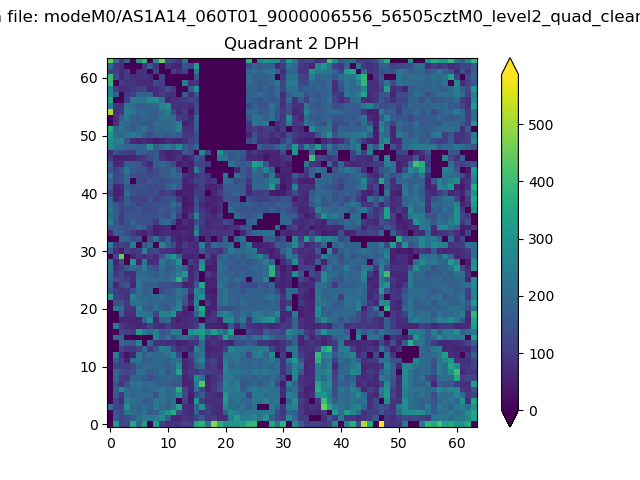
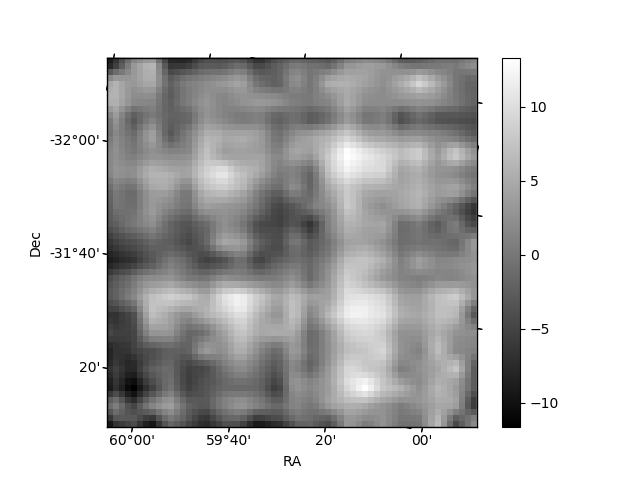
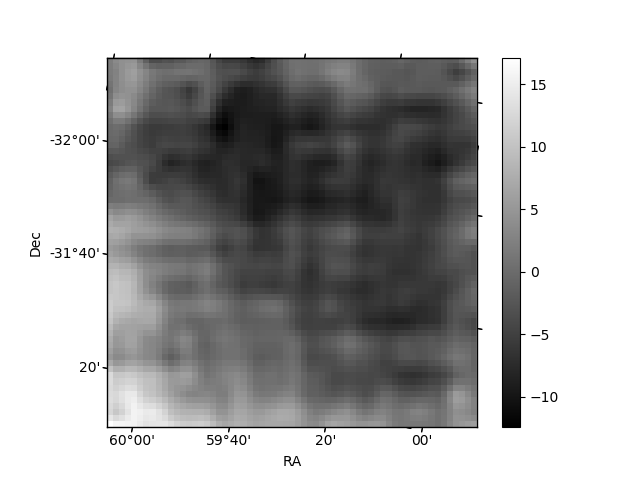
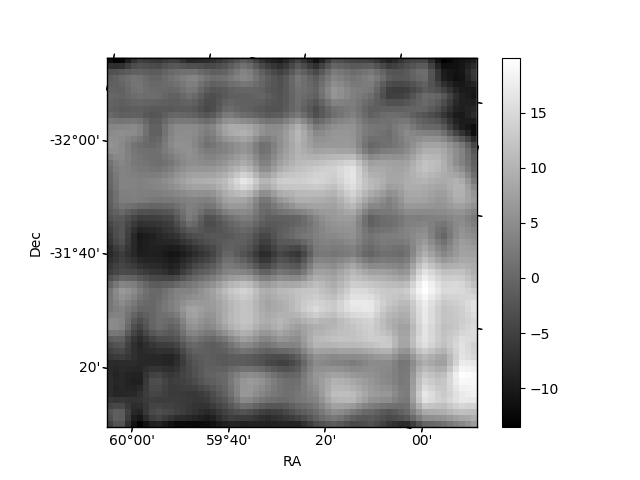
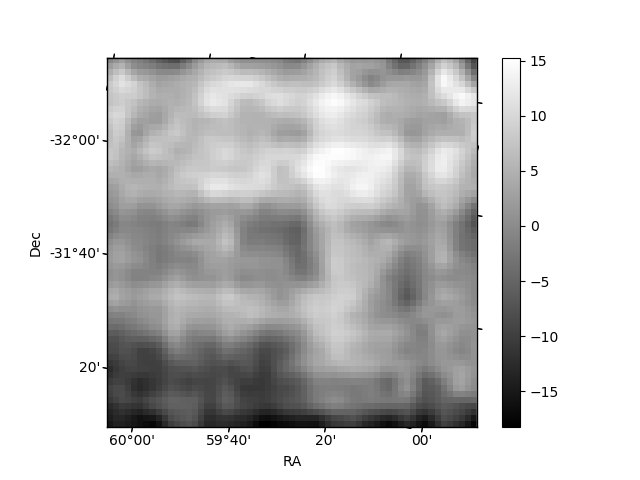
Histogram calculated using DETX and DETY for each event in the final _common_clean file
| Quadrant A | 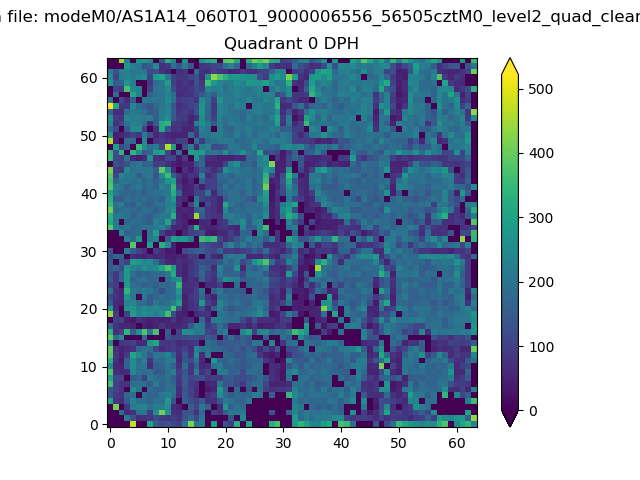 |
 |
Quadrant B |
|---|---|---|---|
| Quadrant D | 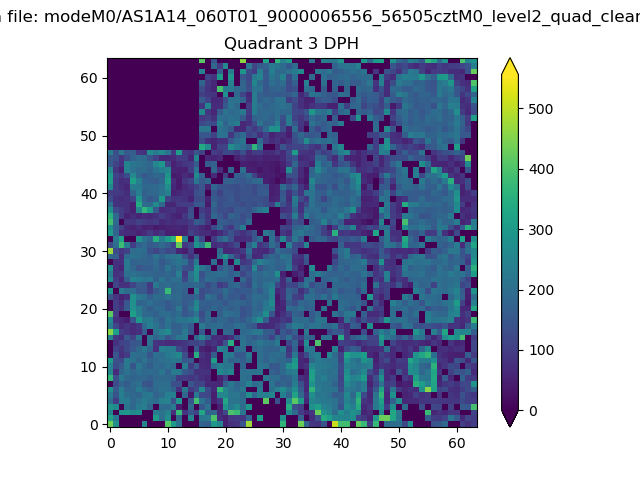 |
 |
Quadrant C |
| Plot type | Count rate plots | Images |
|---|---|---|
| Comparison with Poisson distribution Blue bars denote a histogram of data divided into 1 sec bins. Red curve is a Poisson curve with rate = median count rate of data. |
 |
 |
| Quadrant-wise count rates Data is divided into 100 sec bins |
 |
|
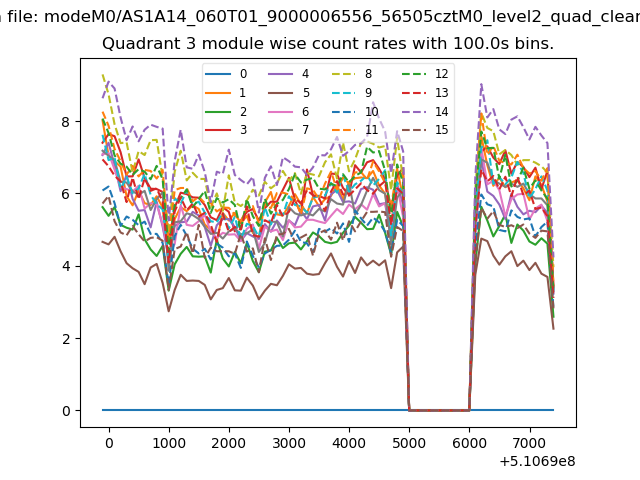
| Module-wise count rates for Quadrant A Data is divided into 100 sec bins |
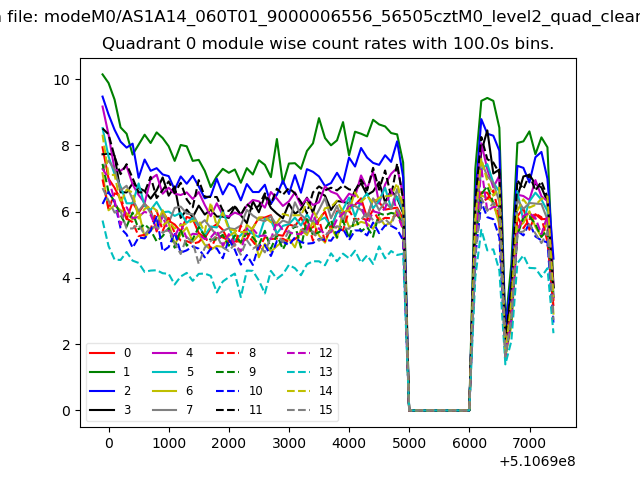 |
 |
| Module-wise count rates for Quadrant B Data is divided into 100 sec bins |
 |
 |
| Module-wise count rates for Quadrant C Data is divided into 100 sec bins |
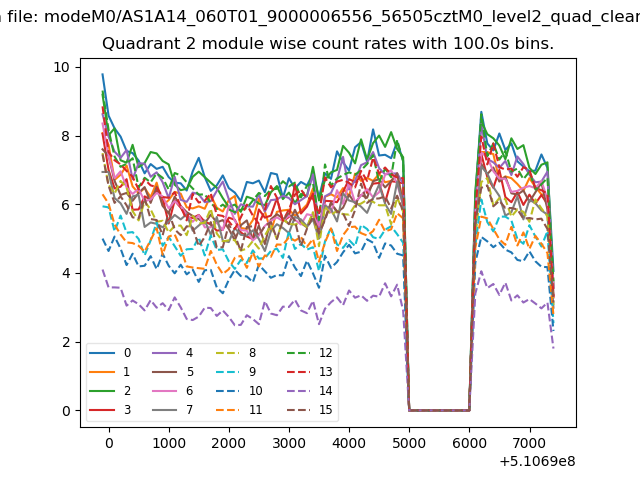 |
 |
| Module-wise count rates for Quadrant D Data is divided into 100 sec bins |
 |
 |
| Parameter | Plot |
|---|---|
| CZT HV Monitor |  |
| D_VDD | 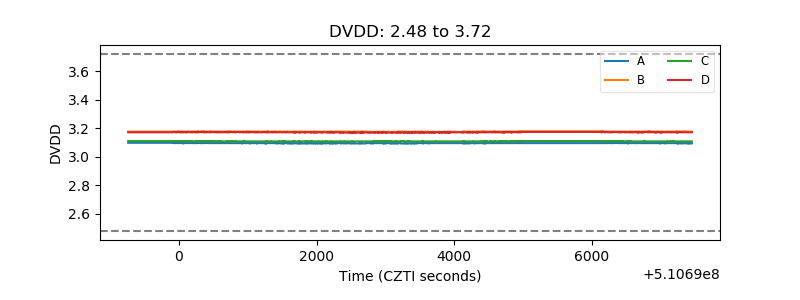 |
| Temperature 1 | 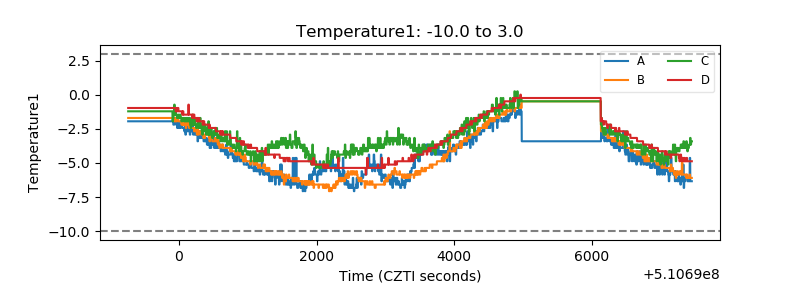 |
| Veto HV Monitor |  |
| Veto LLD |  |
| Alpha Counter | 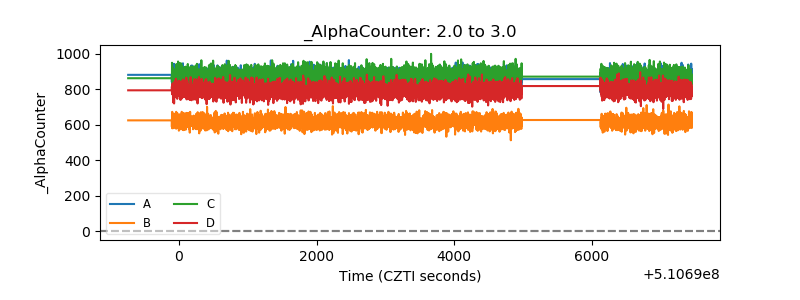 |
| _CPM_Rate |  |
| CZT Counter | 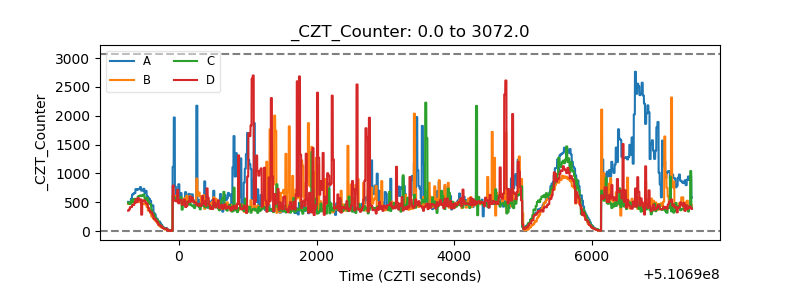 |
| +2.5 Volts monitor |  |
| +5 Volts monitor |  |
| _ROLL_ROT |  |
| _Roll_DEC |  |
| _Roll_RA | 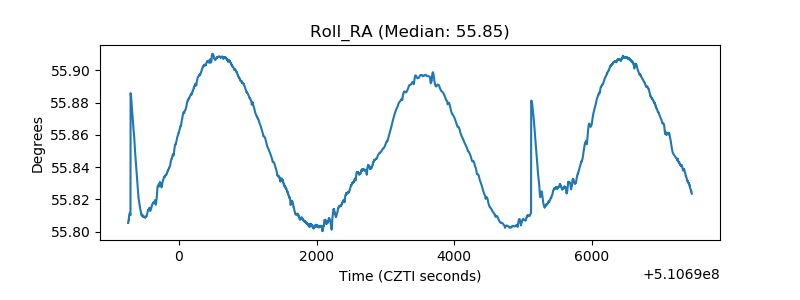 |
| Veto Counter |  |