| Param | Original file | Final file |
|---|---|---|
| Filename | modeM0/AS1A14_060T01_9000006556_56506cztM0_level2.fits | modeM0/AS1A14_060T01_9000006556_56506cztM0_level2_quad_clean.evt |
| Size (bytes) | 473,290,560 | 94,383,360 |
| Size | 451.4 MB | 90.0 MB |
| Events in quadrant A | 5,259,395 | 601,774 |
| Events in quadrant B | 4,073,571 | 673,696 |
| Events in quadrant C | 3,333,106 | 597,485 |
| Events in quadrant D | 4,364,201 | 544,886 |
| Mode M0 | |||
|---|---|---|---|
| Quadrant | BADHDUFLAG | Total packets | Discarded packets |
| A | 0 | 20002 | 2 |
| B | 0 | 16296 | 4 |
| C | 0 | 14418 | 2 |
| D | 0 | 17341 | 2 |
| Mode M9 | |||
|---|---|---|---|
| Quadrant | BADHDUFLAG | Total packets | Discarded packets |
| A | 0 | 12 | 0 |
| B | 0 | 13 | 0 |
| C | 0 | 13 | 0 |
| D | 0 | 13 | 0 |
| Mode SS | |||
|---|---|---|---|
| Quadrant | BADHDUFLAG | Total packets | Discarded packets |
| A | 0 | 128 | 0 |
| B | 0 | 128 | 0 |
| C | 0 | 128 | 0 |
| D | 0 | 128 | 0 |
| Quadrant | Total seconds | Saturated seconds | Saturation percentage |
|---|---|---|---|
| A | 6305 | 346 | 5.487708% |
| B | 6304 | 225 | 3.569162% |
| C | 6304 | 118 | 1.871827% |
| D | 6304 | 255 | 4.045051% |
Noise dominated data is calculated using 1-second bins in cleaned event files. If a bin has >2000 counts, and if more than 50% of those come from <1% of pixels, then it is considered to be noise-dominated and hence unusable.
| Quadrant | # 1 sec bins | Bins with >0 counts | Bins with >2000 counts | High rate bins dominated by noise | Noise dominated (total time) | Noise dominated (detector-on time) | Marked lightcurve |
|---|---|---|---|---|---|---|---|
| A | 7480 | 6306 | 303 | 303 | 4.05% | 4.80% |  |
| B | 7479 | 6305 | 113 | 113 | 1.51% | 1.79% |  |
| C | 7479 | 6305 | 101 | 101 | 1.35% | 1.60% | 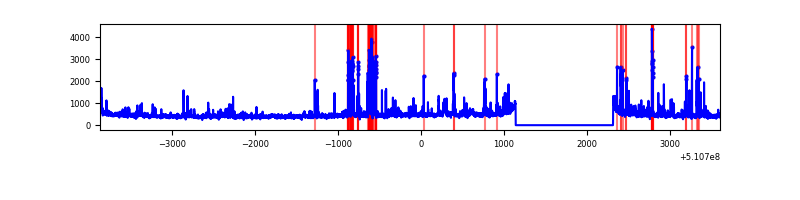 |
| D | 7479 | 6304 | 242 | 242 | 3.24% | 3.84% |  |
Top three noisy pixels from each quadrant. If the there are fewer than three noisy pixels in the level2.evt file, extra rows are filled as -1
| Pixel properties | Quadrant properties | ||||||
|---|---|---|---|---|---|---|---|
| Quadrant | DetID | PixID | Counts | Sigma | Mean | Median | Sigma |
| A | 7 | 64 | 1135211 | 6646.68 | 688 | 670 | 170.7 |
| A | 0 | 12 | 761063 | 4454.74 | 688 | 670 | 170.7 |
| A | 4 | 95 | 478344 | 2798.44 | 688 | 670 | 170.7 |
| B | 4 | 206 | 920240 | 6199.79 | 692 | 668 | 148.3 |
| B | 0 | 213 | 118130 | 791.93 | 692 | 668 | 148.3 |
| B | 4 | 171 | 61142 | 407.72 | 692 | 668 | 148.3 |
| C | 14 | 254 | 314167 | 1676.25 | 674 | 666 | 187.0 |
| C | 13 | 3 | 194462 | 1036.2 | 674 | 666 | 187.0 |
| C | 12 | 252 | 96855 | 514.31 | 674 | 666 | 187.0 |
| D | 2 | 249 | 907753 | 4811.35 | 659 | 629 | 188.5 |
| D | 12 | 16 | 488727 | 2588.85 | 659 | 629 | 188.5 |
| D | 3 | 12 | 116322 | 613.63 | 659 | 629 | 188.5 |
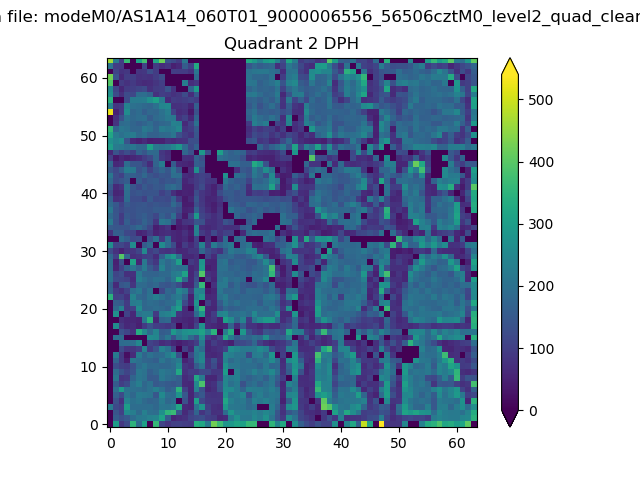
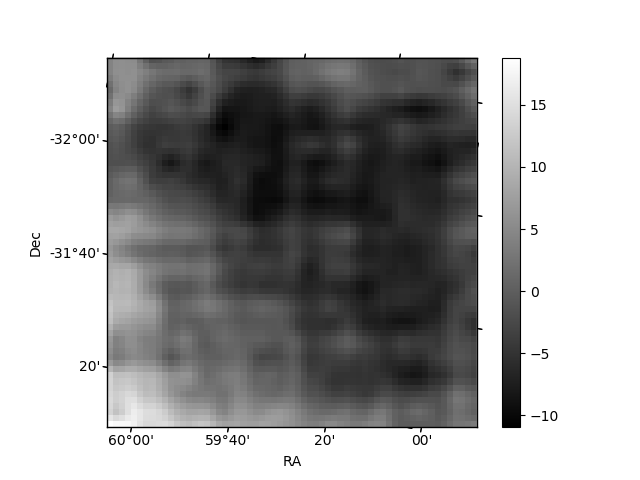
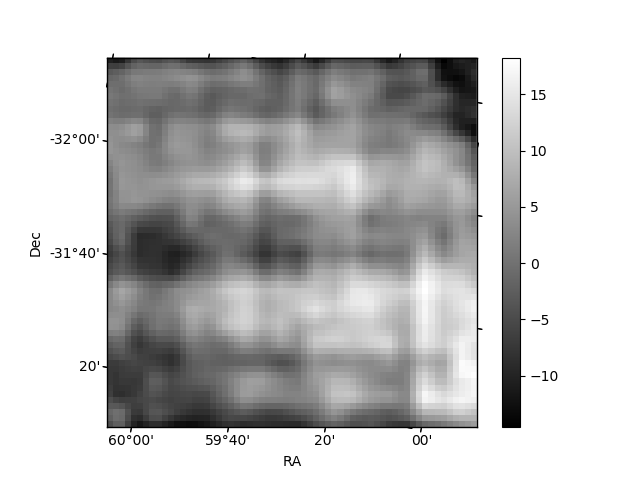
Histogram calculated using DETX and DETY for each event in the final _common_clean file
| Quadrant A | 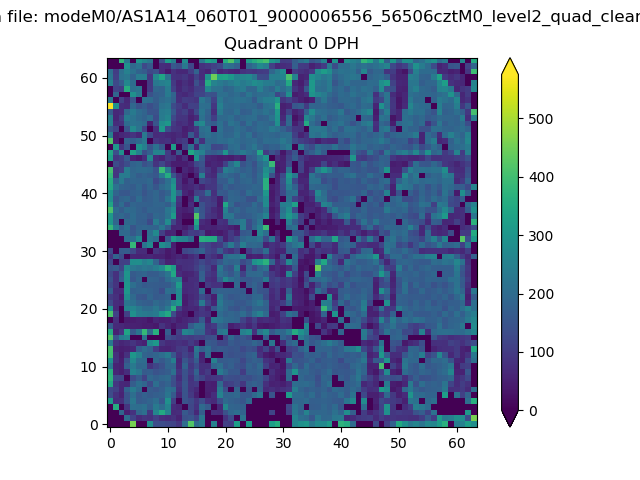 |
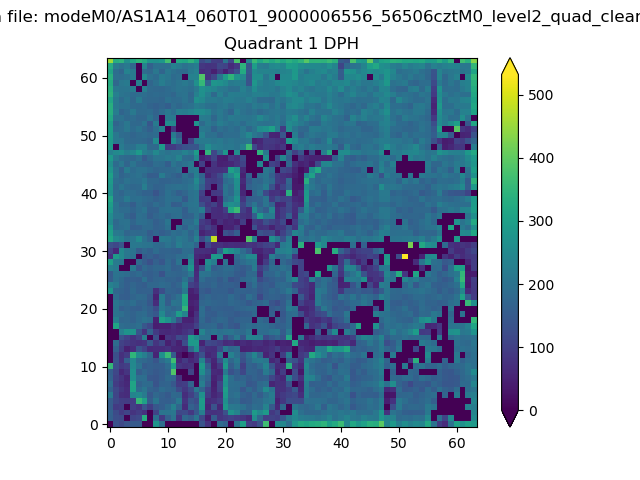 |
Quadrant B |
|---|---|---|---|
| Quadrant D | 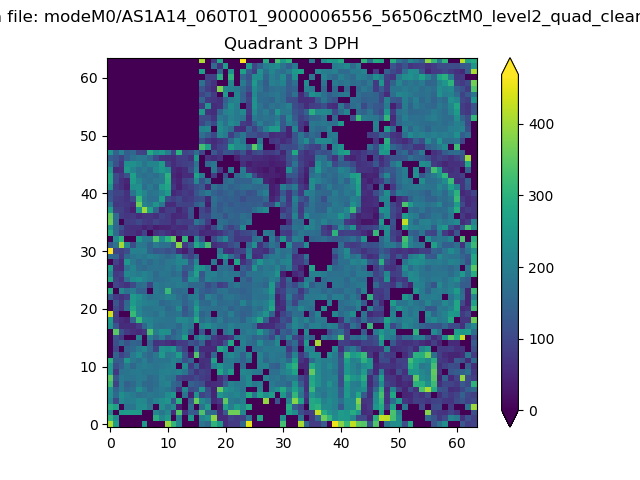 |
 |
Quadrant C |
| Plot type | Count rate plots | Images |
|---|---|---|
| Comparison with Poisson distribution Blue bars denote a histogram of data divided into 1 sec bins. Red curve is a Poisson curve with rate = median count rate of data. |
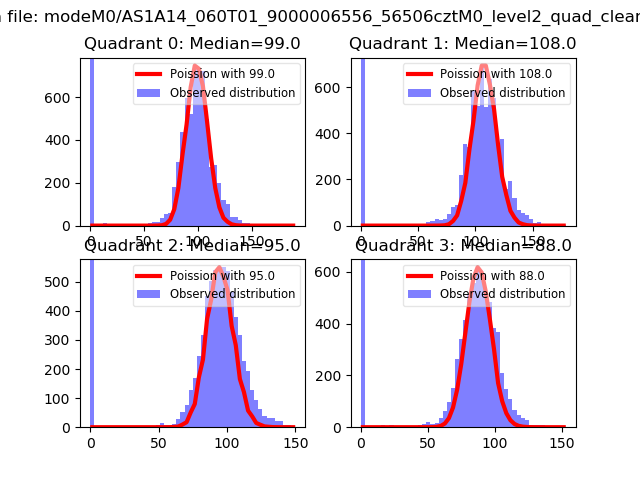 |
 |
| Quadrant-wise count rates Data is divided into 100 sec bins |
 |
|
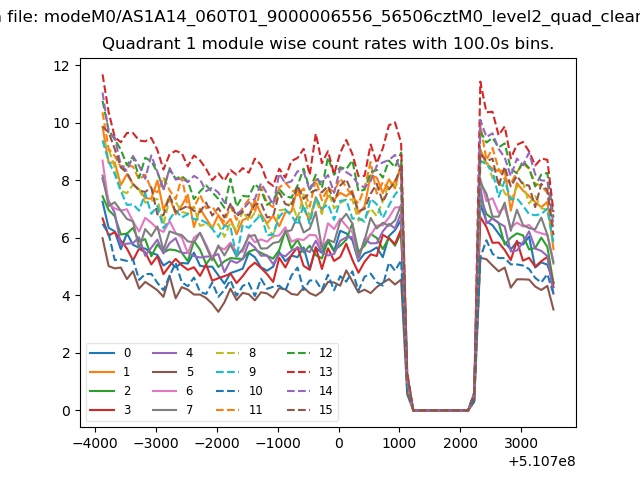
| Module-wise count rates for Quadrant A Data is divided into 100 sec bins |
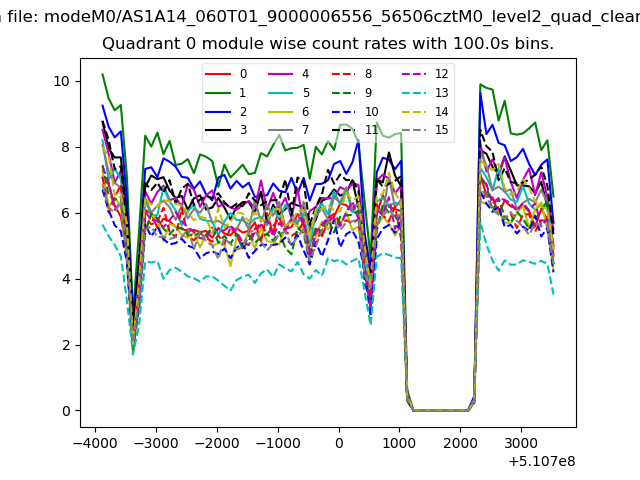 |
 |
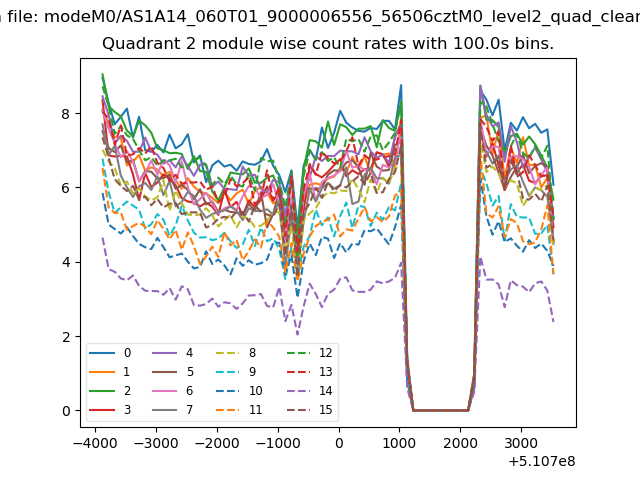
| Module-wise count rates for Quadrant B Data is divided into 100 sec bins |
 |
 |
| Module-wise count rates for Quadrant C Data is divided into 100 sec bins |
 |
 |
| Module-wise count rates for Quadrant D Data is divided into 100 sec bins |
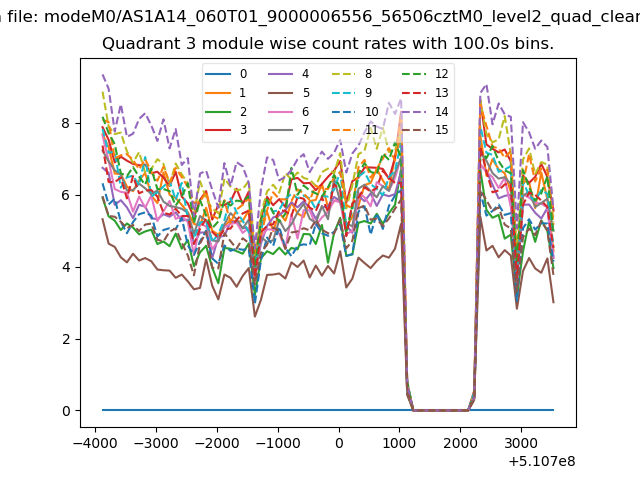 |
 |
| Parameter | Plot |
|---|---|
| CZT HV Monitor | 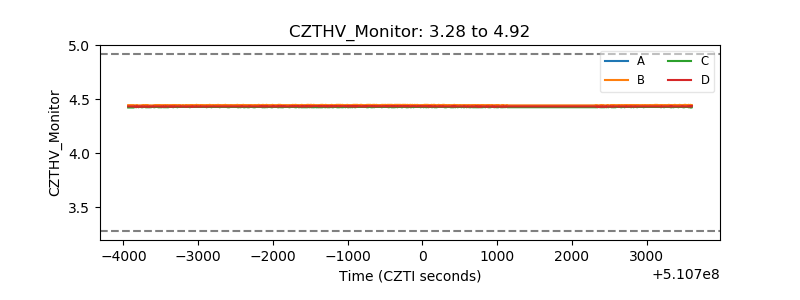 |
| D_VDD |  |
| Temperature 1 | 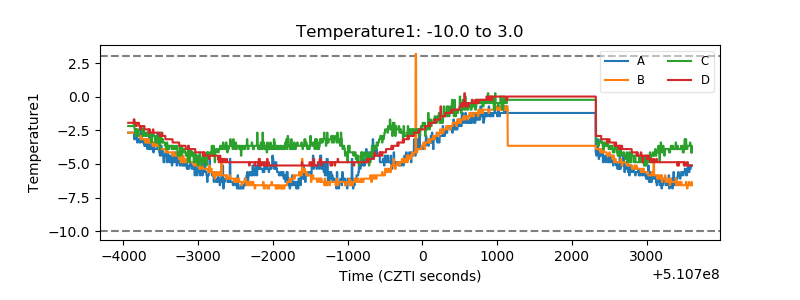 |
| Veto HV Monitor |  |
| Veto LLD | 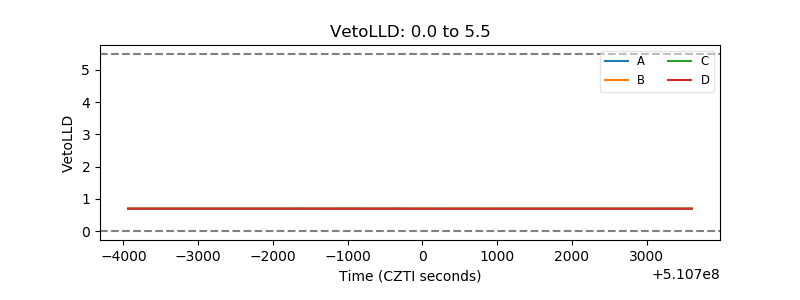 |
| Alpha Counter | 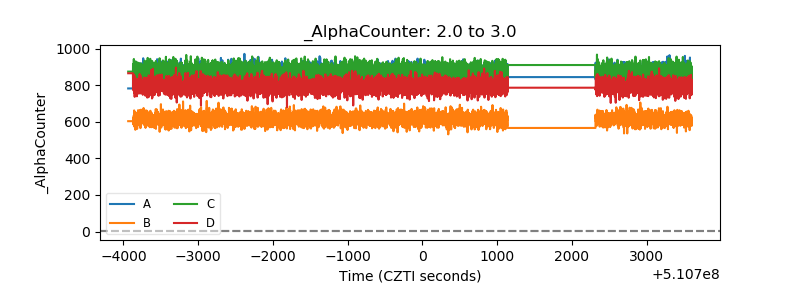 |
| _CPM_Rate | 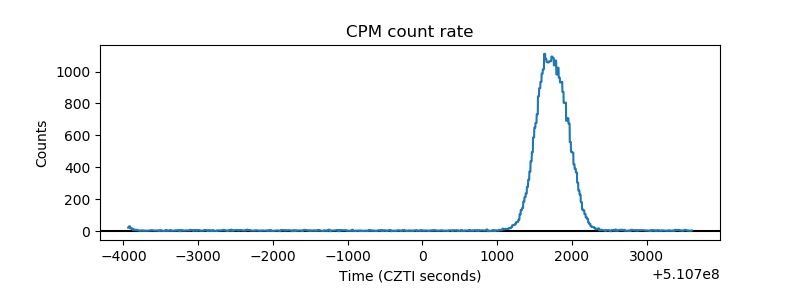 |
| CZT Counter | 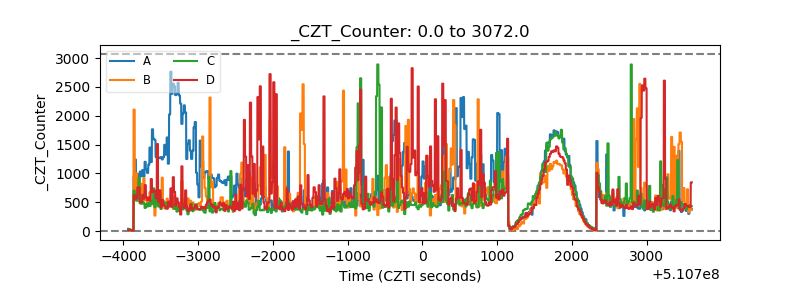 |
| +2.5 Volts monitor |  |
| +5 Volts monitor | 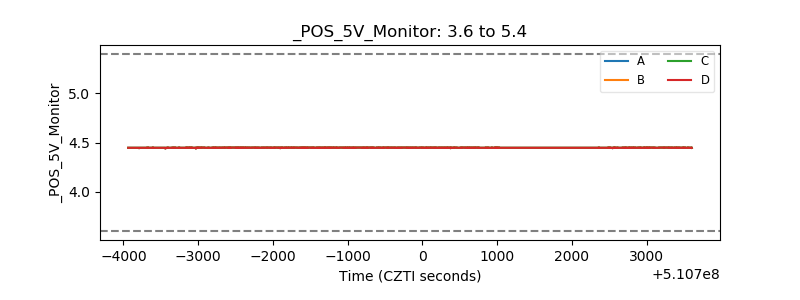 |
| _ROLL_ROT |  |
| _Roll_DEC |  |
| _Roll_RA |  |
| Veto Counter |  |