| Param | Original file | Final file |
|---|---|---|
| Filename | modeM0/AS1A14_060T01_9000006556_56507cztM0_level2.fits | modeM0/AS1A14_060T01_9000006556_56507cztM0_level2_quad_clean.evt |
| Size (bytes) | 397,733,760 | 95,693,760 |
| Size | 379.3 MB | 91.3 MB |
| Events in quadrant A | 3,283,437 | 628,284 |
| Events in quadrant B | 3,555,493 | 680,531 |
| Events in quadrant C | 3,476,868 | 598,481 |
| Events in quadrant D | 3,917,500 | 551,211 |
| Mode M0 | |||
|---|---|---|---|
| Quadrant | BADHDUFLAG | Total packets | Discarded packets |
| A | 0 | 14195 | 2 |
| B | 0 | 14834 | 3 |
| C | 0 | 14803 | 2 |
| D | 0 | 16028 | 2 |
| Mode M9 | |||
|---|---|---|---|
| Quadrant | BADHDUFLAG | Total packets | Discarded packets |
| A | 0 | 20 | 0 |
| B | 0 | 20 | 0 |
| C | 0 | 21 | 0 |
| D | 0 | 21 | 0 |
| Mode SS | |||
|---|---|---|---|
| Quadrant | BADHDUFLAG | Total packets | Discarded packets |
| A | 0 | 128 | 0 |
| B | 0 | 128 | 0 |
| C | 0 | 128 | 0 |
| D | 0 | 128 | 0 |
| Quadrant | Total seconds | Saturated seconds | Saturation percentage |
|---|---|---|---|
| A | 6295 | 47 | 0.746624% |
| B | 6294 | 114 | 1.811249% |
| C | 6294 | 116 | 1.843025% |
| D | 6294 | 196 | 3.114077% |
Noise dominated data is calculated using 1-second bins in cleaned event files. If a bin has >2000 counts, and if more than 50% of those come from <1% of pixels, then it is considered to be noise-dominated and hence unusable.
| Quadrant | # 1 sec bins | Bins with >0 counts | Bins with >2000 counts | High rate bins dominated by noise | Noise dominated (total time) | Noise dominated (detector-on time) | Marked lightcurve |
|---|---|---|---|---|---|---|---|
| A | 7515 | 6296 | 18 | 18 | 0.24% | 0.29% |  |
| B | 7514 | 6295 | 49 | 49 | 0.65% | 0.78% |  |
| C | 7514 | 6295 | 111 | 111 | 1.48% | 1.76% | 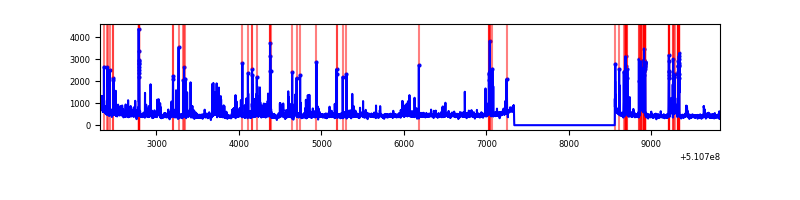 |
| D | 7514 | 6295 | 176 | 176 | 2.34% | 2.80% |  |
Top three noisy pixels from each quadrant. If the there are fewer than three noisy pixels in the level2.evt file, extra rows are filled as -1
| Pixel properties | Quadrant properties | ||||||
|---|---|---|---|---|---|---|---|
| Quadrant | DetID | PixID | Counts | Sigma | Mean | Median | Sigma |
| A | 4 | 95 | 210187 | 1210.51 | 699 | 682 | 173.1 |
| A | 3 | 14 | 185277 | 1066.58 | 699 | 682 | 173.1 |
| A | 7 | 64 | 68723 | 393.14 | 699 | 682 | 173.1 |
| B | 4 | 206 | 413609 | 2762.15 | 697 | 671 | 149.5 |
| B | 4 | 171 | 81811 | 542.75 | 697 | 671 | 149.5 |
| B | 5 | 236 | 54200 | 358.06 | 697 | 671 | 149.5 |
| C | 13 | 3 | 496250 | 2640.97 | 680 | 673 | 187.6 |
| C | 9 | 237 | 121187 | 642.23 | 680 | 673 | 187.6 |
| C | 12 | 252 | 82291 | 434.95 | 680 | 673 | 187.6 |
| D | 2 | 249 | 391562 | 2053.28 | 666 | 638 | 190.4 |
| D | 3 | 12 | 356718 | 1870.27 | 666 | 638 | 190.4 |
| D | 12 | 16 | 280811 | 1471.57 | 666 | 638 | 190.4 |
Histogram calculated using DETX and DETY for each event in the final _common_clean file
| Quadrant A | 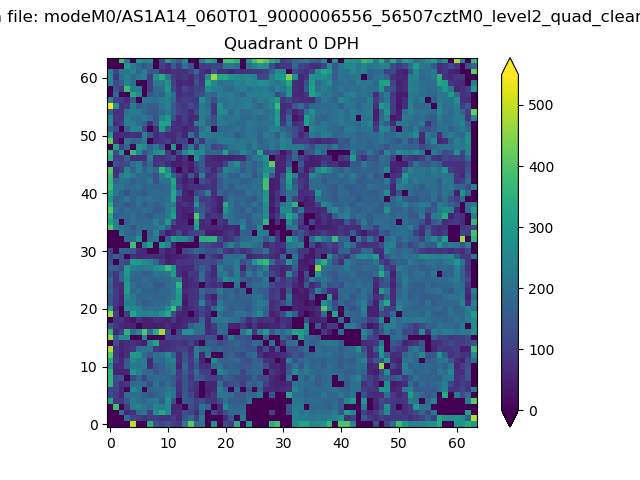 |
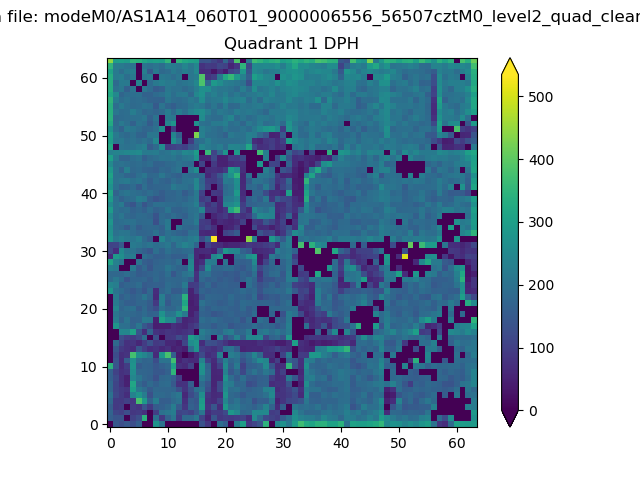 |
Quadrant B |
|---|---|---|---|
| Quadrant D |  |
 |
Quadrant C |
| Plot type | Count rate plots | Images |
|---|---|---|
| Comparison with Poisson distribution Blue bars denote a histogram of data divided into 1 sec bins. Red curve is a Poisson curve with rate = median count rate of data. |
 |
 |
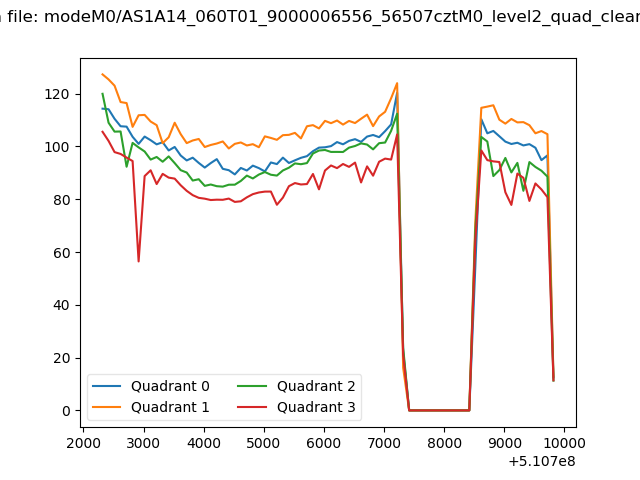
| Quadrant-wise count rates Data is divided into 100 sec bins |
 |
|
| Module-wise count rates for Quadrant A Data is divided into 100 sec bins |
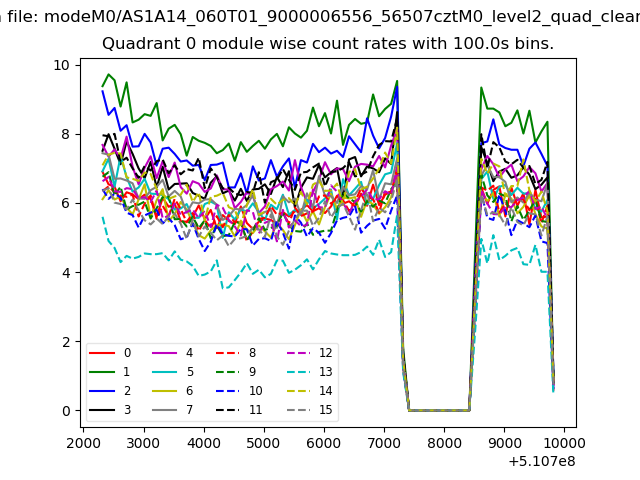 |
 |
| Module-wise count rates for Quadrant B Data is divided into 100 sec bins |
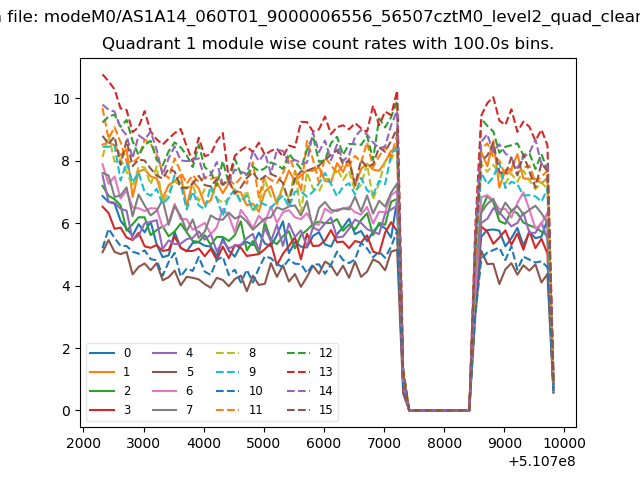 |
 |
| Module-wise count rates for Quadrant C Data is divided into 100 sec bins |
 |
 |
| Module-wise count rates for Quadrant D Data is divided into 100 sec bins |
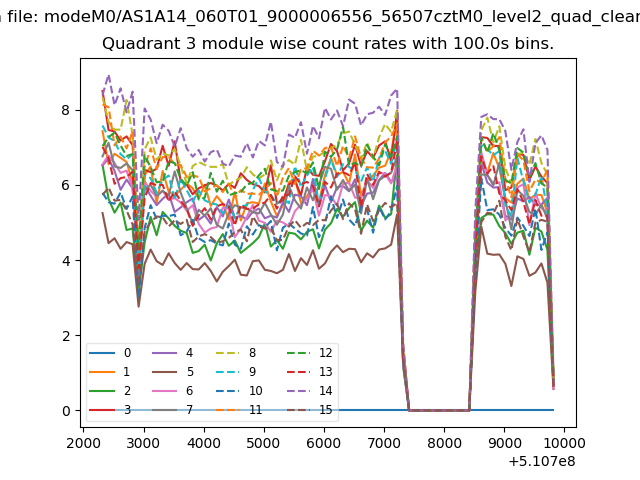 |
 |
| Parameter | Plot |
|---|---|
| CZT HV Monitor |  |
| D_VDD |  |
| Temperature 1 |  |
| Veto HV Monitor | 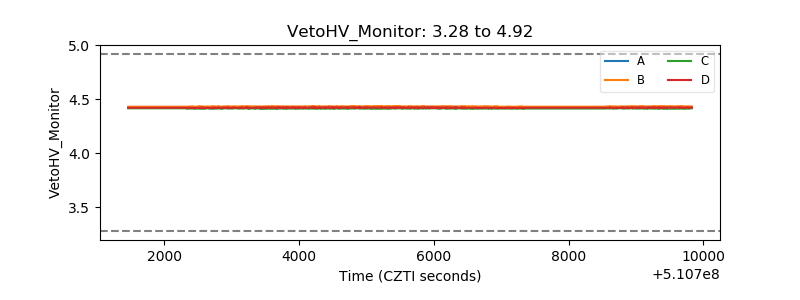 |
| Veto LLD | 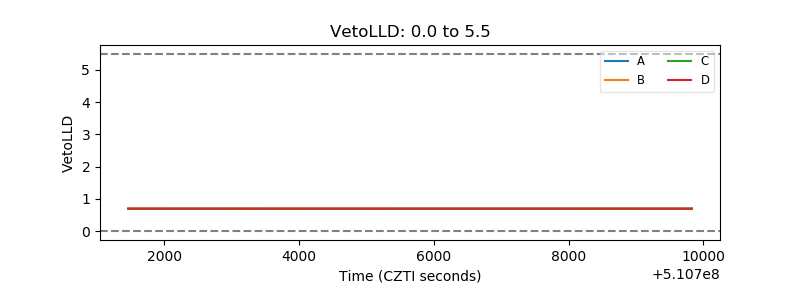 |
| Alpha Counter |  |
| _CPM_Rate | 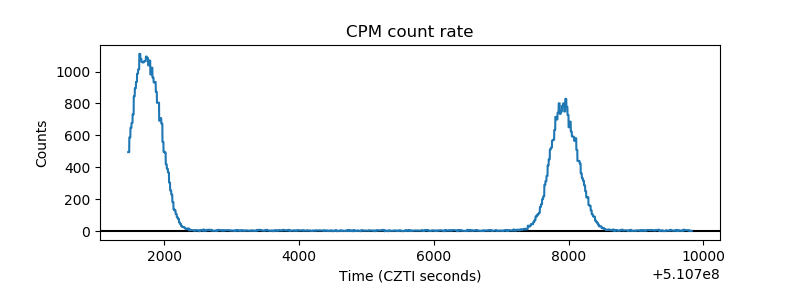 |
| CZT Counter | 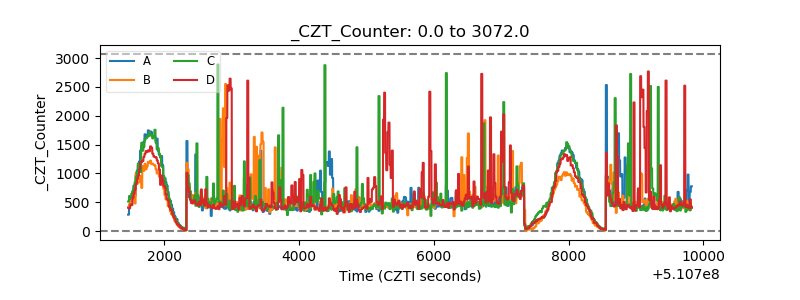 |
| +2.5 Volts monitor |  |
| +5 Volts monitor | 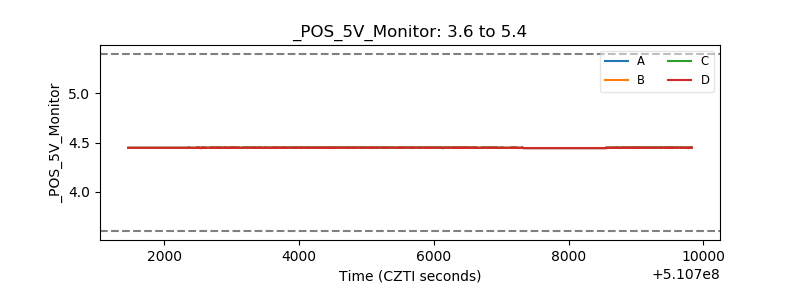 |
| _ROLL_ROT | 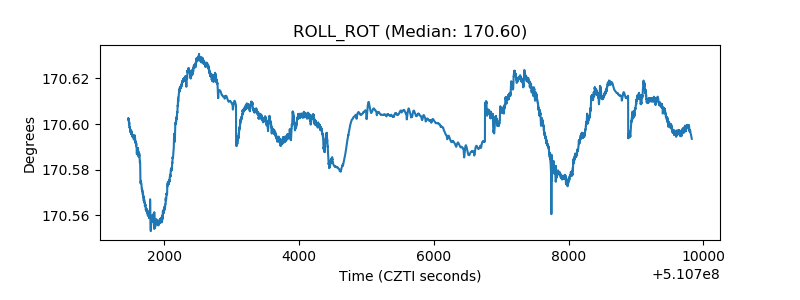 |
| _Roll_DEC | 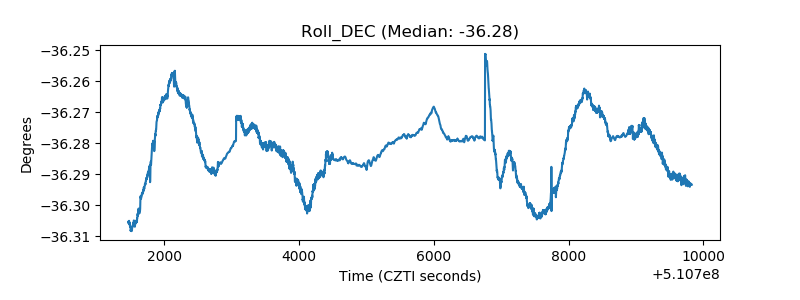 |
| _Roll_RA |  |
| Veto Counter | 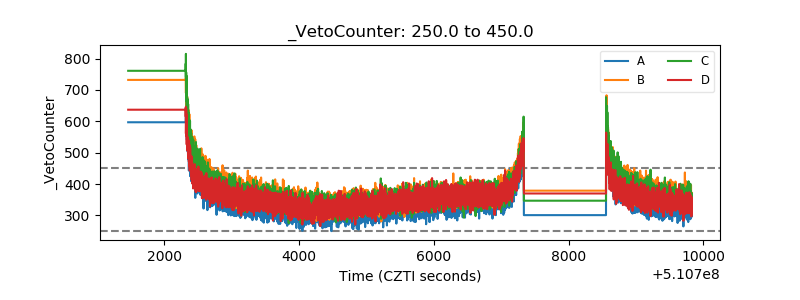 |