| Param | Original file | Final file |
|---|---|---|
| Filename | modeM0/AS1A14_060T01_9000006556_56509cztM0_level2.fits | modeM0/AS1A14_060T01_9000006556_56509cztM0_level2_quad_clean.evt |
| Size (bytes) | 440,588,160 | 100,874,880 |
| Size | 420.2 MB | 96.2 MB |
| Events in quadrant A | 4,858,185 | 641,579 |
| Events in quadrant B | 3,976,426 | 706,495 |
| Events in quadrant C | 3,159,269 | 636,781 |
| Events in quadrant D | 3,776,918 | 586,694 |
| Mode M0 | |||
|---|---|---|---|
| Quadrant | BADHDUFLAG | Total packets | Discarded packets |
| A | 0 | 19250 | 3 |
| B | 0 | 16473 | 3 |
| C | 0 | 14598 | 4 |
| D | 0 | 16087 | 3 |
| Mode M9 | |||
|---|---|---|---|
| Quadrant | BADHDUFLAG | Total packets | Discarded packets |
| A | 0 | 12 | 0 |
| B | 0 | 12 | 0 |
| C | 0 | 13 | 0 |
| D | 0 | 13 | 0 |
| Mode SS | |||
|---|---|---|---|
| Quadrant | BADHDUFLAG | Total packets | Discarded packets |
| A | 0 | 142 | 0 |
| B | 0 | 142 | 0 |
| C | 0 | 142 | 0 |
| D | 0 | 142 | 0 |
| Quadrant | Total seconds | Saturated seconds | Saturation percentage |
|---|---|---|---|
| A | 6927 | 292 | 4.215389% |
| B | 6927 | 201 | 2.901689% |
| C | 6926 | 69 | 0.996246% |
| D | 6926 | 94 | 1.357205% |
Noise dominated data is calculated using 1-second bins in cleaned event files. If a bin has >2000 counts, and if more than 50% of those come from <1% of pixels, then it is considered to be noise-dominated and hence unusable.
| Quadrant | # 1 sec bins | Bins with >0 counts | Bins with >2000 counts | High rate bins dominated by noise | Noise dominated (total time) | Noise dominated (detector-on time) | Marked lightcurve |
|---|---|---|---|---|---|---|---|
| A | 7812 | 6928 | 210 | 210 | 2.69% | 3.03% |  |
| B | 7812 | 6928 | 63 | 63 | 0.81% | 0.91% |  |
| C | 7811 | 6927 | 3 | 3 | 0.04% | 0.04% |  |
| D | 7811 | 6927 | 56 | 56 | 0.72% | 0.81% | 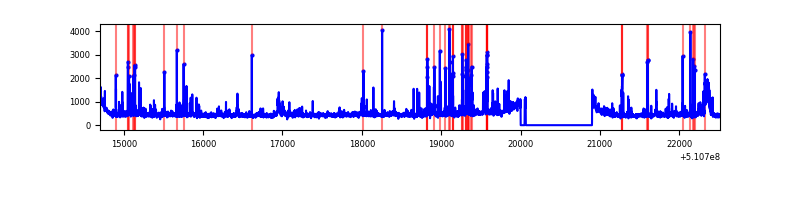 |
Top three noisy pixels from each quadrant. If the there are fewer than three noisy pixels in the level2.evt file, extra rows are filled as -1
| Pixel properties | Quadrant properties | ||||||
|---|---|---|---|---|---|---|---|
| Quadrant | DetID | PixID | Counts | Sigma | Mean | Median | Sigma |
| A | 7 | 64 | 1231138 | 6603.89 | 756 | 738 | 186.3 |
| A | 10 | 251 | 425405 | 2279.3 | 756 | 738 | 186.3 |
| A | 8 | 249 | 83040 | 441.74 | 756 | 738 | 186.3 |
| B | 0 | 213 | 395145 | 2394.56 | 760 | 732 | 164.7 |
| B | 4 | 206 | 178432 | 1078.85 | 760 | 732 | 164.7 |
| B | 4 | 171 | 87536 | 527.0 | 760 | 732 | 164.7 |
| C | 12 | 252 | 130369 | 633.44 | 755 | 748 | 204.6 |
| C | 13 | 3 | 23846 | 112.87 | 755 | 748 | 204.6 |
| C | 14 | 254 | 17939 | 84.01 | 755 | 748 | 204.6 |
| D | 2 | 249 | 306189 | 1467.02 | 743 | 709 | 208.2 |
| D | 3 | 12 | 289427 | 1386.52 | 743 | 709 | 208.2 |
| D | 5 | 173 | 51785 | 245.28 | 743 | 709 | 208.2 |
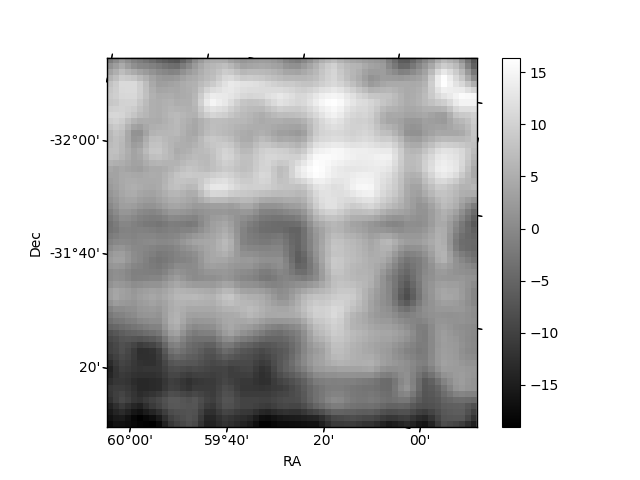
Histogram calculated using DETX and DETY for each event in the final _common_clean file
| Quadrant A |  |
 |
Quadrant B |
|---|---|---|---|
| Quadrant D | 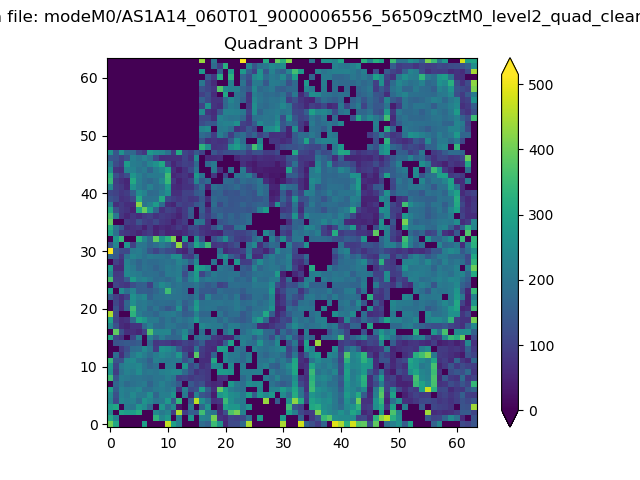 |
 |
Quadrant C |
| Plot type | Count rate plots | Images |
|---|---|---|
| Comparison with Poisson distribution Blue bars denote a histogram of data divided into 1 sec bins. Red curve is a Poisson curve with rate = median count rate of data. |
 |
 |
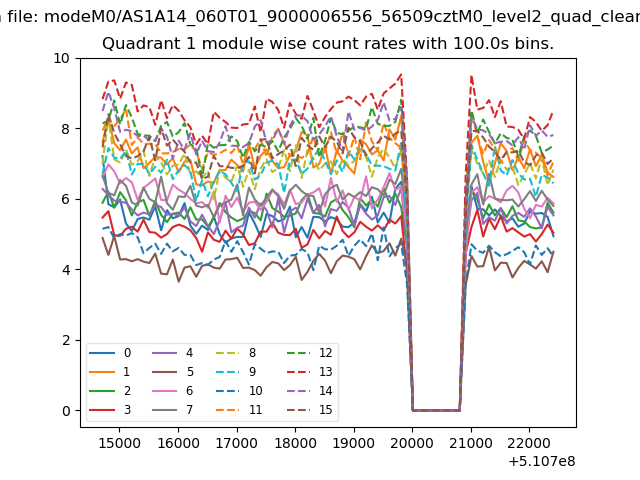
| Quadrant-wise count rates Data is divided into 100 sec bins |
 |
|
| Module-wise count rates for Quadrant A Data is divided into 100 sec bins |
 |
 |
| Module-wise count rates for Quadrant B Data is divided into 100 sec bins |
 |
 |
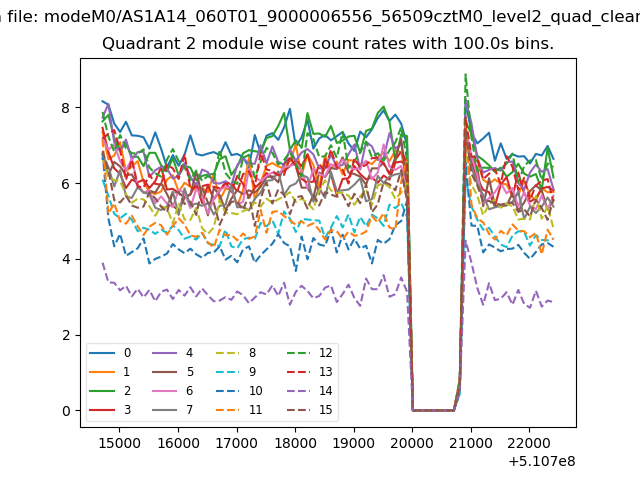
| Module-wise count rates for Quadrant C Data is divided into 100 sec bins |
 |
 |
| Module-wise count rates for Quadrant D Data is divided into 100 sec bins |
 |
 |
| Parameter | Plot |
|---|---|
| CZT HV Monitor |  |
| D_VDD |  |
| Temperature 1 | 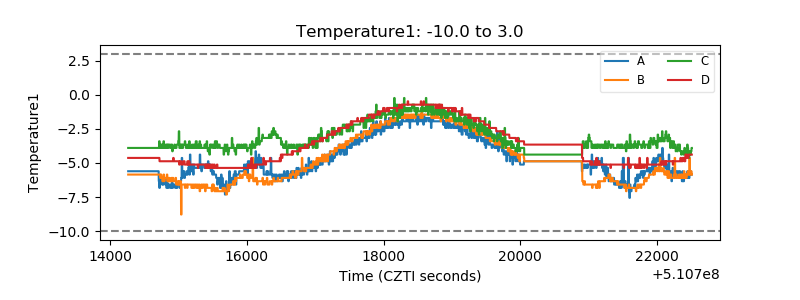 |
| Veto HV Monitor | 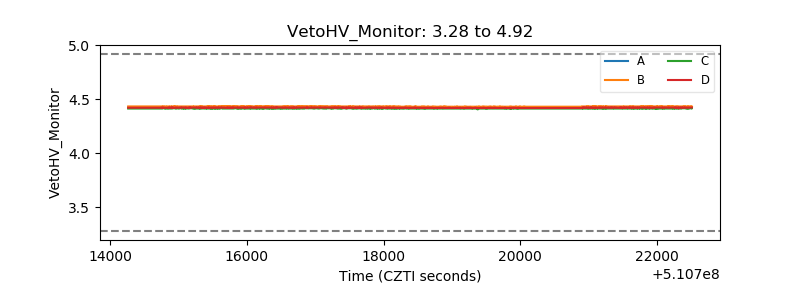 |
| Veto LLD |  |
| Alpha Counter |  |
| _CPM_Rate |  |
| CZT Counter | 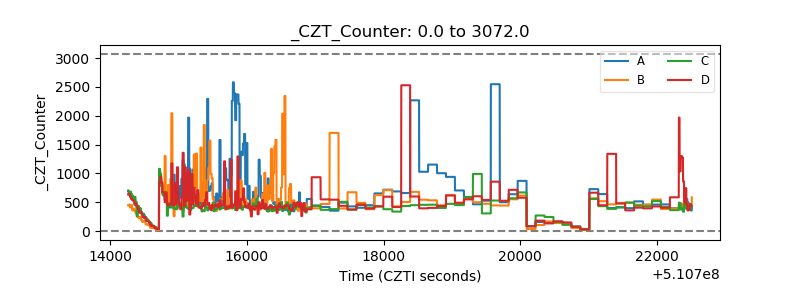 |
| +2.5 Volts monitor | 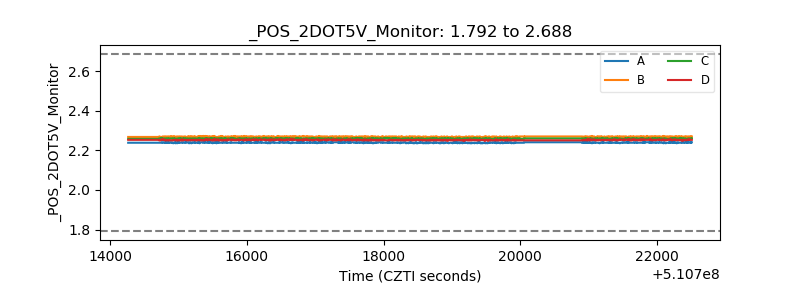 |
| +5 Volts monitor | 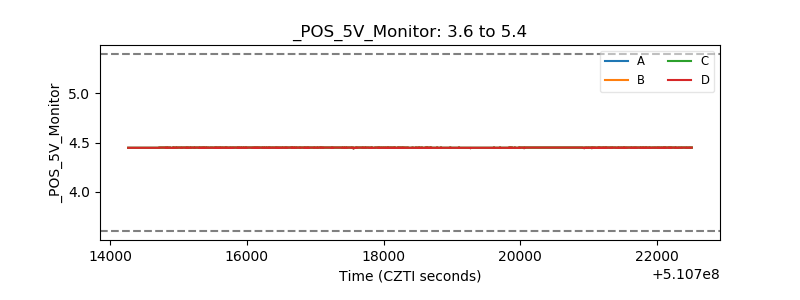 |
| _ROLL_ROT | 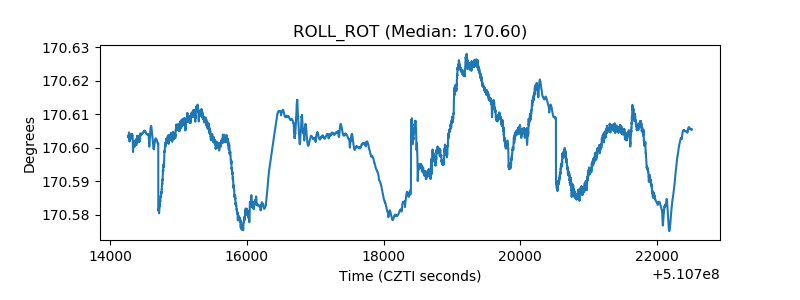 |
| _Roll_DEC | 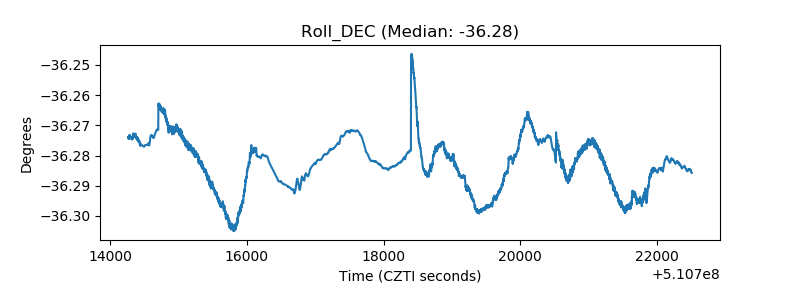 |
| _Roll_RA |  |
| Veto Counter | 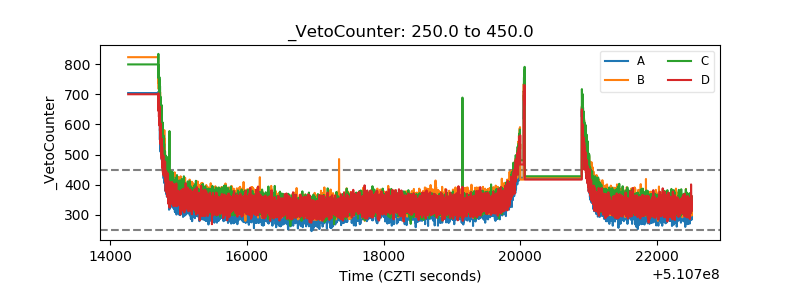 |