| Param | Original file | Final file |
|---|---|---|
| Filename | modeM0/AS1A14_060T01_9000006556_56510cztM0_level2.fits | modeM0/AS1A14_060T01_9000006556_56510cztM0_level2_quad_clean.evt |
| Size (bytes) | 514,065,600 | 111,254,400 |
| Size | 490.3 MB | 106.1 MB |
| Events in quadrant A | 4,475,864 | 719,073 |
| Events in quadrant B | 5,539,773 | 743,973 |
| Events in quadrant C | 3,777,056 | 709,390 |
| Events in quadrant D | 4,625,302 | 649,174 |
| Mode M0 | |||
|---|---|---|---|
| Quadrant | BADHDUFLAG | Total packets | Discarded packets |
| A | 0 | 18785 | 4 |
| B | 0 | 21803 | 4 |
| C | 0 | 17030 | 4 |
| D | 0 | 19125 | 4 |
| Mode M9 | |||
|---|---|---|---|
| Quadrant | BADHDUFLAG | Total packets | Discarded packets |
| A | 0 | 11 | 0 |
| B | 0 | 11 | 0 |
| C | 0 | 11 | 0 |
| D | 0 | 11 | 0 |
| Mode SS | |||
|---|---|---|---|
| Quadrant | BADHDUFLAG | Total packets | Discarded packets |
| A | 0 | 166 | 0 |
| B | 0 | 166 | 0 |
| C | 0 | 166 | 0 |
| D | 0 | 166 | 0 |
| Quadrant | Total seconds | Saturated seconds | Saturation percentage |
|---|---|---|---|
| A | 7857 | 347 | 4.416444% |
| B | 7857 | 765 | 9.736541% |
| C | 7858 | 191 | 2.430644% |
| D | 7858 | 302 | 3.843217% |
Noise dominated data is calculated using 1-second bins in cleaned event files. If a bin has >2000 counts, and if more than 50% of those come from <1% of pixels, then it is considered to be noise-dominated and hence unusable.
| Quadrant | # 1 sec bins | Bins with >0 counts | Bins with >2000 counts | High rate bins dominated by noise | Noise dominated (total time) | Noise dominated (detector-on time) | Marked lightcurve |
|---|---|---|---|---|---|---|---|
| A | 9062 | 7859 | 121 | 121 | 1.34% | 1.54% | 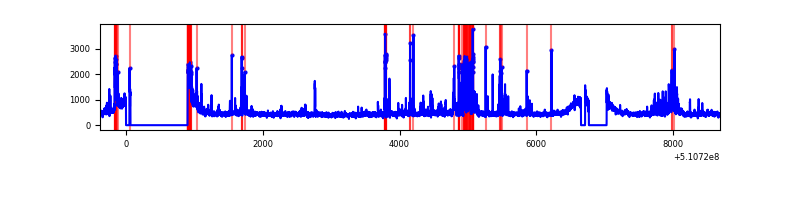 |
| B | 9062 | 7859 | 272 | 272 | 3.00% | 3.46% |  |
| C | 9063 | 7860 | 9 | 9 | 0.10% | 0.11% |  |
| D | 9063 | 7860 | 110 | 110 | 1.21% | 1.40% |  |
Top three noisy pixels from each quadrant. If the there are fewer than three noisy pixels in the level2.evt file, extra rows are filled as -1
| Pixel properties | Quadrant properties | ||||||
|---|---|---|---|---|---|---|---|
| Quadrant | DetID | PixID | Counts | Sigma | Mean | Median | Sigma |
| A | 7 | 64 | 284987 | 1291.62 | 888 | 865 | 220.0 |
| A | 8 | 206 | 280573 | 1271.55 | 888 | 865 | 220.0 |
| A | 4 | 95 | 125787 | 567.9 | 888 | 865 | 220.0 |
| B | 4 | 206 | 990236 | 5249.67 | 867 | 831 | 188.5 |
| B | 0 | 213 | 410896 | 2175.76 | 867 | 831 | 188.5 |
| B | 4 | 171 | 164759 | 869.78 | 867 | 831 | 188.5 |
| C | 12 | 252 | 151761 | 629.26 | 882 | 873 | 239.8 |
| C | 13 | 3 | 58813 | 241.63 | 882 | 873 | 239.8 |
| C | 11 | 244 | 22350 | 89.57 | 882 | 873 | 239.8 |
| D | 3 | 12 | 399209 | 1643.83 | 867 | 827 | 242.4 |
| D | 2 | 249 | 214543 | 881.85 | 867 | 827 | 242.4 |
| D | 8 | 160 | 115662 | 473.84 | 867 | 827 | 242.4 |
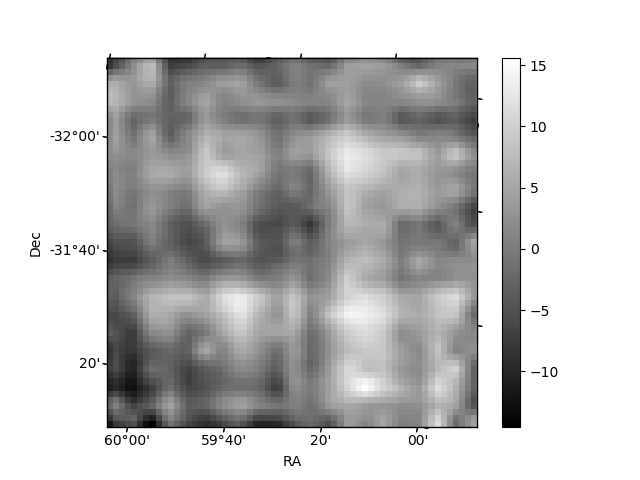
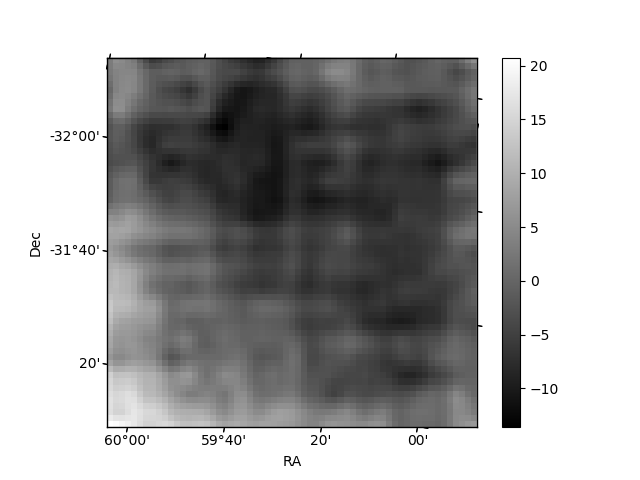
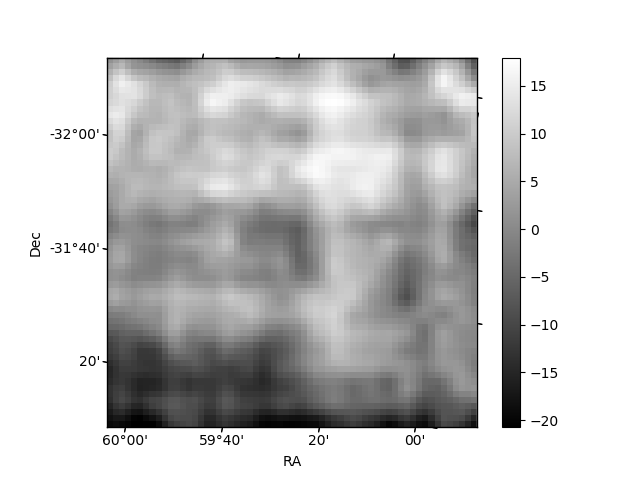
Histogram calculated using DETX and DETY for each event in the final _common_clean file
| Quadrant A | 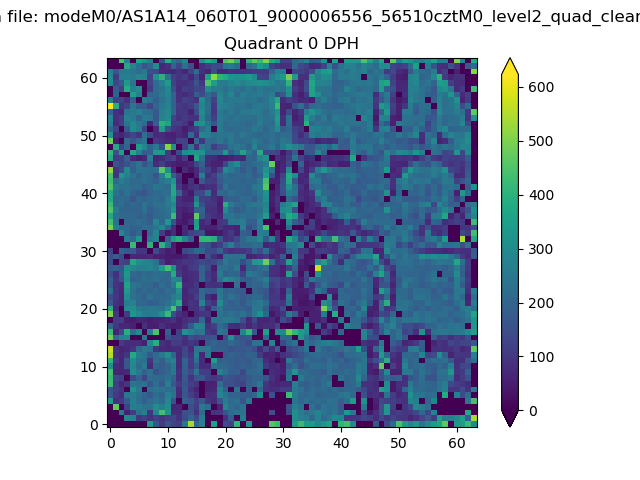 |
 |
Quadrant B |
|---|---|---|---|
| Quadrant D | 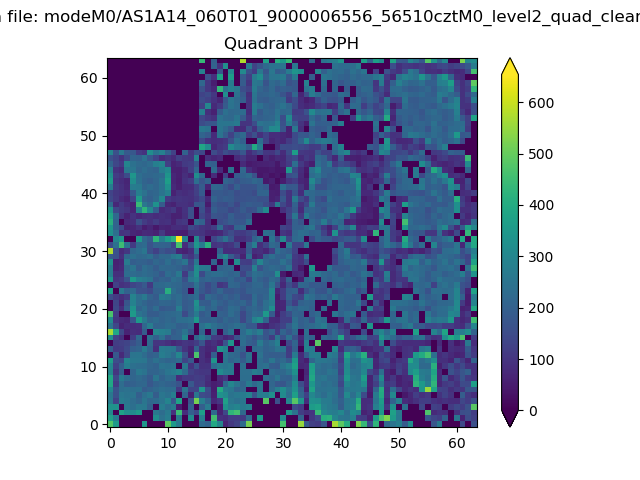 |
 |
Quadrant C |
| Plot type | Count rate plots | Images |
|---|---|---|
| Comparison with Poisson distribution Blue bars denote a histogram of data divided into 1 sec bins. Red curve is a Poisson curve with rate = median count rate of data. |
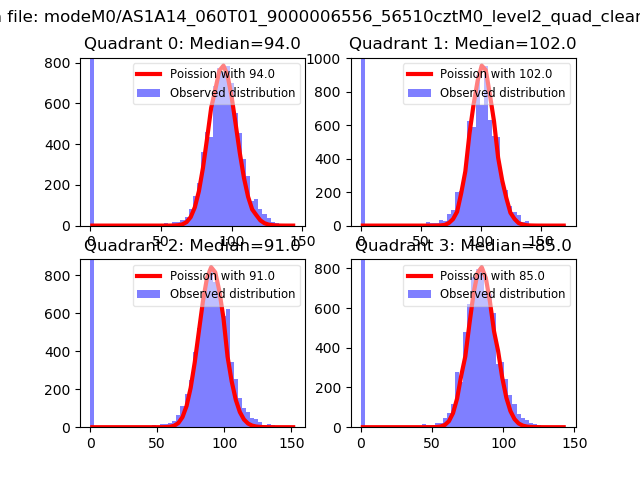 |
 |
| Quadrant-wise count rates Data is divided into 100 sec bins |
 |
|
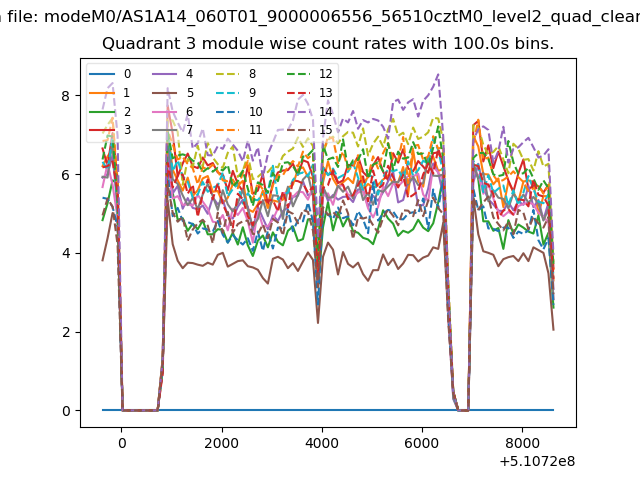
| Module-wise count rates for Quadrant A Data is divided into 100 sec bins |
 |
 |
| Module-wise count rates for Quadrant B Data is divided into 100 sec bins |
 |
 |
| Module-wise count rates for Quadrant C Data is divided into 100 sec bins |
 |
 |
| Module-wise count rates for Quadrant D Data is divided into 100 sec bins |
 |
 |
| Parameter | Plot |
|---|---|
| CZT HV Monitor | 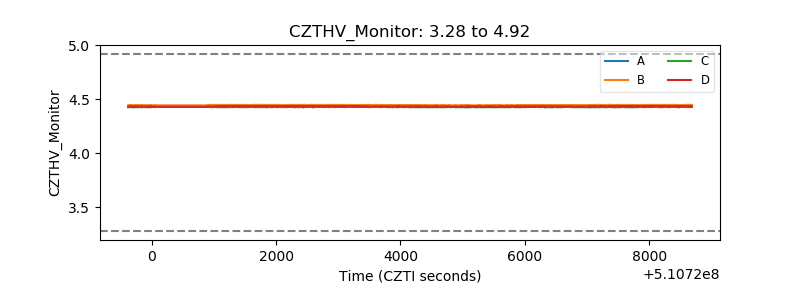 |
| D_VDD |  |
| Temperature 1 | 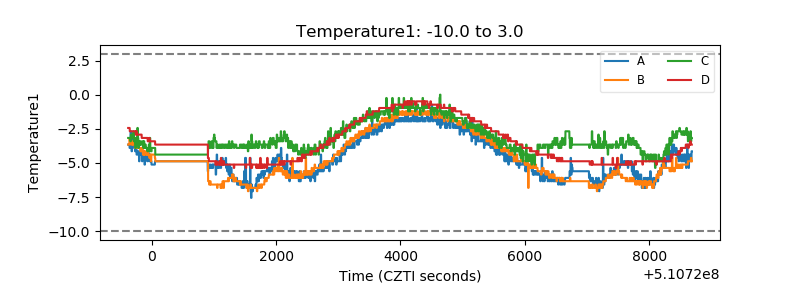 |
| Veto HV Monitor | 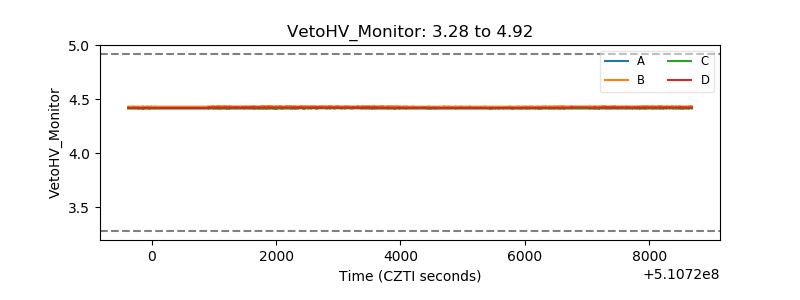 |
| Veto LLD |  |
| Alpha Counter |  |
| _CPM_Rate |  |
| CZT Counter | 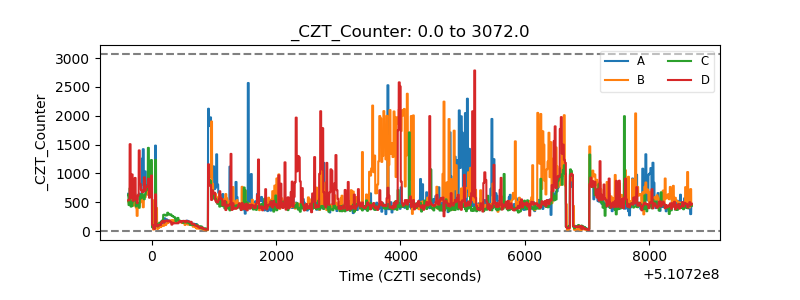 |
| +2.5 Volts monitor | 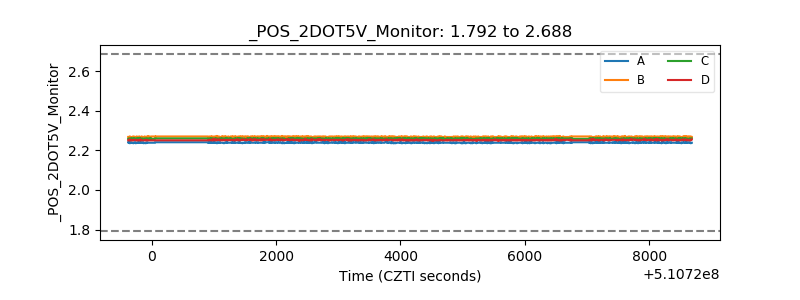 |
| +5 Volts monitor | 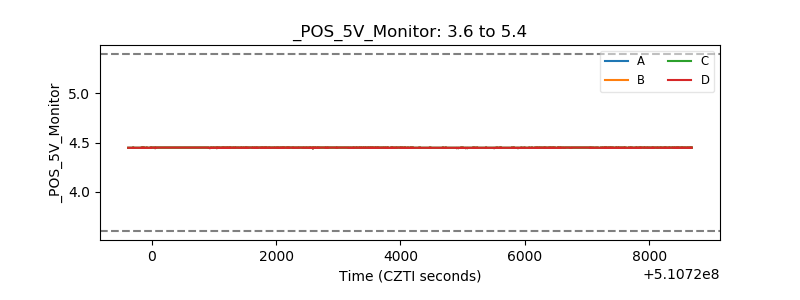 |
| _ROLL_ROT | 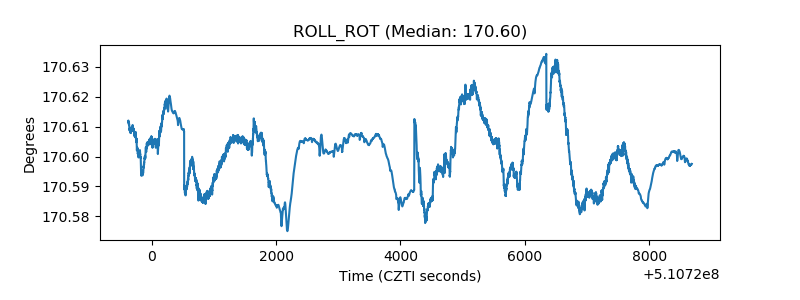 |
| _Roll_DEC |  |
| _Roll_RA | 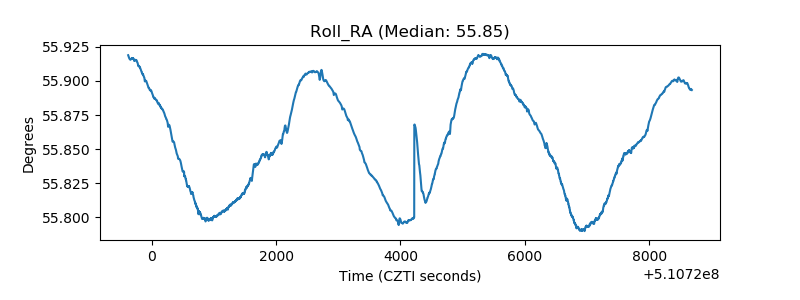 |
| Veto Counter | 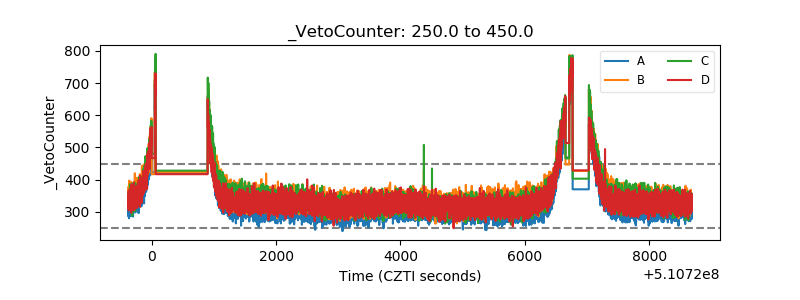 |