| Param | Original file | Final file |
|---|---|---|
| Filename | modeM0/AS1A14_060T01_9000006556_56511cztM0_level2.fits | modeM0/AS1A14_060T01_9000006556_56511cztM0_level2_quad_clean.evt |
| Size (bytes) | 528,563,520 | 112,720,320 |
| Size | 504.1 MB | 107.5 MB |
| Events in quadrant A | 4,344,895 | 734,536 |
| Events in quadrant B | 5,740,817 | 766,290 |
| Events in quadrant C | 4,143,442 | 705,538 |
| Events in quadrant D | 4,721,876 | 656,513 |
| Mode M0 | |||
|---|---|---|---|
| Quadrant | BADHDUFLAG | Total packets | Discarded packets |
| A | 0 | 18311 | 1 |
| B | 0 | 22456 | 1 |
| C | 0 | 18023 | 1 |
| D | 0 | 19550 | 1 |
| Mode M9 | |||
|---|---|---|---|
| Quadrant | BADHDUFLAG | Total packets | Discarded packets |
| A | 0 | 1 | 0 |
| B | 0 | 2 | 0 |
| C | 0 | 2 | 0 |
| D | 0 | 2 | 0 |
| Mode SS | |||
|---|---|---|---|
| Quadrant | BADHDUFLAG | Total packets | Discarded packets |
| A | 0 | 158 | 0 |
| B | 0 | 160 | 0 |
| C | 0 | 160 | 0 |
| D | 0 | 160 | 0 |
| Quadrant | Total seconds | Saturated seconds | Saturation percentage |
|---|---|---|---|
| A | 7914 | 115 | 1.453121% |
| B | 7914 | 560 | 7.076068% |
| C | 7914 | 185 | 2.337630% |
| D | 7914 | 182 | 2.299722% |
Noise dominated data is calculated using 1-second bins in cleaned event files. If a bin has >2000 counts, and if more than 50% of those come from <1% of pixels, then it is considered to be noise-dominated and hence unusable.
| Quadrant | # 1 sec bins | Bins with >0 counts | Bins with >2000 counts | High rate bins dominated by noise | Noise dominated (total time) | Noise dominated (detector-on time) | Marked lightcurve |
|---|---|---|---|---|---|---|---|
| A | 7914 | 7914 | 64 | 64 | 0.81% | 0.81% |  |
| B | 7914 | 7914 | 265 | 265 | 3.35% | 3.35% |  |
| C | 7914 | 7914 | 111 | 111 | 1.40% | 1.40% |  |
| D | 7914 | 7914 | 154 | 154 | 1.95% | 1.95% |  |
Top three noisy pixels from each quadrant. If the there are fewer than three noisy pixels in the level2.evt file, extra rows are filled as -1
| Pixel properties | Quadrant properties | ||||||
|---|---|---|---|---|---|---|---|
| Quadrant | DetID | PixID | Counts | Sigma | Mean | Median | Sigma |
| A | 4 | 249 | 240806 | 1117.2 | 870 | 847 | 214.8 |
| A | 7 | 64 | 177770 | 823.72 | 870 | 847 | 214.8 |
| A | 3 | 14 | 162214 | 751.29 | 870 | 847 | 214.8 |
| B | 4 | 206 | 1019132 | 5552.74 | 853 | 821 | 183.4 |
| B | 0 | 213 | 438759 | 2388.03 | 853 | 821 | 183.4 |
| B | 3 | 145 | 317369 | 1726.1 | 853 | 821 | 183.4 |
| C | 6 | 223 | 458856 | 1980.94 | 851 | 842 | 231.2 |
| C | 12 | 252 | 127758 | 548.92 | 851 | 842 | 231.2 |
| C | 13 | 3 | 96842 | 415.2 | 851 | 842 | 231.2 |
| D | 11 | 129 | 412524 | 1741.85 | 839 | 802 | 236.4 |
| D | 11 | 176 | 352631 | 1488.47 | 839 | 802 | 236.4 |
| D | 2 | 249 | 196805 | 829.22 | 839 | 802 | 236.4 |
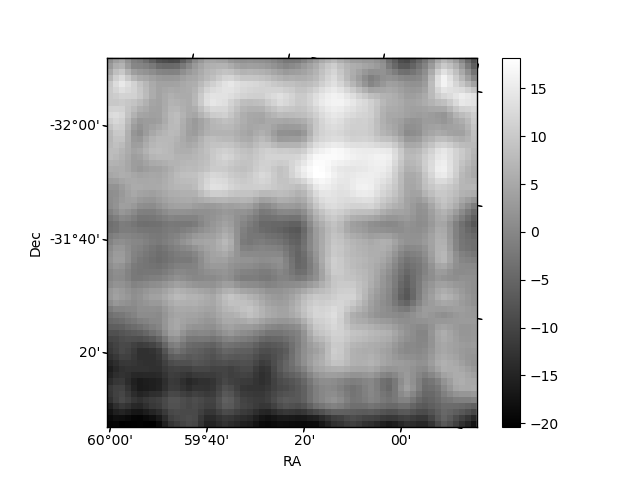
Histogram calculated using DETX and DETY for each event in the final _common_clean file
| Quadrant A |  |
 |
Quadrant B |
|---|---|---|---|
| Quadrant D | 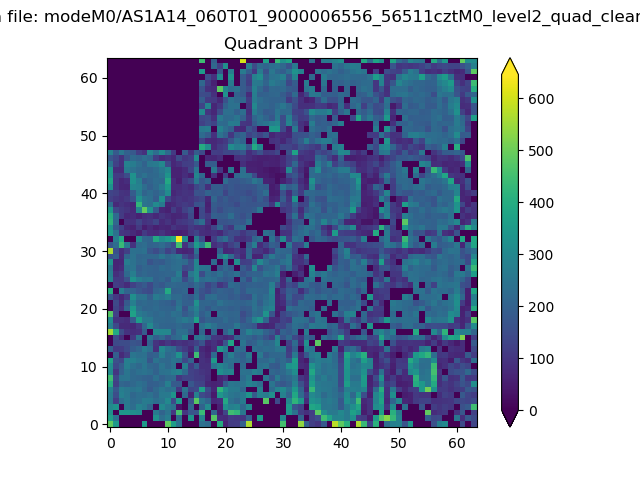 |
 |
Quadrant C |
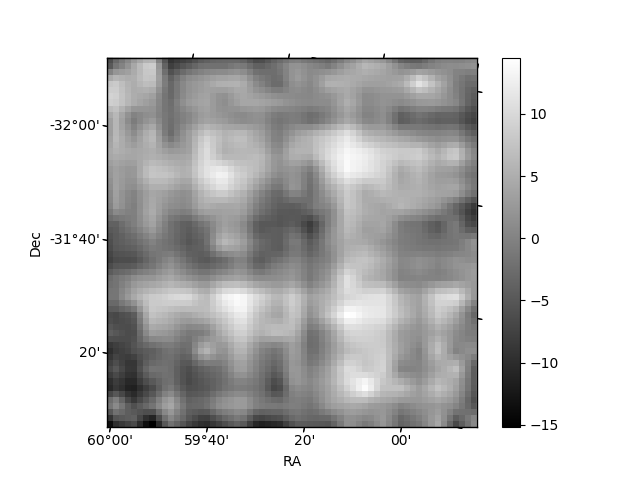
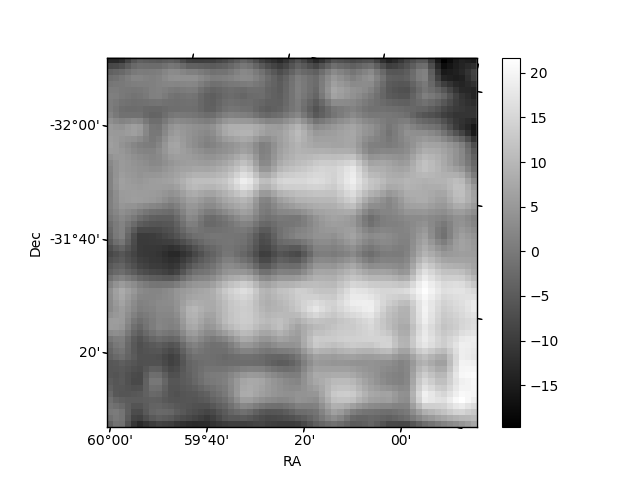
| Plot type | Count rate plots | Images |
|---|---|---|
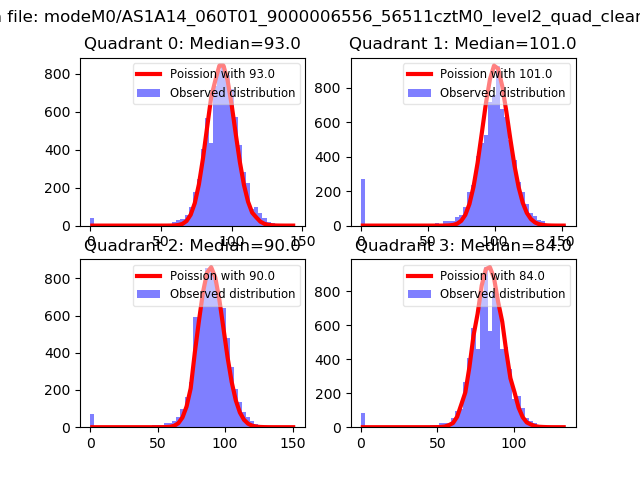
| Comparison with Poisson distribution Blue bars denote a histogram of data divided into 1 sec bins. Red curve is a Poisson curve with rate = median count rate of data. |
 |
 |
| Quadrant-wise count rates Data is divided into 100 sec bins |
 |
|
| Module-wise count rates for Quadrant A Data is divided into 100 sec bins |
 |
 |
| Module-wise count rates for Quadrant B Data is divided into 100 sec bins |
 |
 |
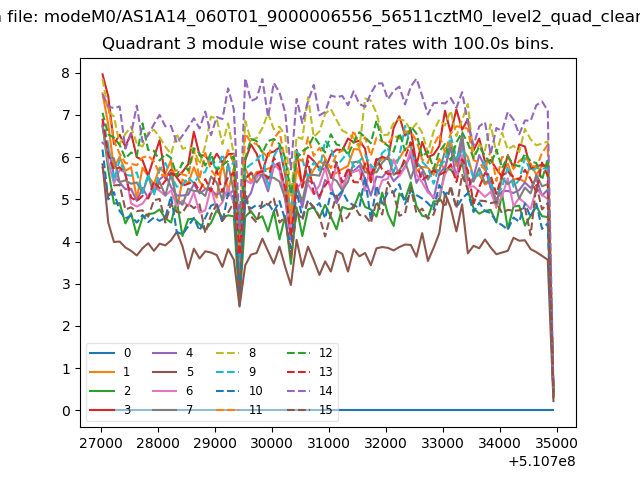
| Module-wise count rates for Quadrant C Data is divided into 100 sec bins |
 |
 |
| Module-wise count rates for Quadrant D Data is divided into 100 sec bins |
 |
 |
| Parameter | Plot |
|---|---|
| CZT HV Monitor | 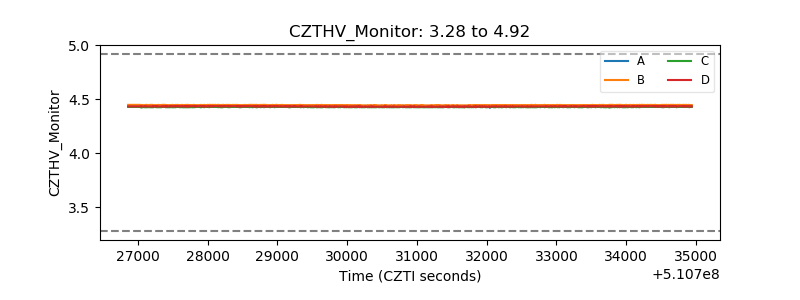 |
| D_VDD |  |
| Temperature 1 | 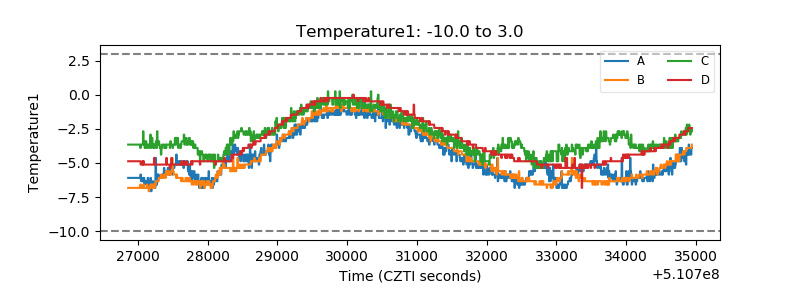 |
| Veto HV Monitor | 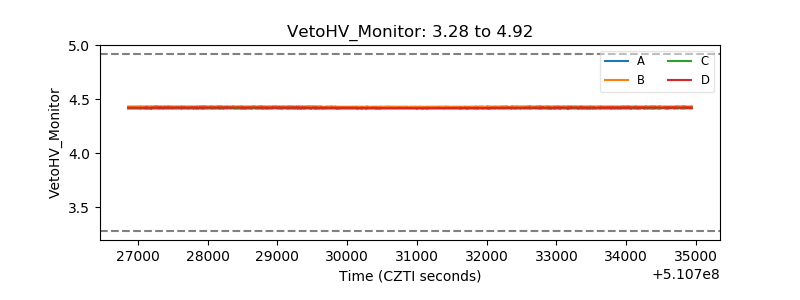 |
| Veto LLD |  |
| Alpha Counter |  |
| _CPM_Rate | 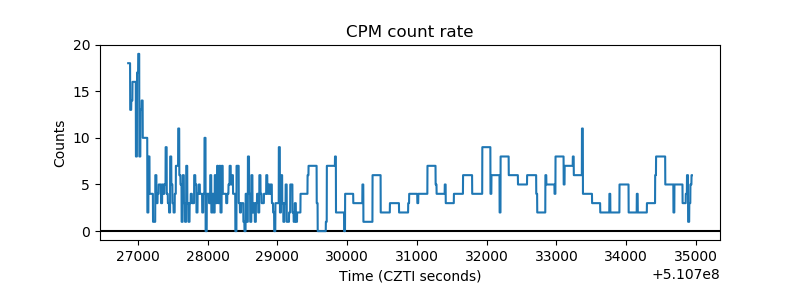 |
| CZT Counter | 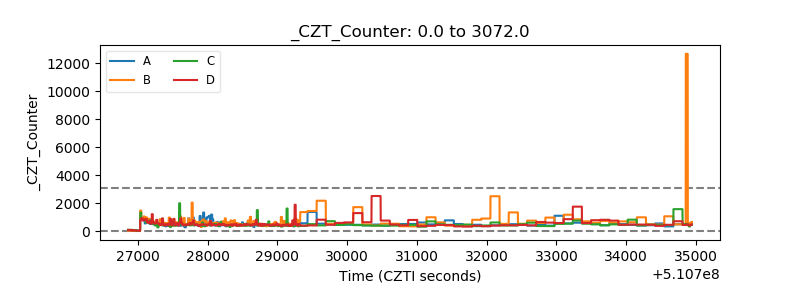 |
| +2.5 Volts monitor | 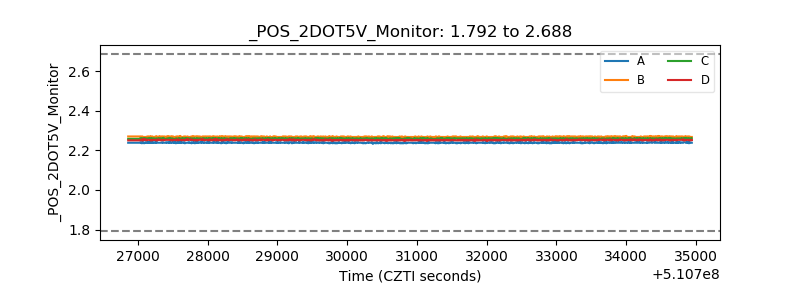 |
| +5 Volts monitor | 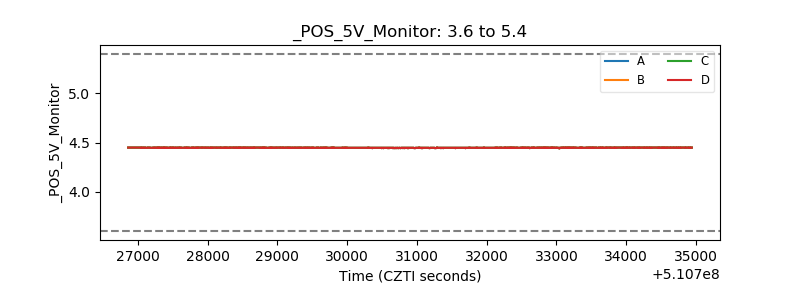 |
| _ROLL_ROT | 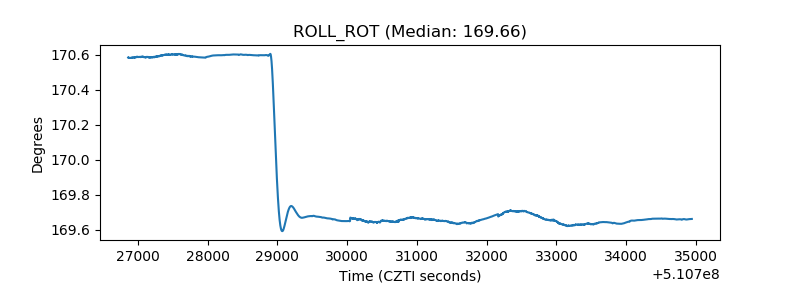 |
| _Roll_DEC | 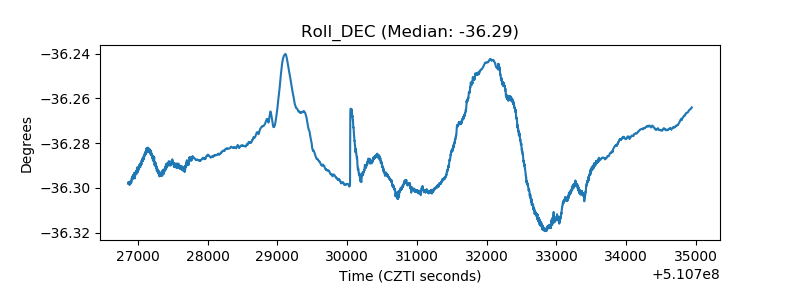 |
| _Roll_RA |  |
| Veto Counter | 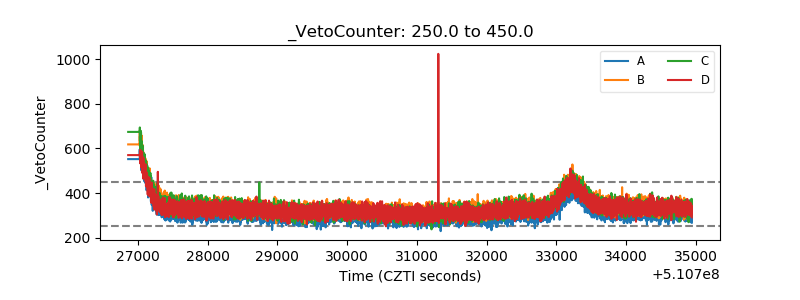 |