| Param | Original file | Final file |
|---|---|---|
| Filename | modeM0/AS1A14_060T01_9000006556_56512cztM0_level2.fits | modeM0/AS1A14_060T01_9000006556_56512cztM0_level2_quad_clean.evt |
| Size (bytes) | 568,690,560 | 107,280,000 |
| Size | 542.3 MB | 102.3 MB |
| Events in quadrant A | 4,302,836 | 713,501 |
| Events in quadrant B | 4,825,273 | 766,051 |
| Events in quadrant C | 7,057,026 | 588,989 |
| Events in quadrant D | 4,265,791 | 641,888 |
| Mode M0 | |||
|---|---|---|---|
| Quadrant | BADHDUFLAG | Total packets | Discarded packets |
| A | 0 | 17979 | 0 |
| B | 0 | 19519 | 1 |
| C | 0 | 26397 | 0 |
| D | 0 | 18094 | 0 |
| Mode SS | |||
|---|---|---|---|
| Quadrant | BADHDUFLAG | Total packets | Discarded packets |
| A | 0 | 156 | 0 |
| B | 0 | 156 | 0 |
| C | 0 | 156 | 0 |
| D | 0 | 156 | 0 |
| Quadrant | Total seconds | Saturated seconds | Saturation percentage |
|---|---|---|---|
| A | 7729 | 85 | 1.099754% |
| B | 7728 | 282 | 3.649068% |
| C | 7728 | 1330 | 17.210145% |
| D | 7728 | 149 | 1.928054% |
Noise dominated data is calculated using 1-second bins in cleaned event files. If a bin has >2000 counts, and if more than 50% of those come from <1% of pixels, then it is considered to be noise-dominated and hence unusable.
| Quadrant | # 1 sec bins | Bins with >0 counts | Bins with >2000 counts | High rate bins dominated by noise | Noise dominated (total time) | Noise dominated (detector-on time) | Marked lightcurve |
|---|---|---|---|---|---|---|---|
| A | 7729 | 7729 | 82 | 82 | 1.06% | 1.06% |  |
| B | 7728 | 7728 | 153 | 153 | 1.98% | 1.98% |  |
| C | 7728 | 7728 | 1249 | 1249 | 16.16% | 16.16% |  |
| D | 7728 | 7728 | 135 | 135 | 1.75% | 1.75% |  |
Top three noisy pixels from each quadrant. If the there are fewer than three noisy pixels in the level2.evt file, extra rows are filled as -1
| Pixel properties | Quadrant properties | ||||||
|---|---|---|---|---|---|---|---|
| Quadrant | DetID | PixID | Counts | Sigma | Mean | Median | Sigma |
| A | 7 | 64 | 412409 | 2011.28 | 832 | 812 | 204.6 |
| A | 4 | 249 | 148869 | 723.48 | 832 | 812 | 204.6 |
| A | 8 | 206 | 133782 | 649.76 | 832 | 812 | 204.6 |
| B | 4 | 206 | 864039 | 4842.11 | 824 | 793 | 178.3 |
| B | 0 | 213 | 345159 | 1931.61 | 824 | 793 | 178.3 |
| B | 3 | 145 | 115990 | 646.16 | 824 | 793 | 178.3 |
| C | 15 | 230 | 2885612 | 14170.23 | 746 | 738 | 203.6 |
| C | 6 | 223 | 967610 | 4749.18 | 746 | 738 | 203.6 |
| C | 13 | 3 | 128055 | 625.37 | 746 | 738 | 203.6 |
| D | 2 | 249 | 295986 | 1291.37 | 805 | 770 | 228.6 |
| D | 5 | 32 | 238916 | 1041.73 | 805 | 770 | 228.6 |
| D | 3 | 12 | 165757 | 721.71 | 805 | 770 | 228.6 |
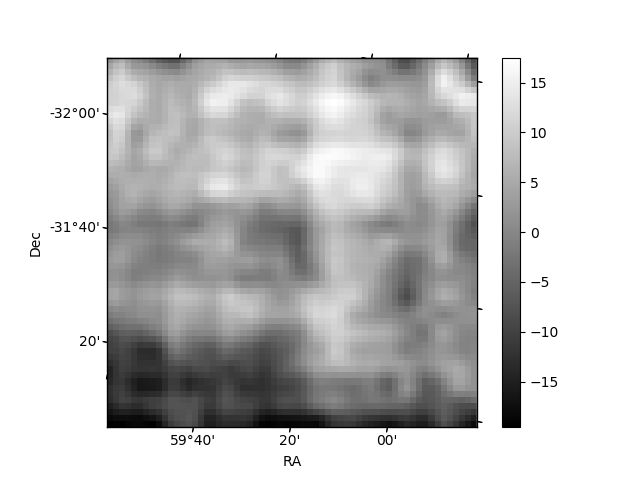
Histogram calculated using DETX and DETY for each event in the final _common_clean file
| Quadrant A |  |
 |
Quadrant B |
|---|---|---|---|
| Quadrant D | 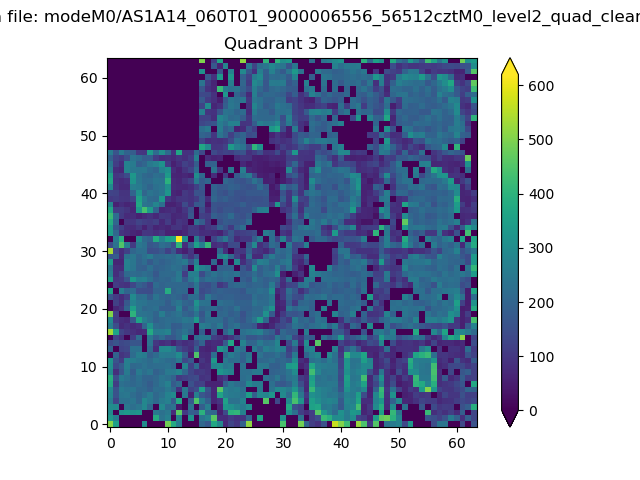 |
 |
Quadrant C |
| Plot type | Count rate plots | Images |
|---|---|---|
| Comparison with Poisson distribution Blue bars denote a histogram of data divided into 1 sec bins. Red curve is a Poisson curve with rate = median count rate of data. |
 |
 |
| Quadrant-wise count rates Data is divided into 100 sec bins |
 |
|
| Module-wise count rates for Quadrant A Data is divided into 100 sec bins |
 |
 |
| Module-wise count rates for Quadrant B Data is divided into 100 sec bins |
 |
 |
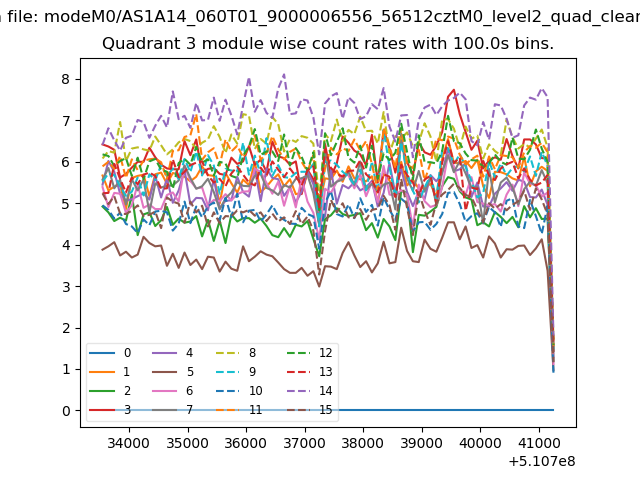
| Module-wise count rates for Quadrant C Data is divided into 100 sec bins |
 |
 |
| Module-wise count rates for Quadrant D Data is divided into 100 sec bins |
 |
 |
| Parameter | Plot |
|---|---|
| CZT HV Monitor | 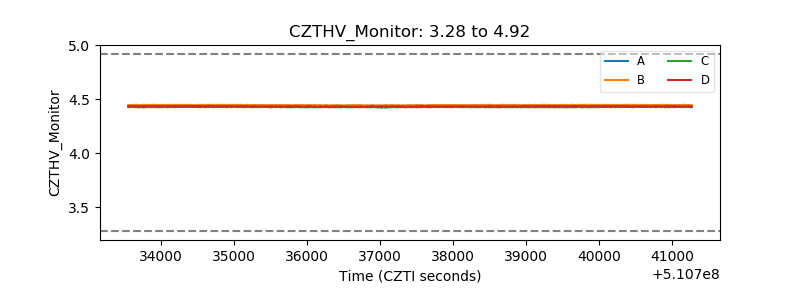 |
| D_VDD |  |
| Temperature 1 | 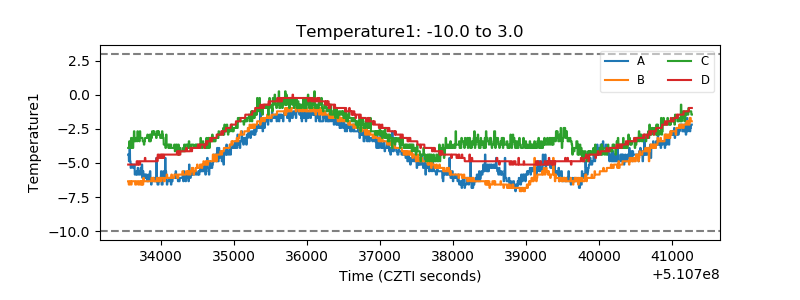 |
| Veto HV Monitor | 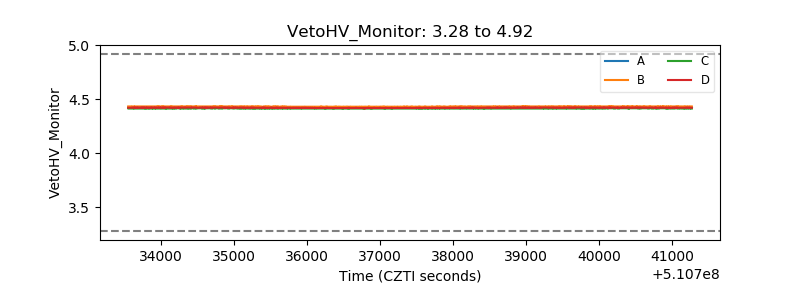 |
| Veto LLD |  |
| Alpha Counter |  |
| _CPM_Rate | 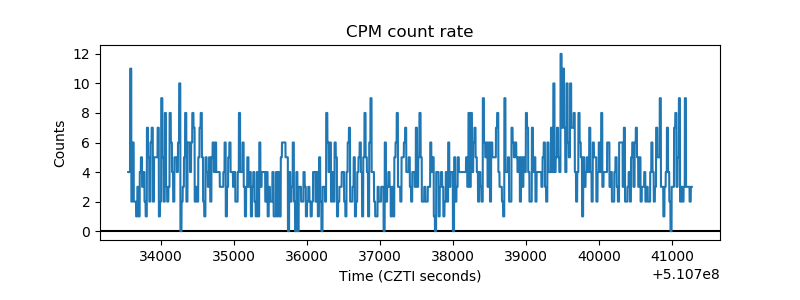 |
| CZT Counter | 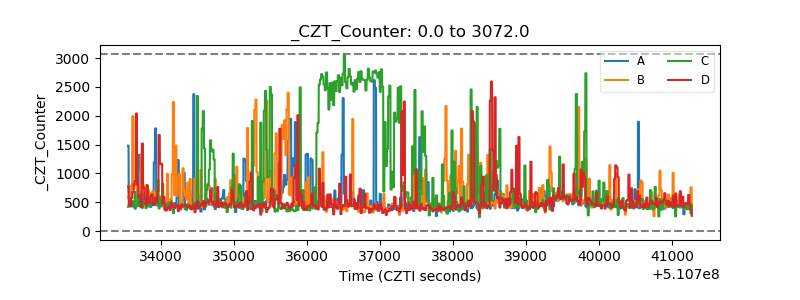 |
| +2.5 Volts monitor | 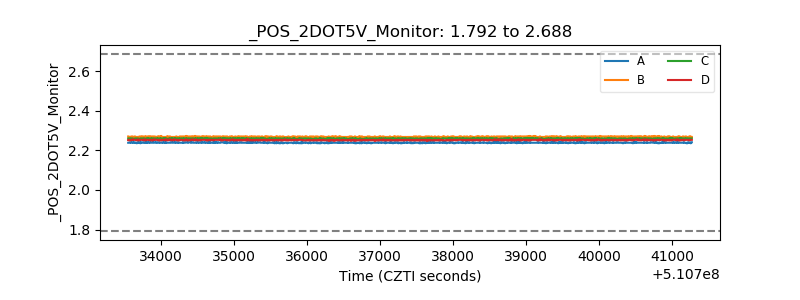 |
| +5 Volts monitor | 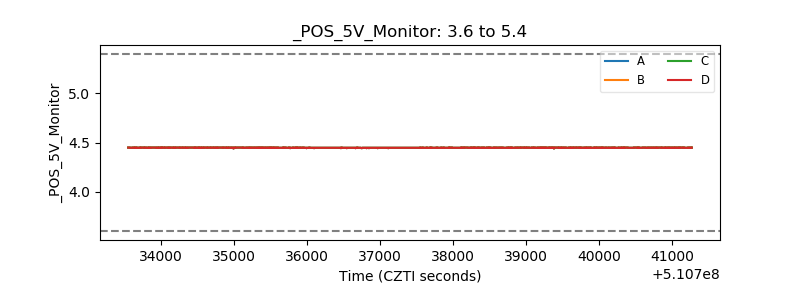 |
| _ROLL_ROT | 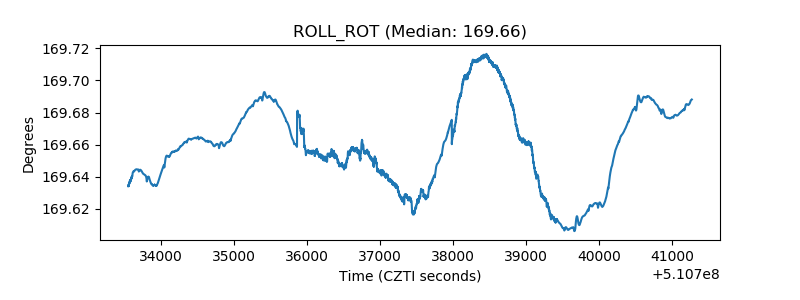 |
| _Roll_DEC | 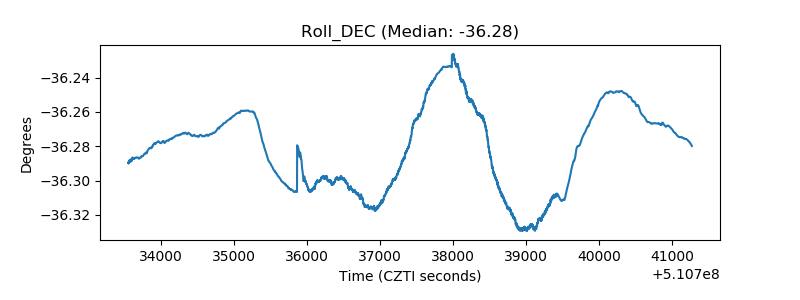 |
| _Roll_RA |  |
| Veto Counter | 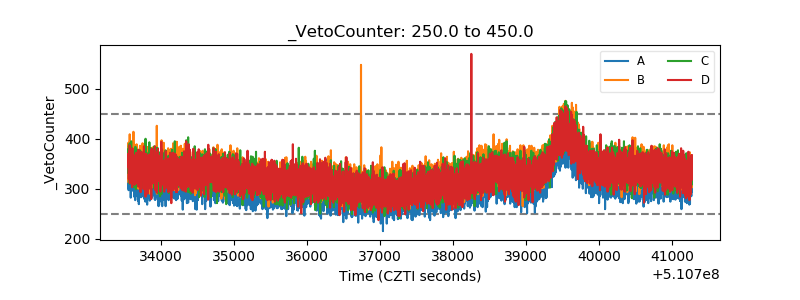 |