| Param | Original file | Final file |
|---|---|---|
| Filename | modeM0/AS1A14_060T01_9000006556_56516cztM0_level2.fits | modeM0/AS1A14_060T01_9000006556_56516cztM0_level2_quad_clean.evt |
| Size (bytes) | 559,442,880 | 91,699,200 |
| Size | 533.5 MB | 87.5 MB |
| Events in quadrant A | 5,395,138 | 585,852 |
| Events in quadrant B | 3,594,300 | 669,564 |
| Events in quadrant C | 6,051,023 | 519,235 |
| Events in quadrant D | 5,147,947 | 534,408 |
| Mode M0 | |||
|---|---|---|---|
| Quadrant | BADHDUFLAG | Total packets | Discarded packets |
| A | 0 | 20557 | 1 |
| B | 0 | 15176 | 1 |
| C | 0 | 22808 | 1 |
| D | 0 | 19964 | 1 |
| Mode M9 | |||
|---|---|---|---|
| Quadrant | BADHDUFLAG | Total packets | Discarded packets |
| A | 0 | 8 | 0 |
| B | 0 | 8 | 0 |
| C | 0 | 8 | 0 |
| D | 0 | 8 | 0 |
| Mode SS | |||
|---|---|---|---|
| Quadrant | BADHDUFLAG | Total packets | Discarded packets |
| A | 0 | 136 | 0 |
| B | 0 | 136 | 0 |
| C | 0 | 136 | 0 |
| D | 0 | 136 | 0 |
| Quadrant | Total seconds | Saturated seconds | Saturation percentage |
|---|---|---|---|
| A | 6702 | 490 | 7.311250% |
| B | 6703 | 105 | 1.566463% |
| C | 6702 | 1028 | 15.338705% |
| D | 6702 | 517 | 7.714115% |
Noise dominated data is calculated using 1-second bins in cleaned event files. If a bin has >2000 counts, and if more than 50% of those come from <1% of pixels, then it is considered to be noise-dominated and hence unusable.
| Quadrant | # 1 sec bins | Bins with >0 counts | Bins with >2000 counts | High rate bins dominated by noise | Noise dominated (total time) | Noise dominated (detector-on time) | Marked lightcurve |
|---|---|---|---|---|---|---|---|
| A | 7487 | 6702 | 417 | 417 | 5.57% | 6.22% | 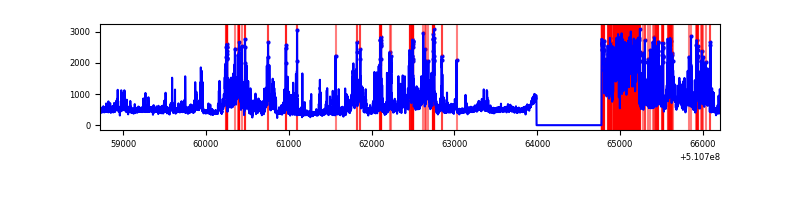 |
| B | 7488 | 6703 | 30 | 30 | 0.40% | 0.45% |  |
| C | 7487 | 6703 | 1026 | 1026 | 13.70% | 15.31% |  |
| D | 7487 | 6703 | 458 | 458 | 6.12% | 6.83% |  |
Top three noisy pixels from each quadrant. If the there are fewer than three noisy pixels in the level2.evt file, extra rows are filled as -1
| Pixel properties | Quadrant properties | ||||||
|---|---|---|---|---|---|---|---|
| Quadrant | DetID | PixID | Counts | Sigma | Mean | Median | Sigma |
| A | 7 | 64 | 1762868 | 10001.18 | 706 | 686 | 176.2 |
| A | 12 | 3 | 307668 | 1742.26 | 706 | 686 | 176.2 |
| A | 4 | 95 | 192477 | 1088.5 | 706 | 686 | 176.2 |
| B | 4 | 206 | 290020 | 1871.57 | 717 | 691 | 154.6 |
| B | 4 | 21 | 98862 | 635.03 | 717 | 691 | 154.6 |
| B | 3 | 145 | 89733 | 575.98 | 717 | 691 | 154.6 |
| C | 15 | 230 | 3019140 | 16889.7 | 648 | 642 | 178.7 |
| C | 13 | 3 | 209639 | 1169.42 | 648 | 642 | 178.7 |
| C | 12 | 252 | 102263 | 568.61 | 648 | 642 | 178.7 |
| D | 2 | 249 | 1057782 | 5482.06 | 674 | 643 | 192.8 |
| D | 7 | 96 | 360304 | 1865.11 | 674 | 643 | 192.8 |
| D | 8 | 129 | 342897 | 1774.84 | 674 | 643 | 192.8 |
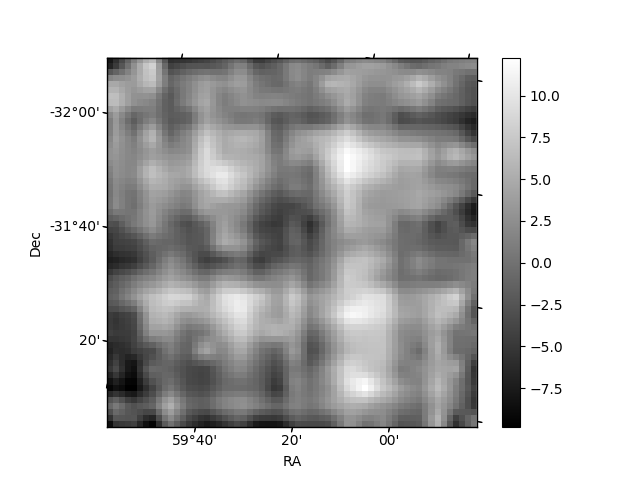
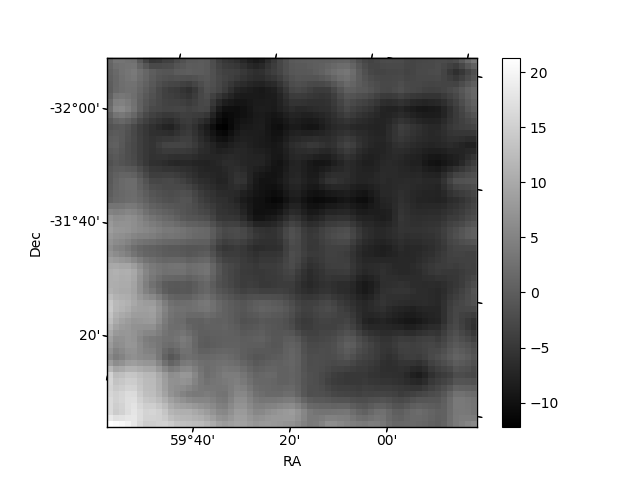
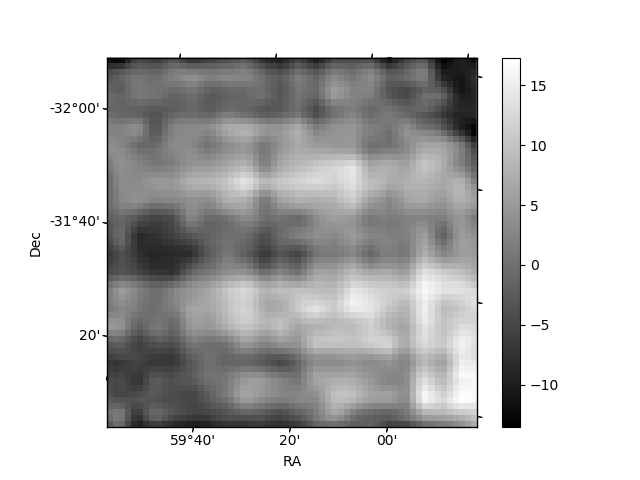
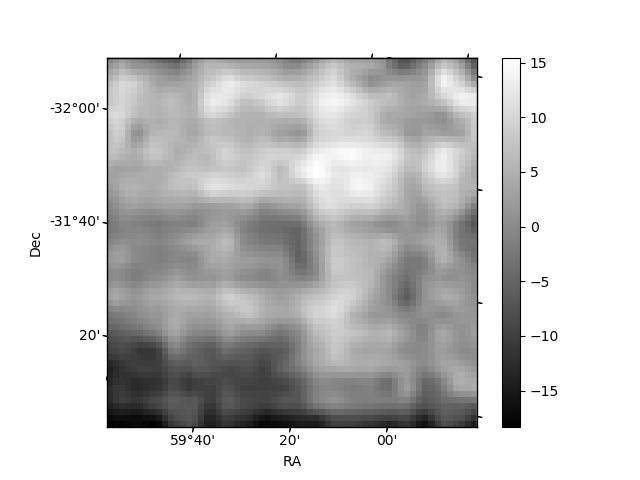
Histogram calculated using DETX and DETY for each event in the final _common_clean file
| Quadrant A | 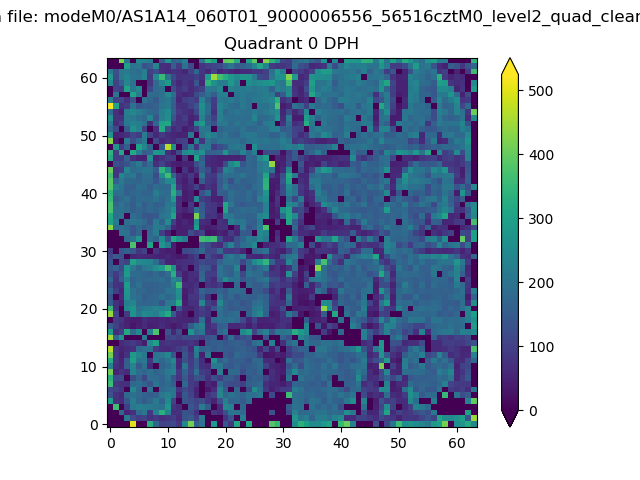 |
 |
Quadrant B |
|---|---|---|---|
| Quadrant D | 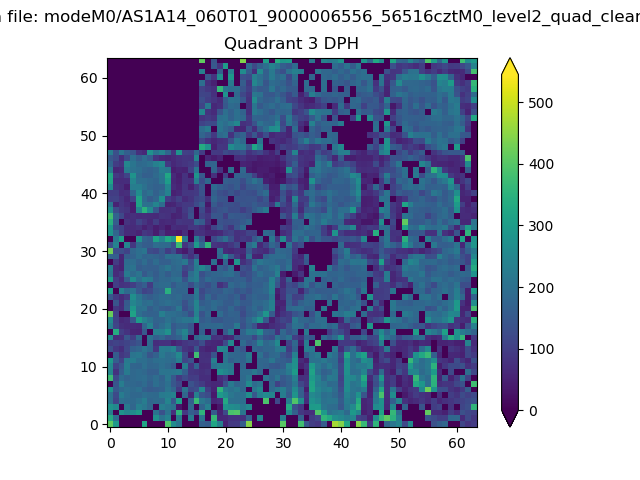 |
 |
Quadrant C |
| Plot type | Count rate plots | Images |
|---|---|---|
| Comparison with Poisson distribution Blue bars denote a histogram of data divided into 1 sec bins. Red curve is a Poisson curve with rate = median count rate of data. |
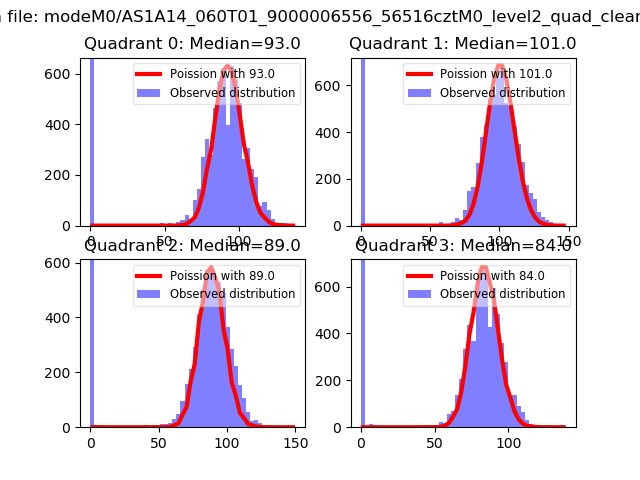 |
 |
| Quadrant-wise count rates Data is divided into 100 sec bins |
 |
|
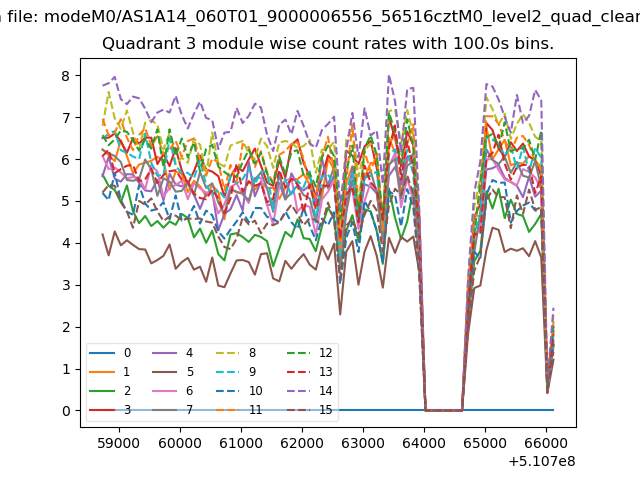
| Module-wise count rates for Quadrant A Data is divided into 100 sec bins |
 |
 |
| Module-wise count rates for Quadrant B Data is divided into 100 sec bins |
 |
 |
| Module-wise count rates for Quadrant C Data is divided into 100 sec bins |
 |
 |
| Module-wise count rates for Quadrant D Data is divided into 100 sec bins |
 |
 |
| Parameter | Plot |
|---|---|
| CZT HV Monitor | 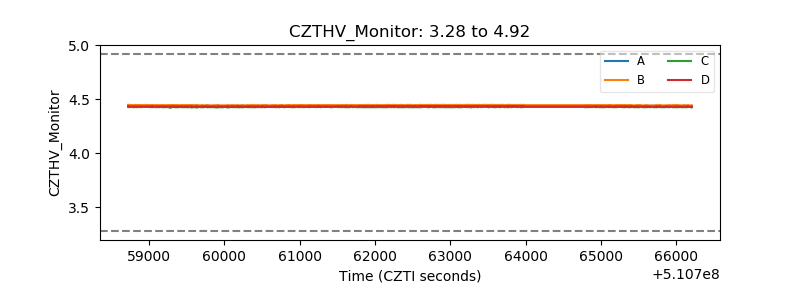 |
| D_VDD |  |
| Temperature 1 | 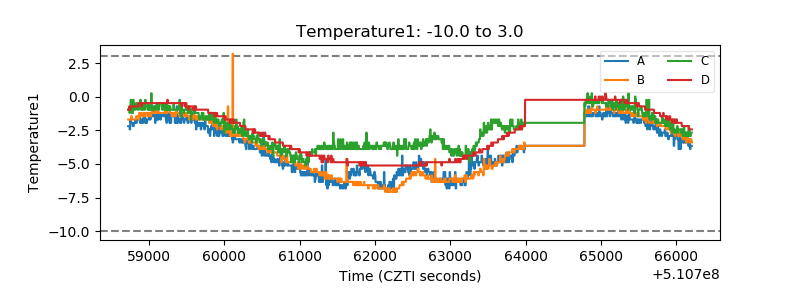 |
| Veto HV Monitor | 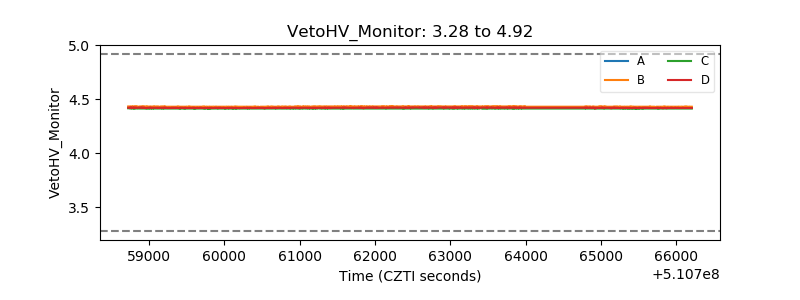 |
| Veto LLD |  |
| Alpha Counter |  |
| _CPM_Rate |  |
| CZT Counter | 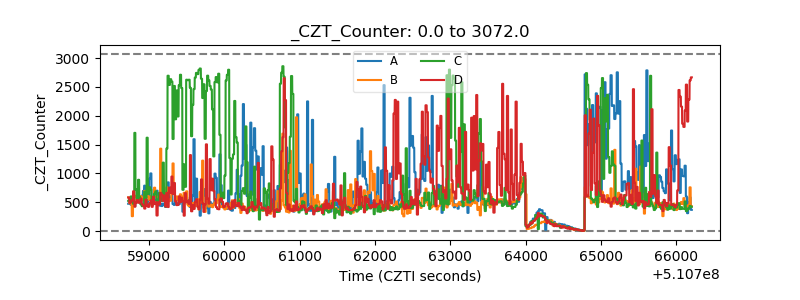 |
| +2.5 Volts monitor | 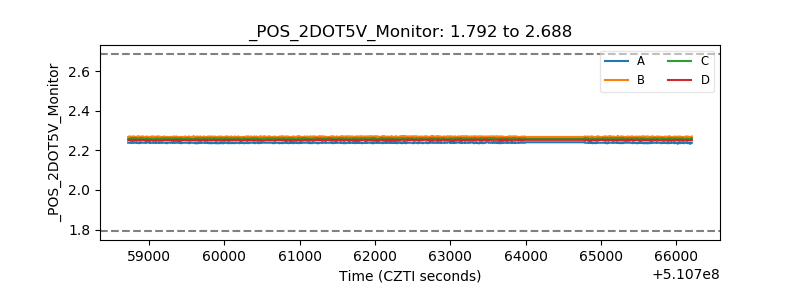 |
| +5 Volts monitor | 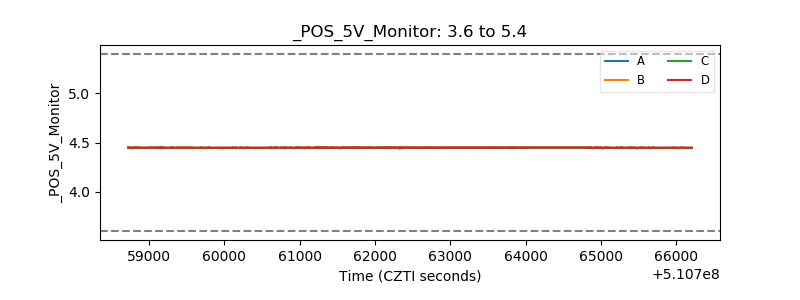 |
| _ROLL_ROT | 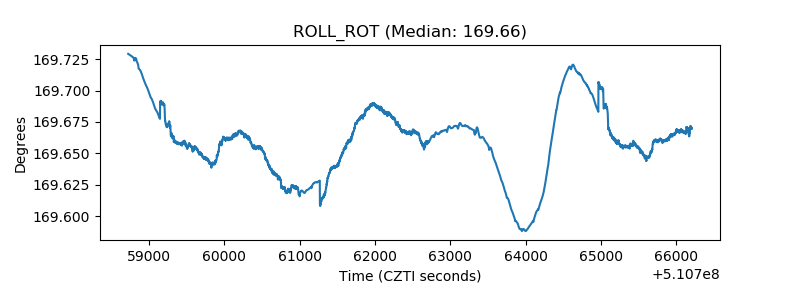 |
| _Roll_DEC | 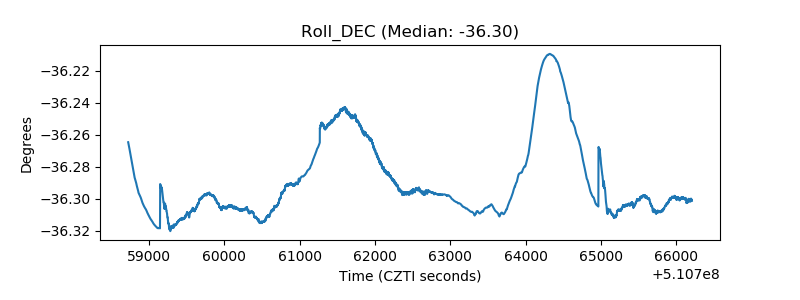 |
| _Roll_RA | 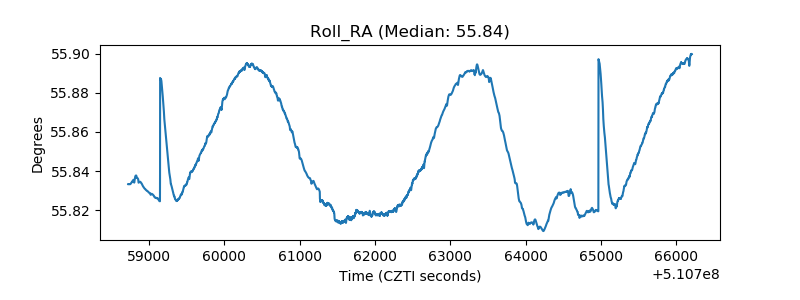 |
| Veto Counter | 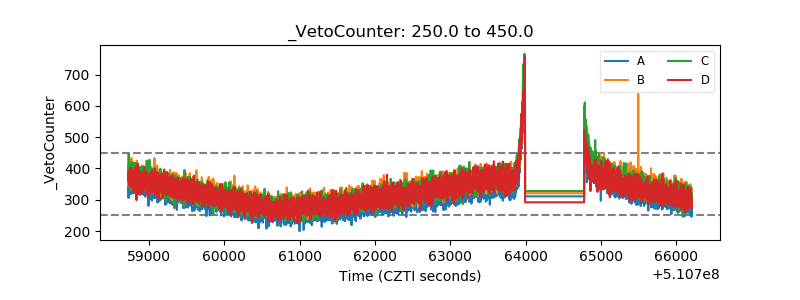 |