| Param | Original file | Final file |
|---|---|---|
| Filename | modeM0/AS1A14_060T01_9000006556_56517cztM0_level2.fits | modeM0/AS1A14_060T01_9000006556_56517cztM0_level2_quad_clean.evt |
| Size (bytes) | 639,083,520 | 86,541,120 |
| Size | 609.5 MB | 82.5 MB |
| Events in quadrant A | 6,362,945 | 543,546 |
| Events in quadrant B | 3,982,701 | 647,666 |
| Events in quadrant C | 6,915,567 | 462,401 |
| Events in quadrant D | 5,891,983 | 513,057 |
| Mode M0 | |||
|---|---|---|---|
| Quadrant | BADHDUFLAG | Total packets | Discarded packets |
| A | 0 | 23443 | 1 |
| B | 0 | 16270 | 1 |
| C | 0 | 25212 | 1 |
| D | 0 | 21973 | 1 |
| Mode M9 | |||
|---|---|---|---|
| Quadrant | BADHDUFLAG | Total packets | Discarded packets |
| A | 0 | 9 | 0 |
| B | 0 | 9 | 0 |
| C | 0 | 9 | 0 |
| D | 0 | 9 | 0 |
| Mode SS | |||
|---|---|---|---|
| Quadrant | BADHDUFLAG | Total packets | Discarded packets |
| A | 0 | 132 | 0 |
| B | 0 | 132 | 0 |
| C | 0 | 132 | 0 |
| D | 0 | 132 | 0 |
| Quadrant | Total seconds | Saturated seconds | Saturation percentage |
|---|---|---|---|
| A | 6499 | 849 | 13.063548% |
| B | 6500 | 218 | 3.353846% |
| C | 6500 | 1500 | 23.076923% |
| D | 6500 | 647 | 9.953846% |
Noise dominated data is calculated using 1-second bins in cleaned event files. If a bin has >2000 counts, and if more than 50% of those come from <1% of pixels, then it is considered to be noise-dominated and hence unusable.
| Quadrant | # 1 sec bins | Bins with >0 counts | Bins with >2000 counts | High rate bins dominated by noise | Noise dominated (total time) | Noise dominated (detector-on time) | Marked lightcurve |
|---|---|---|---|---|---|---|---|
| A | 7439 | 6499 | 819 | 819 | 11.01% | 12.60% |  |
| B | 7440 | 6500 | 131 | 131 | 1.76% | 2.02% |  |
| C | 7440 | 6501 | 1532 | 1532 | 20.59% | 23.57% |  |
| D | 7440 | 6500 | 633 | 633 | 8.51% | 9.74% |  |
Top three noisy pixels from each quadrant. If the there are fewer than three noisy pixels in the level2.evt file, extra rows are filled as -1
| Pixel properties | Quadrant properties | ||||||
|---|---|---|---|---|---|---|---|
| Quadrant | DetID | PixID | Counts | Sigma | Mean | Median | Sigma |
| A | 7 | 64 | 2315459 | 13991.43 | 665 | 649 | 165.4 |
| A | 4 | 95 | 1003589 | 6062.08 | 665 | 649 | 165.4 |
| A | 0 | 8 | 211098 | 1272.02 | 665 | 649 | 165.4 |
| B | 4 | 206 | 766274 | 5182.91 | 688 | 664 | 147.7 |
| B | 3 | 145 | 104430 | 702.46 | 688 | 664 | 147.7 |
| B | 10 | 247 | 103588 | 696.76 | 688 | 664 | 147.7 |
| C | 15 | 230 | 3932288 | 23571.91 | 604 | 599 | 166.8 |
| C | 12 | 252 | 247966 | 1483.06 | 604 | 599 | 166.8 |
| C | 14 | 254 | 204564 | 1222.84 | 604 | 599 | 166.8 |
| D | 7 | 96 | 1896230 | 10252.24 | 646 | 615 | 184.9 |
| D | 2 | 249 | 527277 | 2848.4 | 646 | 615 | 184.9 |
| D | 11 | 176 | 252858 | 1364.23 | 646 | 615 | 184.9 |
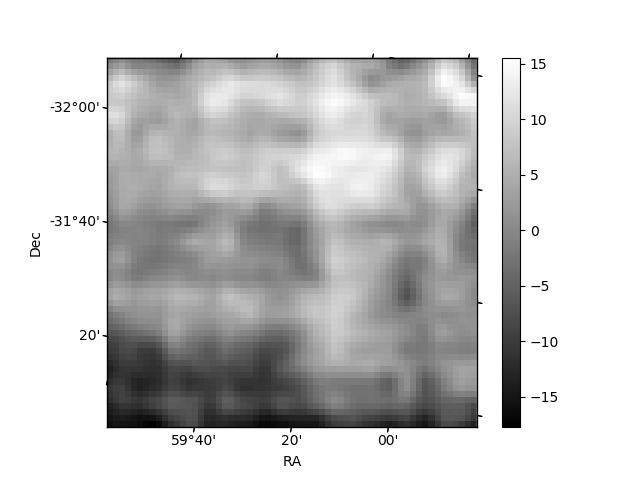
Histogram calculated using DETX and DETY for each event in the final _common_clean file
| Quadrant A |  |
 |
Quadrant B |
|---|---|---|---|
| Quadrant D | 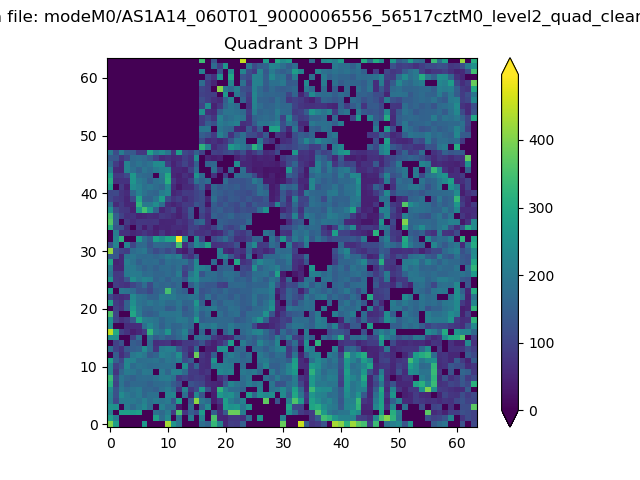 |
 |
Quadrant C |
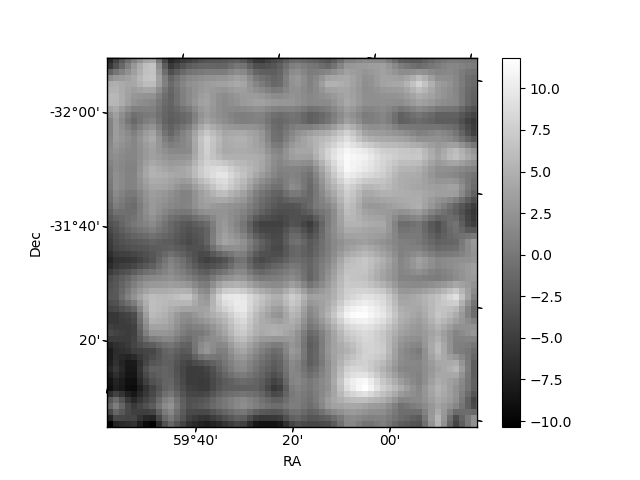
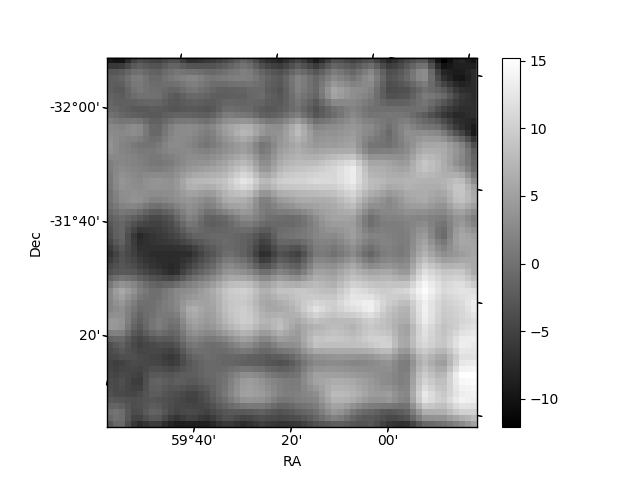
| Plot type | Count rate plots | Images |
|---|---|---|
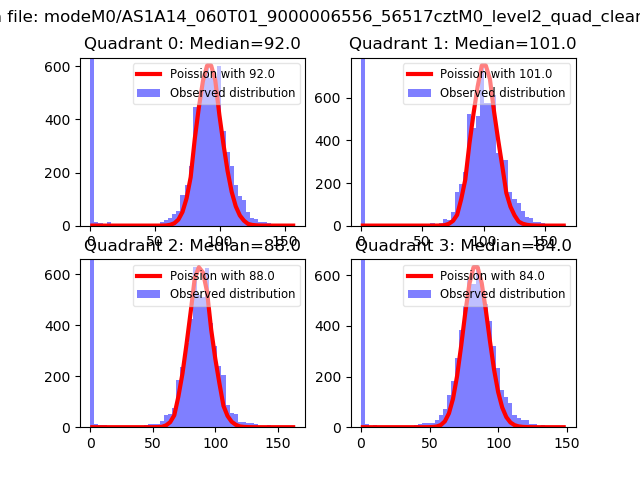
| Comparison with Poisson distribution Blue bars denote a histogram of data divided into 1 sec bins. Red curve is a Poisson curve with rate = median count rate of data. |
 |
 |
| Quadrant-wise count rates Data is divided into 100 sec bins |
 |
|
| Module-wise count rates for Quadrant A Data is divided into 100 sec bins |
 |
 |
| Module-wise count rates for Quadrant B Data is divided into 100 sec bins |
 |
 |
| Module-wise count rates for Quadrant C Data is divided into 100 sec bins |
 |
 |
| Module-wise count rates for Quadrant D Data is divided into 100 sec bins |
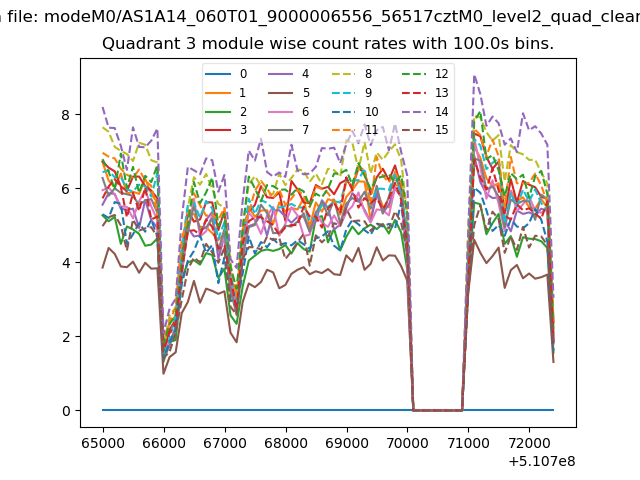 |
 |
| Parameter | Plot |
|---|---|
| CZT HV Monitor | 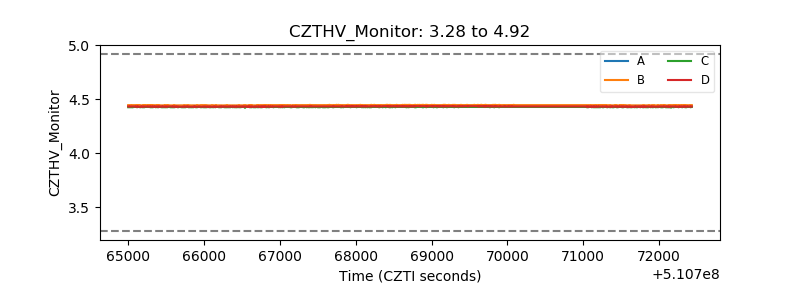 |
| D_VDD |  |
| Temperature 1 | 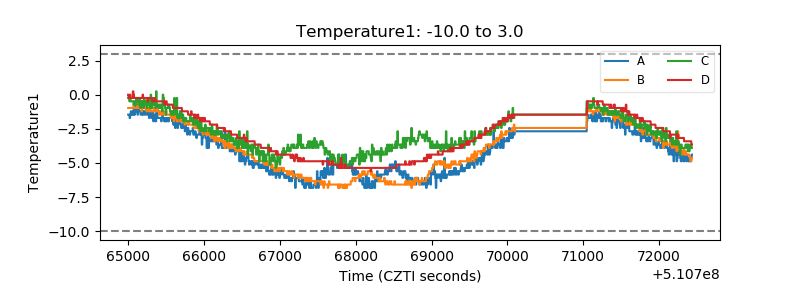 |
| Veto HV Monitor | 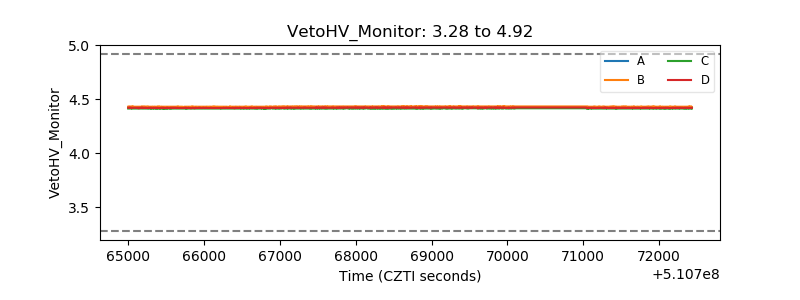 |
| Veto LLD |  |
| Alpha Counter |  |
| _CPM_Rate | 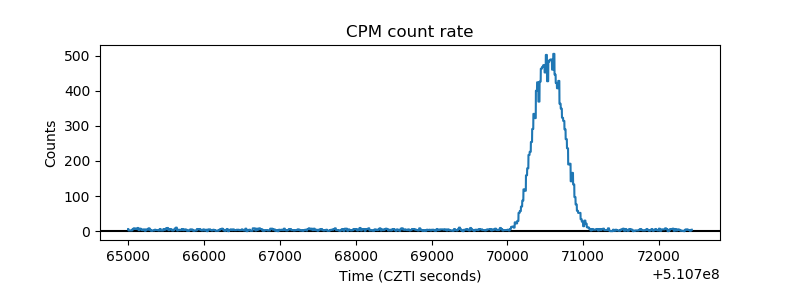 |
| CZT Counter | 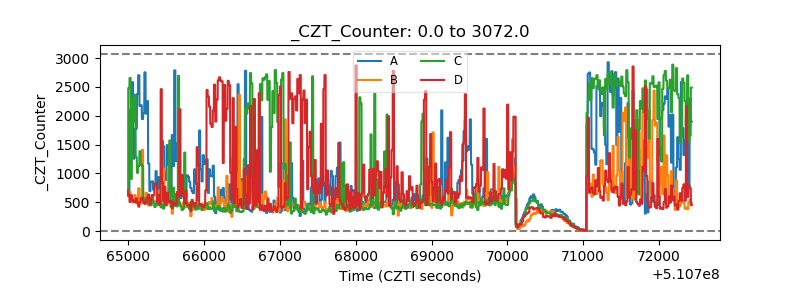 |
| +2.5 Volts monitor | 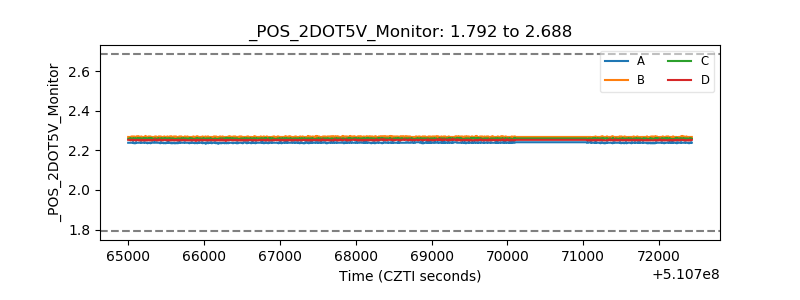 |
| +5 Volts monitor | 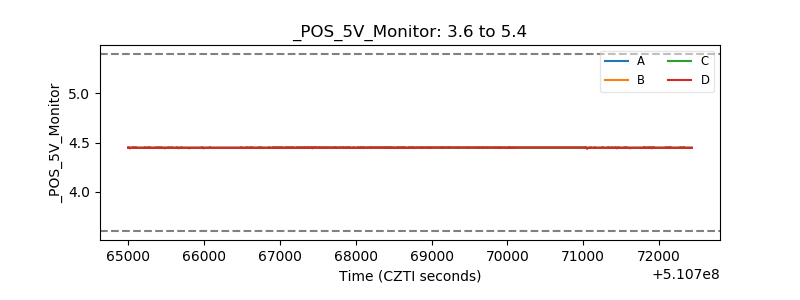 |
| _ROLL_ROT | 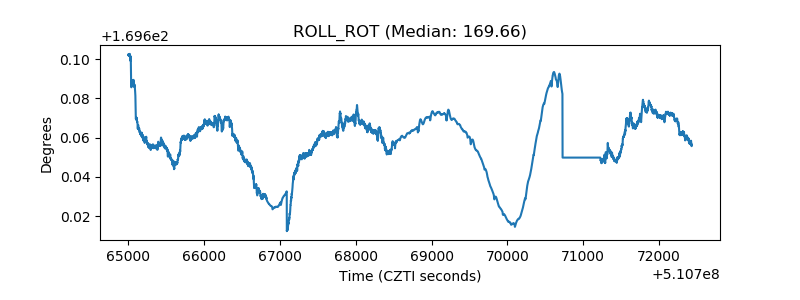 |
| _Roll_DEC | 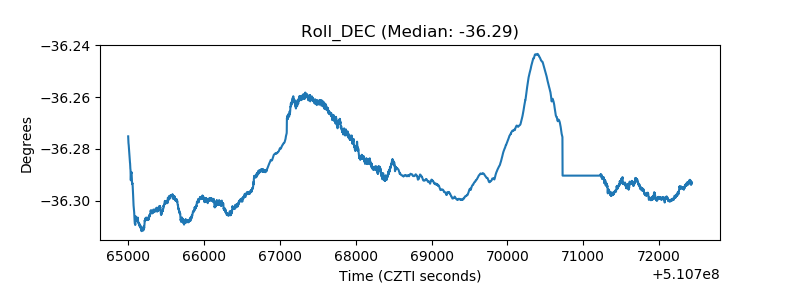 |
| _Roll_RA |  |
| Veto Counter | 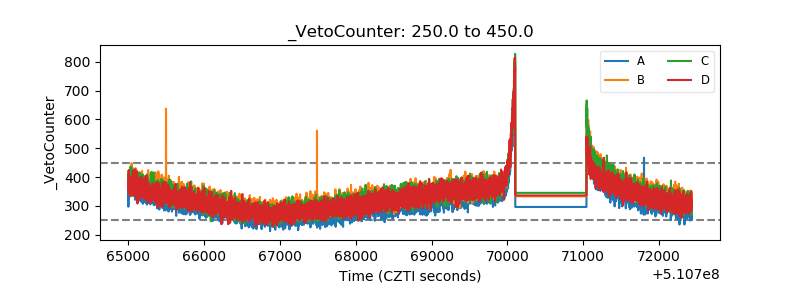 |