| Param | Original file | Final file |
|---|---|---|
| Filename | modeM0/AS1A14_060T01_9000006556_56519cztM0_level2.fits | modeM0/AS1A14_060T01_9000006556_56519cztM0_level2_quad_clean.evt |
| Size (bytes) | 677,056,320 | 85,988,160 |
| Size | 645.7 MB | 82.0 MB |
| Events in quadrant A | 7,760,479 | 523,584 |
| Events in quadrant B | 4,121,931 | 647,237 |
| Events in quadrant C | 7,691,681 | 462,493 |
| Events in quadrant D | 4,994,243 | 524,348 |
| Mode M0 | |||
|---|---|---|---|
| Quadrant | BADHDUFLAG | Total packets | Discarded packets |
| A | 0 | 27503 | 1 |
| B | 0 | 16697 | 1 |
| C | 0 | 27213 | 1 |
| D | 0 | 19313 | 3 |
| Mode M9 | |||
|---|---|---|---|
| Quadrant | BADHDUFLAG | Total packets | Discarded packets |
| A | 0 | 11 | 0 |
| B | 0 | 11 | 0 |
| C | 0 | 11 | 0 |
| D | 0 | 11 | 0 |
| Mode SS | |||
|---|---|---|---|
| Quadrant | BADHDUFLAG | Total packets | Discarded packets |
| A | 0 | 130 | 0 |
| B | 0 | 130 | 0 |
| C | 0 | 130 | 0 |
| D | 0 | 130 | 0 |
| Quadrant | Total seconds | Saturated seconds | Saturation percentage |
|---|---|---|---|
| A | 6386 | 1098 | 17.193862% |
| B | 6386 | 248 | 3.883495% |
| C | 6386 | 1541 | 24.130911% |
| D | 6385 | 408 | 6.389977% |
Noise dominated data is calculated using 1-second bins in cleaned event files. If a bin has >2000 counts, and if more than 50% of those come from <1% of pixels, then it is considered to be noise-dominated and hence unusable.
| Quadrant | # 1 sec bins | Bins with >0 counts | Bins with >2000 counts | High rate bins dominated by noise | Noise dominated (total time) | Noise dominated (detector-on time) | Marked lightcurve |
|---|---|---|---|---|---|---|---|
| A | 7451 | 6386 | 1055 | 1055 | 14.16% | 16.52% | 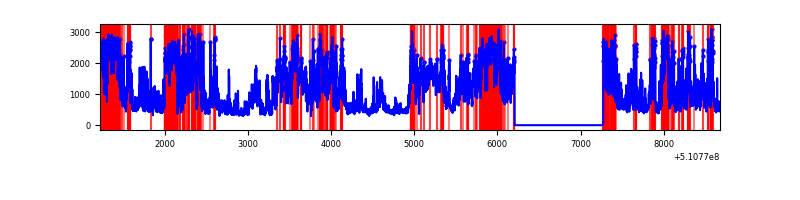 |
| B | 7451 | 6386 | 171 | 171 | 2.29% | 2.68% |  |
| C | 7450 | 6386 | 1624 | 1624 | 21.80% | 25.43% |  |
| D | 7449 | 6385 | 371 | 371 | 4.98% | 5.81% |  |
Top three noisy pixels from each quadrant. If the there are fewer than three noisy pixels in the level2.evt file, extra rows are filled as -1
| Pixel properties | Quadrant properties | ||||||
|---|---|---|---|---|---|---|---|
| Quadrant | DetID | PixID | Counts | Sigma | Mean | Median | Sigma |
| A | 7 | 64 | 2442680 | 15003.57 | 651 | 635 | 162.8 |
| A | 4 | 95 | 2316023 | 14225.41 | 651 | 635 | 162.8 |
| A | 12 | 16 | 197041 | 1206.69 | 651 | 635 | 162.8 |
| B | 4 | 206 | 893414 | 6114.0 | 681 | 659 | 146.0 |
| B | 7 | 252 | 92806 | 631.07 | 681 | 659 | 146.0 |
| B | 10 | 247 | 89067 | 605.46 | 681 | 659 | 146.0 |
| C | 15 | 230 | 4390757 | 26563.88 | 602 | 598 | 165.3 |
| C | 12 | 252 | 558938 | 3378.39 | 602 | 598 | 165.3 |
| C | 6 | 223 | 143924 | 867.23 | 602 | 598 | 165.3 |
| D | 2 | 249 | 761308 | 4103.68 | 644 | 616 | 185.4 |
| D | 7 | 96 | 721145 | 3887.02 | 644 | 616 | 185.4 |
| D | 8 | 129 | 237335 | 1277.02 | 644 | 616 | 185.4 |
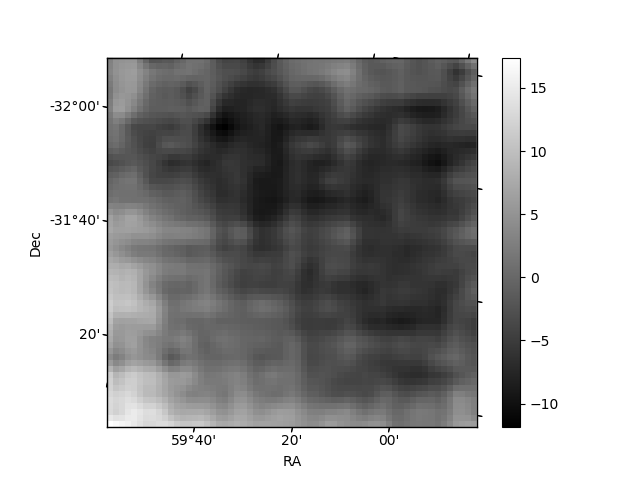
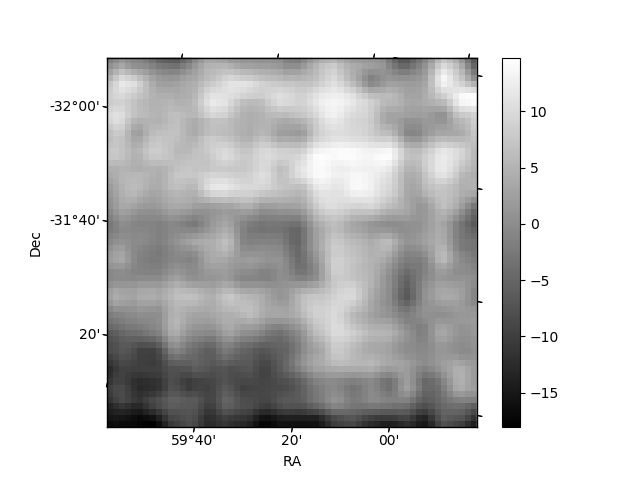
Histogram calculated using DETX and DETY for each event in the final _common_clean file
| Quadrant A | 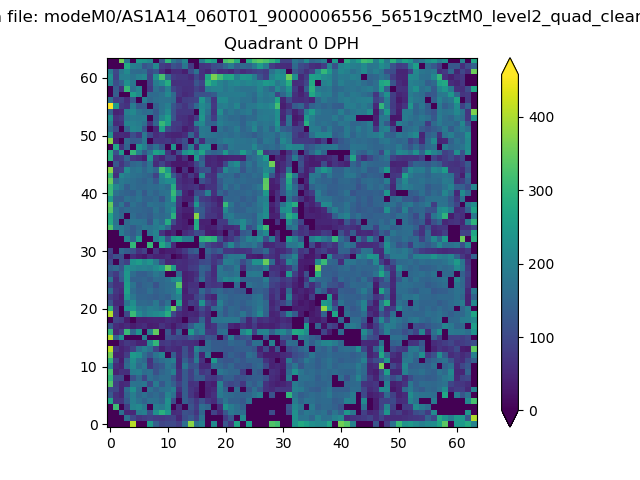 |
 |
Quadrant B |
|---|---|---|---|
| Quadrant D | 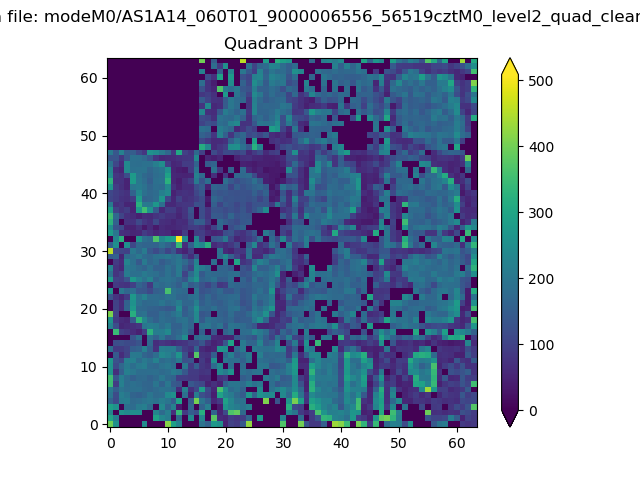 |
 |
Quadrant C |
| Plot type | Count rate plots | Images |
|---|---|---|
| Comparison with Poisson distribution Blue bars denote a histogram of data divided into 1 sec bins. Red curve is a Poisson curve with rate = median count rate of data. |
 |
 |
| Quadrant-wise count rates Data is divided into 100 sec bins |
 |
|
| Module-wise count rates for Quadrant A Data is divided into 100 sec bins |
 |
 |
| Module-wise count rates for Quadrant B Data is divided into 100 sec bins |
 |
 |
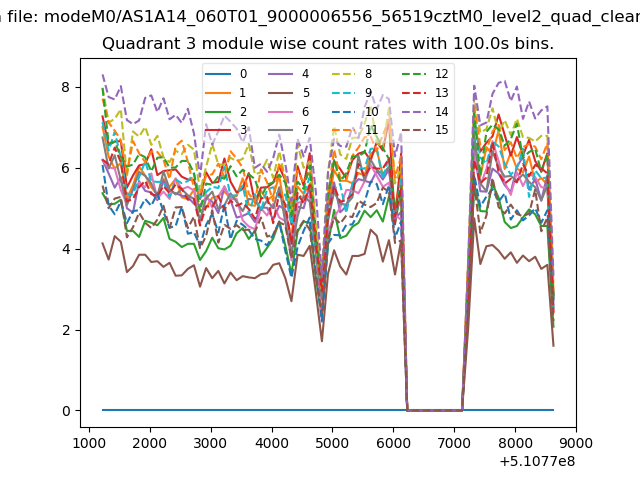
| Module-wise count rates for Quadrant C Data is divided into 100 sec bins |
 |
 |
| Module-wise count rates for Quadrant D Data is divided into 100 sec bins |
 |
 |
| Parameter | Plot |
|---|---|
| CZT HV Monitor | 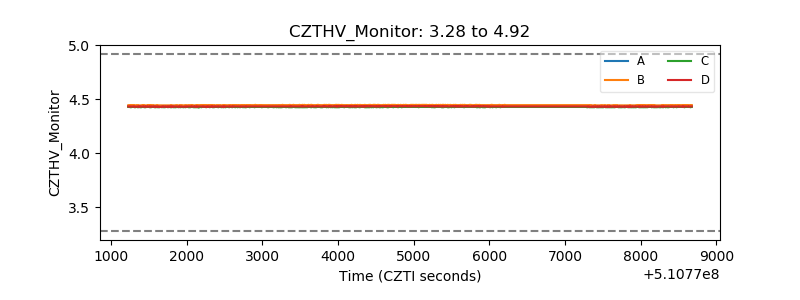 |
| D_VDD |  |
| Temperature 1 | 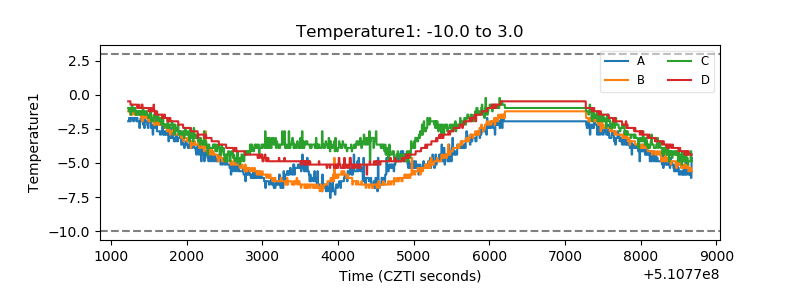 |
| Veto HV Monitor | 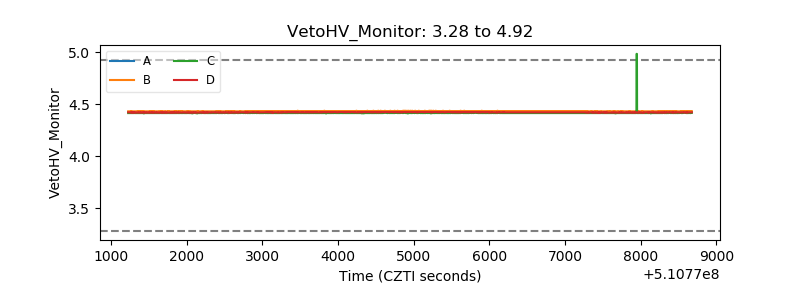 |
| Veto LLD |  |
| Alpha Counter |  |
| _CPM_Rate | 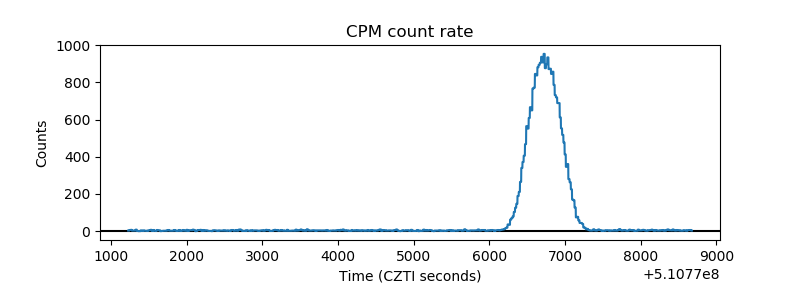 |
| CZT Counter | 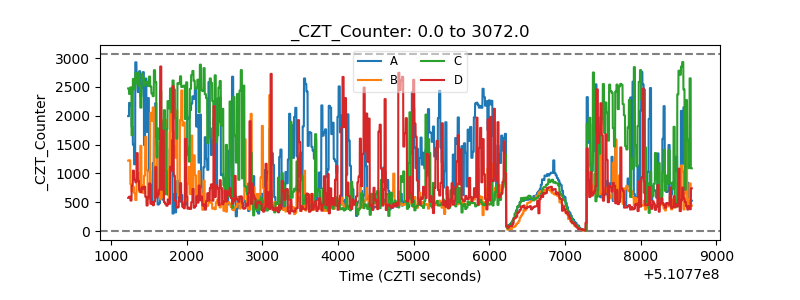 |
| +2.5 Volts monitor | 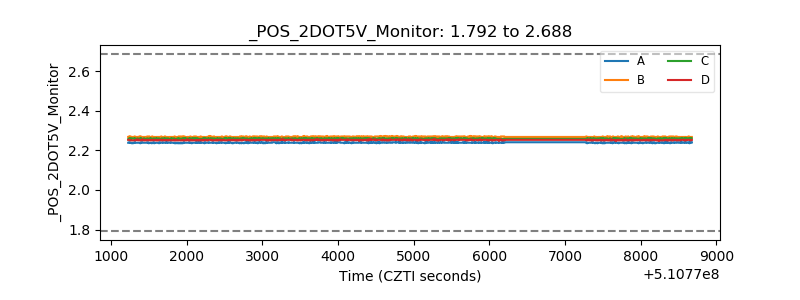 |
| +5 Volts monitor | 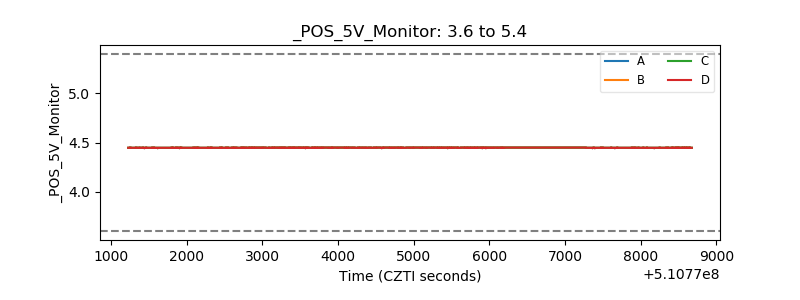 |
| _ROLL_ROT | 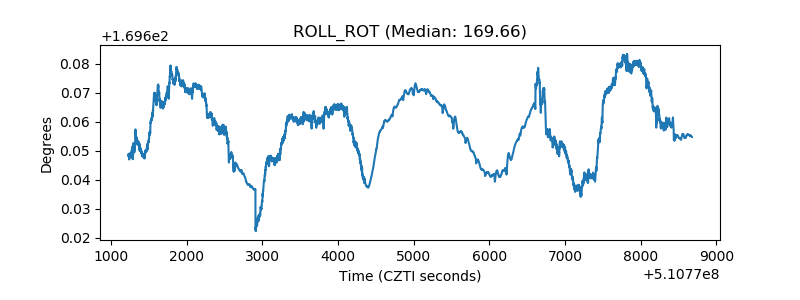 |
| _Roll_DEC | 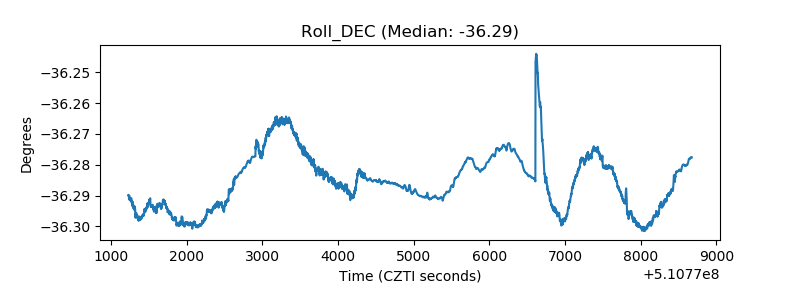 |
| _Roll_RA |  |
| Veto Counter | 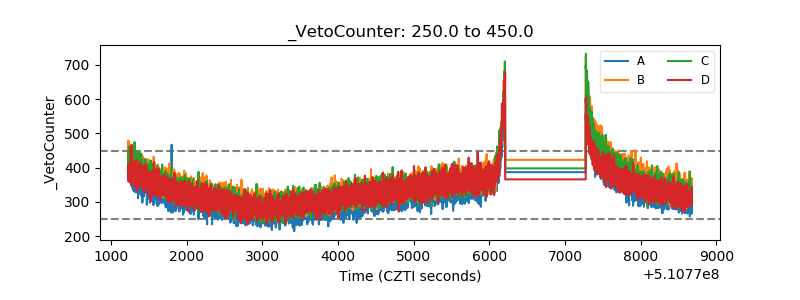 |