| Param | Original file | Final file |
|---|---|---|
| Filename | modeM0/AS1A14_060T01_9000006556_56520cztM0_level2.fits | modeM0/AS1A14_060T01_9000006556_56520cztM0_level2_quad_clean.evt |
| Size (bytes) | 644,342,400 | 87,811,200 |
| Size | 614.5 MB | 83.7 MB |
| Events in quadrant A | 6,678,233 | 559,237 |
| Events in quadrant B | 3,835,389 | 659,728 |
| Events in quadrant C | 7,180,464 | 495,657 |
| Events in quadrant D | 5,672,837 | 507,113 |
| Mode M0 | |||
|---|---|---|---|
| Quadrant | BADHDUFLAG | Total packets | Discarded packets |
| A | 0 | 24153 | 2 |
| B | 0 | 15673 | 2 |
| C | 0 | 25739 | 2 |
| D | 0 | 21261 | 2 |
| Mode M9 | |||
|---|---|---|---|
| Quadrant | BADHDUFLAG | Total packets | Discarded packets |
| A | 0 | 12 | 0 |
| B | 0 | 12 | 0 |
| C | 0 | 13 | 0 |
| D | 0 | 13 | 0 |
| Mode SS | |||
|---|---|---|---|
| Quadrant | BADHDUFLAG | Total packets | Discarded packets |
| A | 0 | 126 | 0 |
| B | 0 | 126 | 0 |
| C | 0 | 126 | 0 |
| D | 0 | 126 | 0 |
| Quadrant | Total seconds | Saturated seconds | Saturation percentage |
|---|---|---|---|
| A | 6261 | 782 | 12.490018% |
| B | 6261 | 209 | 3.338125% |
| C | 6261 | 1222 | 19.517649% |
| D | 6261 | 638 | 10.190065% |
Noise dominated data is calculated using 1-second bins in cleaned event files. If a bin has >2000 counts, and if more than 50% of those come from <1% of pixels, then it is considered to be noise-dominated and hence unusable.
| Quadrant | # 1 sec bins | Bins with >0 counts | Bins with >2000 counts | High rate bins dominated by noise | Noise dominated (total time) | Noise dominated (detector-on time) | Marked lightcurve |
|---|---|---|---|---|---|---|---|
| A | 7456 | 6261 | 690 | 690 | 9.25% | 11.02% |  |
| B | 7456 | 6261 | 101 | 101 | 1.35% | 1.61% | 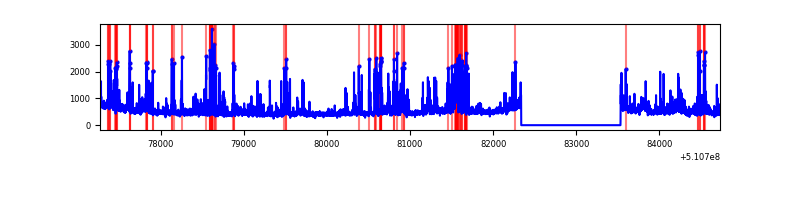 |
| C | 7456 | 6262 | 1276 | 1276 | 17.11% | 20.38% |  |
| D | 7456 | 6262 | 620 | 620 | 8.32% | 9.90% |  |
Top three noisy pixels from each quadrant. If the there are fewer than three noisy pixels in the level2.evt file, extra rows are filled as -1
| Pixel properties | Quadrant properties | ||||||
|---|---|---|---|---|---|---|---|
| Quadrant | DetID | PixID | Counts | Sigma | Mean | Median | Sigma |
| A | 7 | 64 | 2615486 | 15935.81 | 661 | 645 | 164.1 |
| A | 0 | 12 | 877889 | 5346.25 | 661 | 645 | 164.1 |
| A | 4 | 95 | 161914 | 982.83 | 661 | 645 | 164.1 |
| B | 4 | 206 | 667936 | 4550.98 | 684 | 660 | 146.6 |
| B | 7 | 252 | 123929 | 840.72 | 684 | 660 | 146.6 |
| B | 0 | 63 | 89290 | 604.48 | 684 | 660 | 146.6 |
| C | 15 | 230 | 3949252 | 23339.9 | 617 | 615 | 169.2 |
| C | 12 | 252 | 543931 | 3211.47 | 617 | 615 | 169.2 |
| C | 6 | 223 | 157719 | 928.62 | 617 | 615 | 169.2 |
| D | 8 | 129 | 917444 | 5114.07 | 623 | 595 | 179.3 |
| D | 7 | 96 | 730099 | 4069.08 | 623 | 595 | 179.3 |
| D | 2 | 249 | 588826 | 3281.08 | 623 | 595 | 179.3 |
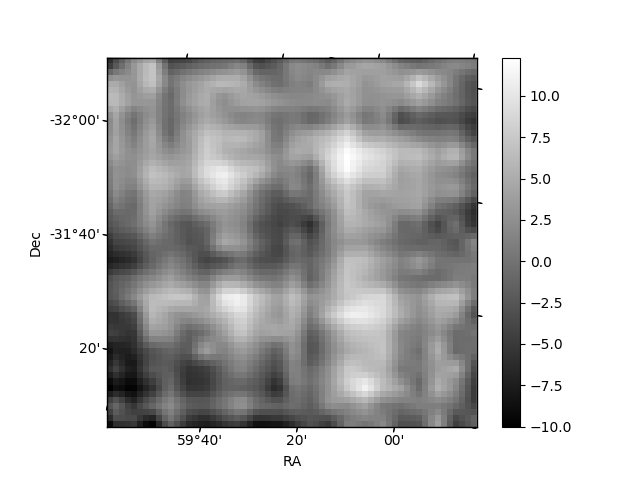
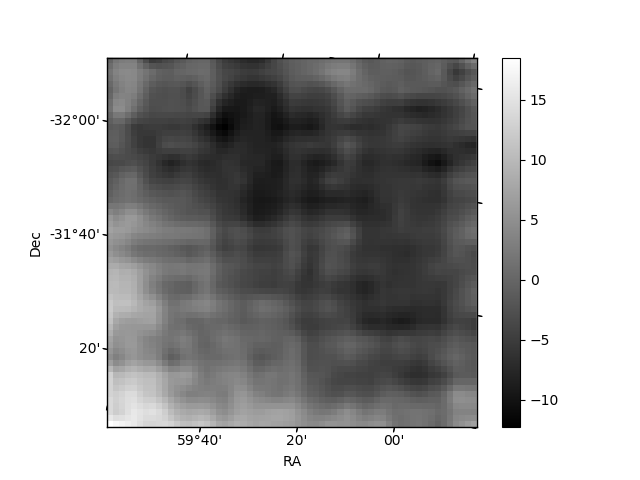
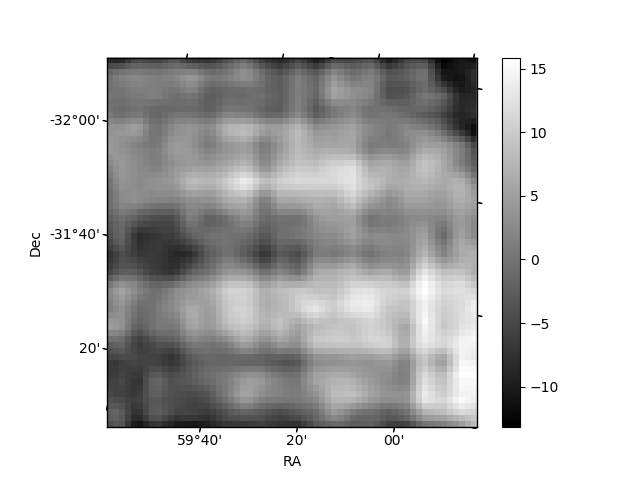
Histogram calculated using DETX and DETY for each event in the final _common_clean file
| Quadrant A | 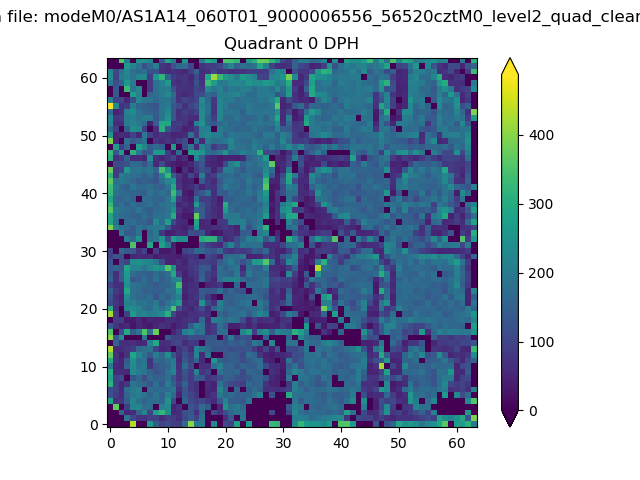 |
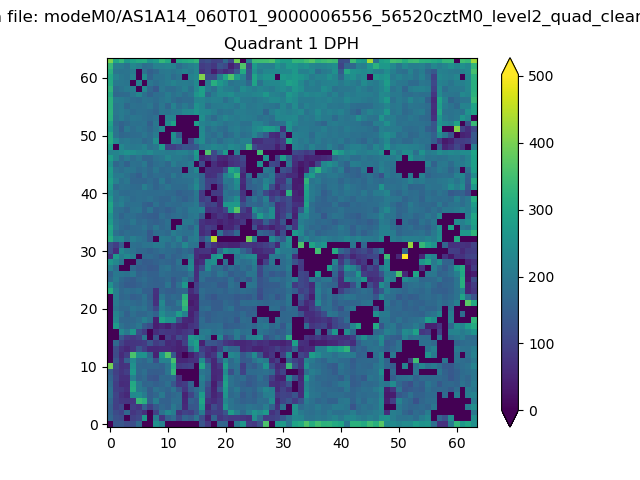 |
Quadrant B |
|---|---|---|---|
| Quadrant D | 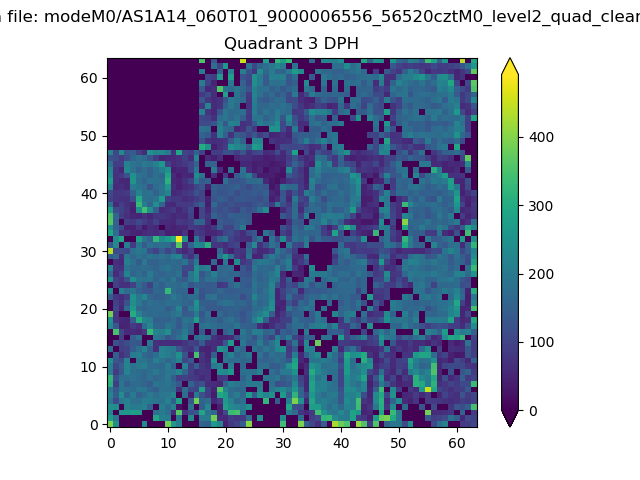 |
 |
Quadrant C |
| Plot type | Count rate plots | Images |
|---|---|---|
| Comparison with Poisson distribution Blue bars denote a histogram of data divided into 1 sec bins. Red curve is a Poisson curve with rate = median count rate of data. |
 |
 |
| Quadrant-wise count rates Data is divided into 100 sec bins |
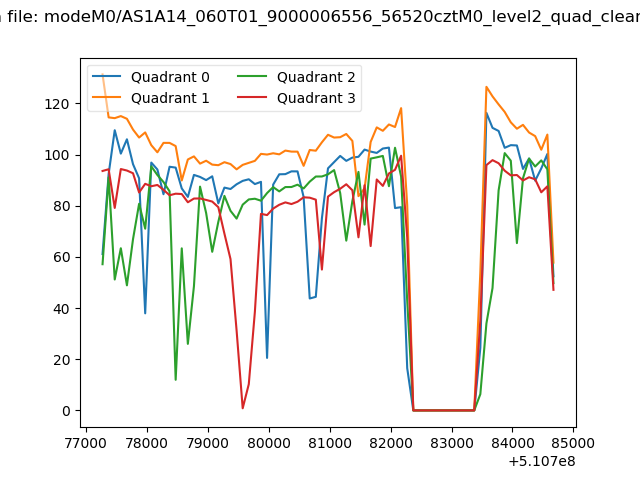 |
|
| Module-wise count rates for Quadrant A Data is divided into 100 sec bins |
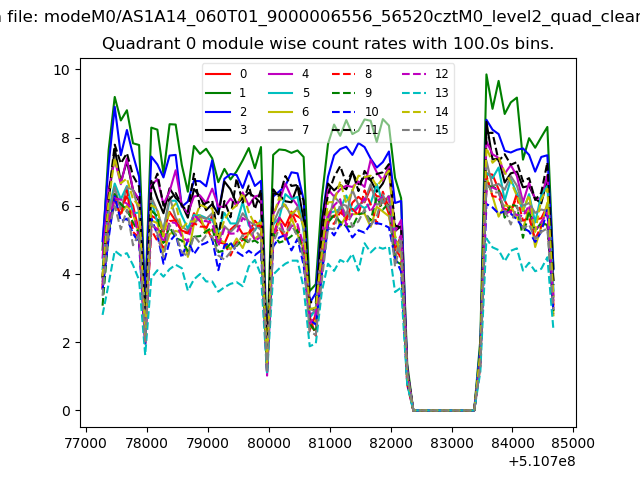 |
 |
| Module-wise count rates for Quadrant B Data is divided into 100 sec bins |
 |
 |
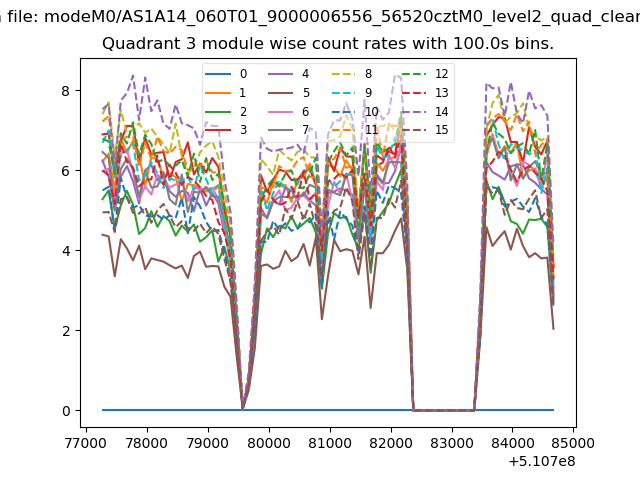
| Module-wise count rates for Quadrant C Data is divided into 100 sec bins |
 |
 |
| Module-wise count rates for Quadrant D Data is divided into 100 sec bins |
 |
 |
| Parameter | Plot |
|---|---|
| CZT HV Monitor |  |
| D_VDD |  |
| Temperature 1 | 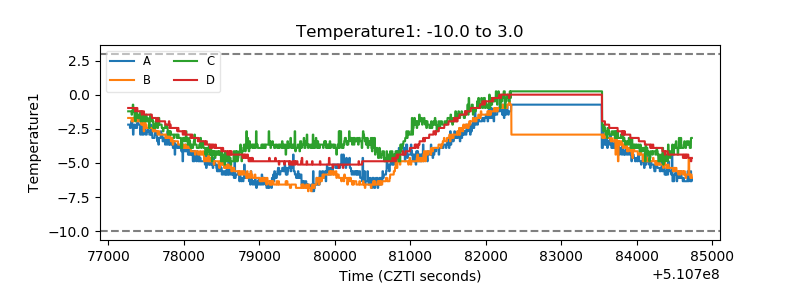 |
| Veto HV Monitor | 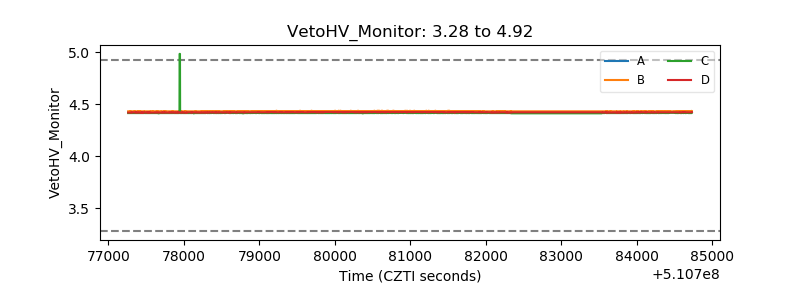 |
| Veto LLD |  |
| Alpha Counter |  |
| _CPM_Rate |  |
| CZT Counter | 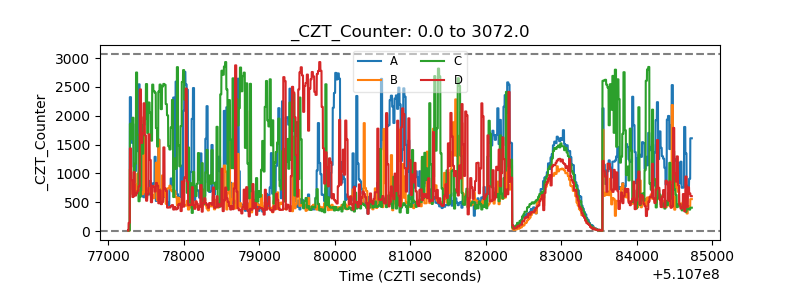 |
| +2.5 Volts monitor | 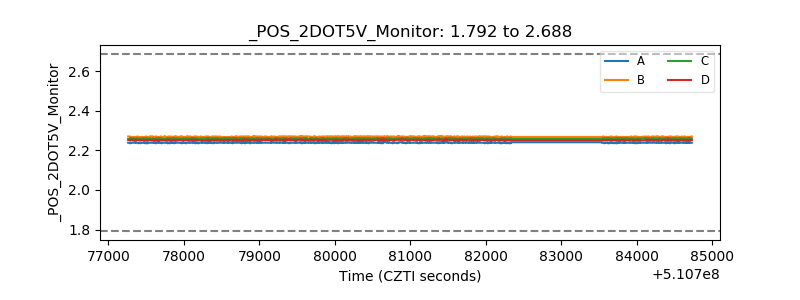 |
| +5 Volts monitor |  |
| _ROLL_ROT | 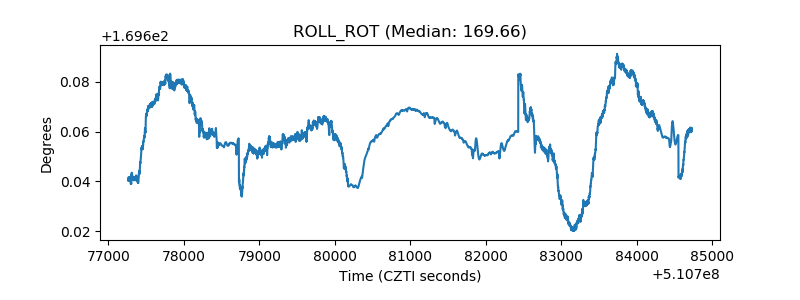 |
| _Roll_DEC | 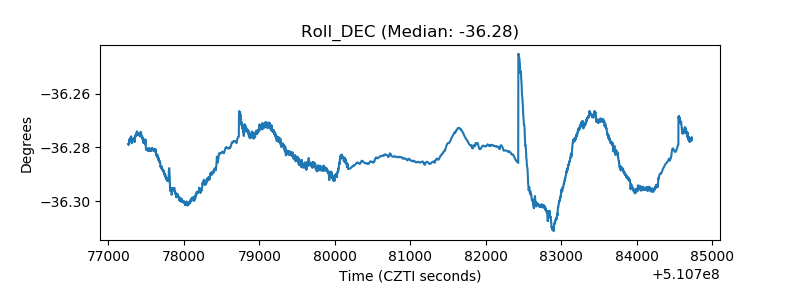 |
| _Roll_RA | 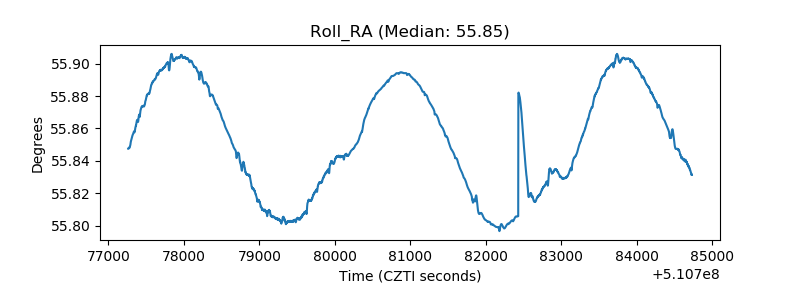 |
| Veto Counter | 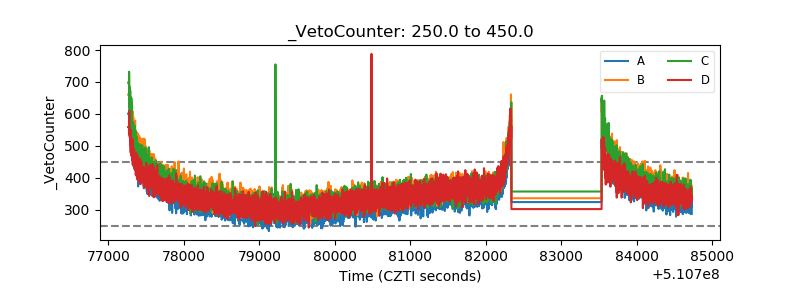 |