| Param | Original file | Final file |
|---|---|---|
| Filename | modeM0/AS1A14_060T01_9000006556_56521cztM0_level2.fits | modeM0/AS1A14_060T01_9000006556_56521cztM0_level2_quad_clean.evt |
| Size (bytes) | 633,723,840 | 88,655,040 |
| Size | 604.4 MB | 84.5 MB |
| Events in quadrant A | 9,457,931 | 504,010 |
| Events in quadrant B | 4,383,428 | 645,952 |
| Events in quadrant C | 4,752,091 | 550,310 |
| Events in quadrant D | 4,380,590 | 546,897 |
| Mode M0 | |||
|---|---|---|---|
| Quadrant | BADHDUFLAG | Total packets | Discarded packets |
| A | 0 | 32516 | 4 |
| B | 0 | 17326 | 2 |
| C | 0 | 18537 | 2 |
| D | 0 | 17242 | 2 |
| Mode M9 | |||
|---|---|---|---|
| Quadrant | BADHDUFLAG | Total packets | Discarded packets |
| A | 0 | 14 | 0 |
| B | 0 | 15 | 0 |
| C | 0 | 15 | 0 |
| D | 0 | 15 | 0 |
| Mode SS | |||
|---|---|---|---|
| Quadrant | BADHDUFLAG | Total packets | Discarded packets |
| A | 0 | 128 | 0 |
| B | 0 | 128 | 0 |
| C | 0 | 128 | 0 |
| D | 0 | 128 | 0 |
| Quadrant | Total seconds | Saturated seconds | Saturation percentage |
|---|---|---|---|
| A | 6257 | 1481 | 23.669490% |
| B | 6257 | 473 | 7.559533% |
| C | 6257 | 543 | 8.678280% |
| D | 6257 | 210 | 3.356241% |
Noise dominated data is calculated using 1-second bins in cleaned event files. If a bin has >2000 counts, and if more than 50% of those come from <1% of pixels, then it is considered to be noise-dominated and hence unusable.
| Quadrant | # 1 sec bins | Bins with >0 counts | Bins with >2000 counts | High rate bins dominated by noise | Noise dominated (total time) | Noise dominated (detector-on time) | Marked lightcurve |
|---|---|---|---|---|---|---|---|
| A | 7477 | 6257 | 1380 | 1380 | 18.46% | 22.06% | 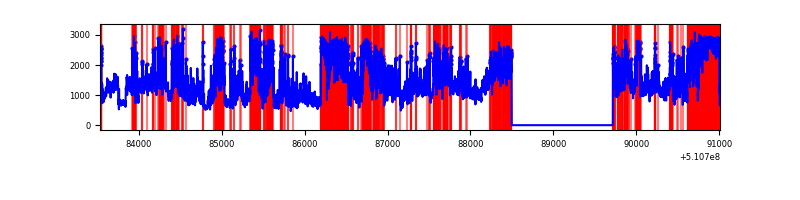 |
| B | 7477 | 6257 | 205 | 205 | 2.74% | 3.28% | 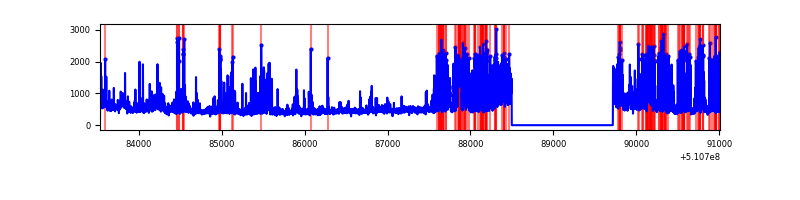 |
| C | 7477 | 6257 | 558 | 558 | 7.46% | 8.92% |  |
| D | 7477 | 6258 | 222 | 222 | 2.97% | 3.55% |  |
Top three noisy pixels from each quadrant. If the there are fewer than three noisy pixels in the level2.evt file, extra rows are filled as -1
| Pixel properties | Quadrant properties | ||||||
|---|---|---|---|---|---|---|---|
| Quadrant | DetID | PixID | Counts | Sigma | Mean | Median | Sigma |
| A | 7 | 64 | 4007576 | 25574.29 | 632 | 619 | 156.7 |
| A | 0 | 12 | 2342455 | 14946.7 | 632 | 619 | 156.7 |
| A | 4 | 95 | 381720 | 2432.37 | 632 | 619 | 156.7 |
| B | 4 | 206 | 1336772 | 9161.42 | 679 | 656 | 145.8 |
| B | 7 | 252 | 70139 | 476.42 | 679 | 656 | 145.8 |
| B | 0 | 63 | 61325 | 415.99 | 679 | 656 | 145.8 |
| C | 15 | 230 | 1917217 | 10823.23 | 642 | 637 | 177.1 |
| C | 6 | 223 | 107787 | 605.09 | 642 | 637 | 177.1 |
| C | 12 | 252 | 85227 | 477.69 | 642 | 637 | 177.1 |
| D | 2 | 249 | 623257 | 3305.68 | 656 | 626 | 188.4 |
| D | 9 | 49 | 310395 | 1644.63 | 656 | 626 | 188.4 |
| D | 11 | 176 | 286168 | 1516.0 | 656 | 626 | 188.4 |
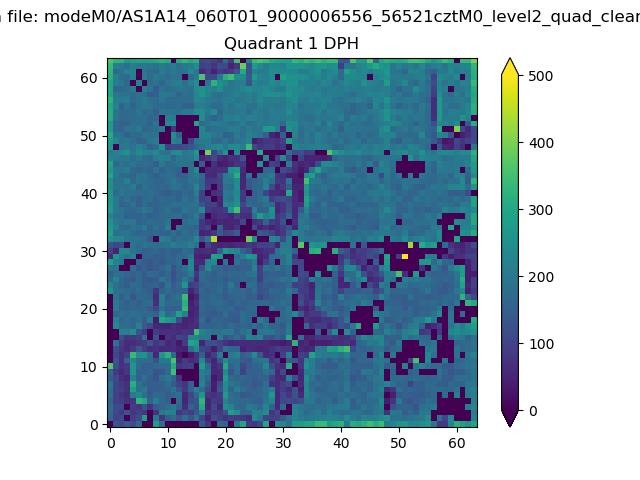
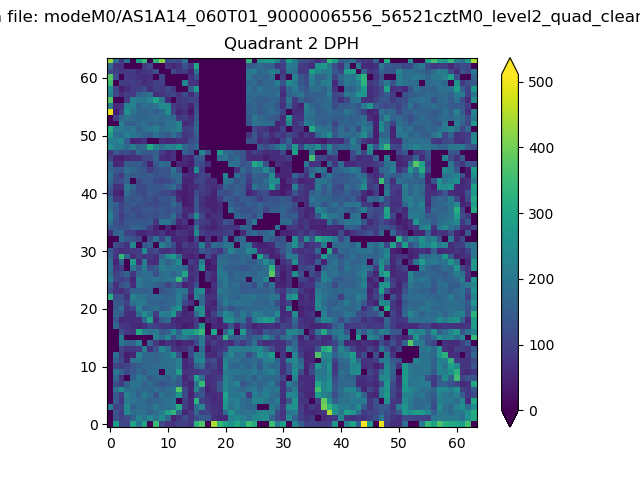
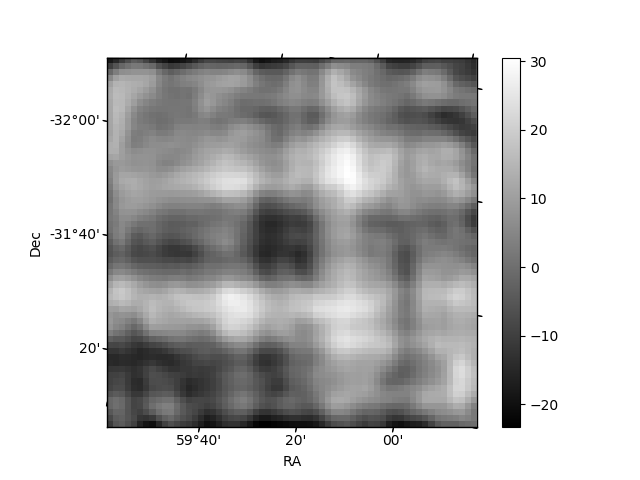
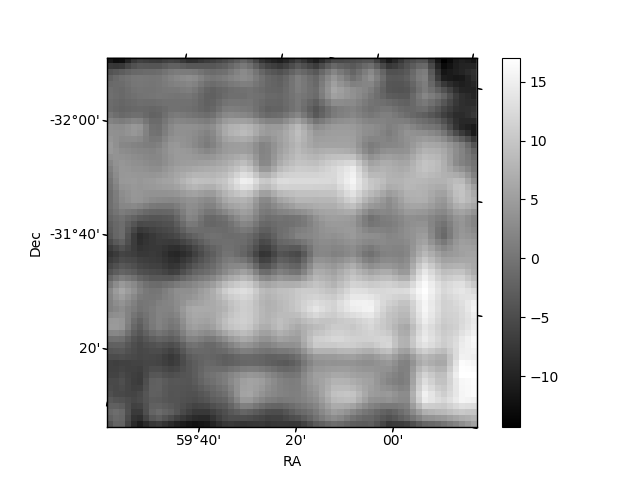
Histogram calculated using DETX and DETY for each event in the final _common_clean file
| Quadrant A |  |
 |
Quadrant B |
|---|---|---|---|
| Quadrant D |  |
 |
Quadrant C |
| Plot type | Count rate plots | Images |
|---|---|---|
| Comparison with Poisson distribution Blue bars denote a histogram of data divided into 1 sec bins. Red curve is a Poisson curve with rate = median count rate of data. |
 |
 |
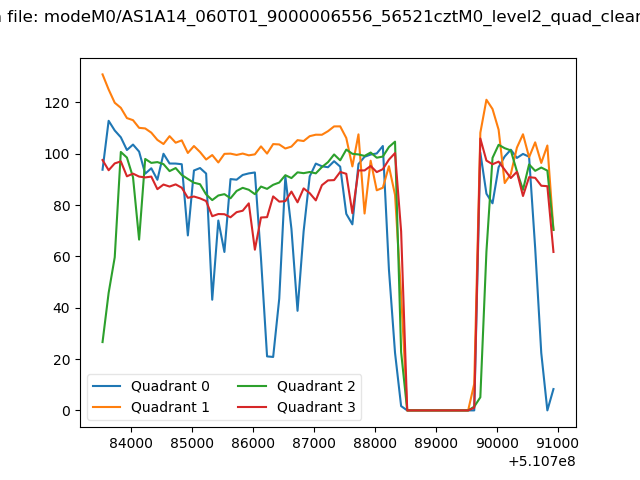
| Quadrant-wise count rates Data is divided into 100 sec bins |
 |
|
| Module-wise count rates for Quadrant A Data is divided into 100 sec bins |
 |
 |
| Module-wise count rates for Quadrant B Data is divided into 100 sec bins |
 |
 |
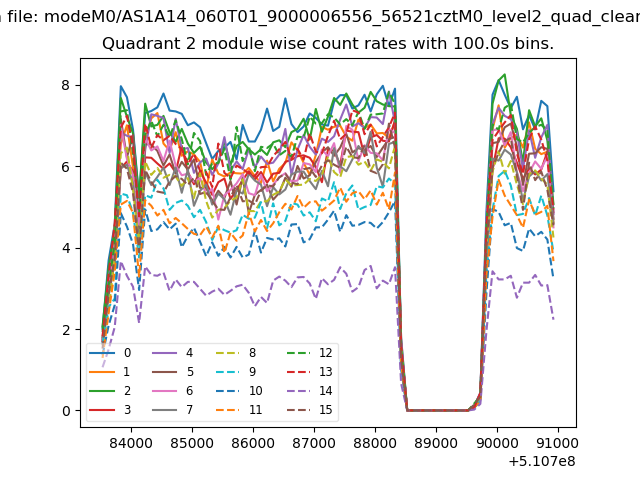
| Module-wise count rates for Quadrant C Data is divided into 100 sec bins |
 |
 |
| Module-wise count rates for Quadrant D Data is divided into 100 sec bins |
 |
 |
| Parameter | Plot |
|---|---|
| CZT HV Monitor |  |
| D_VDD | 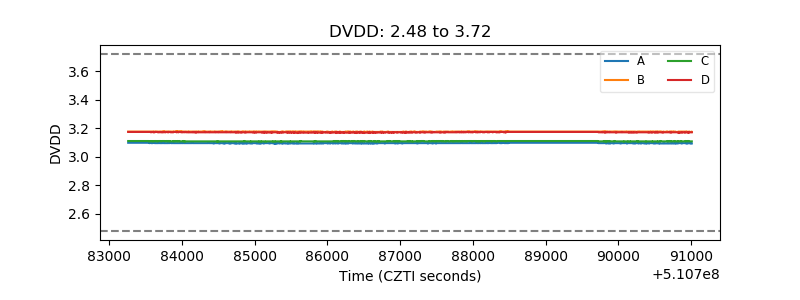 |
| Temperature 1 |  |
| Veto HV Monitor | 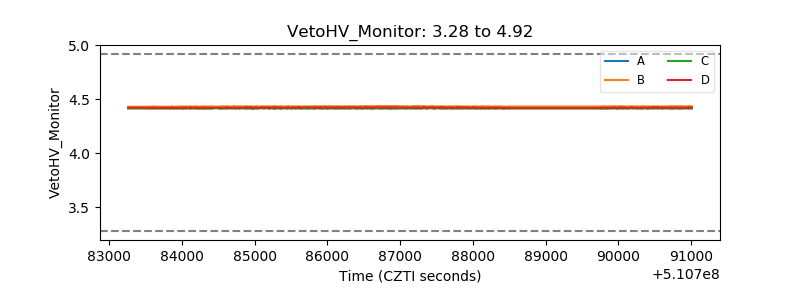 |
| Veto LLD | 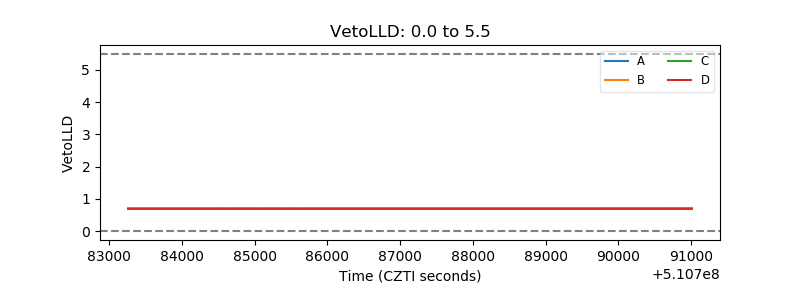 |
| Alpha Counter | 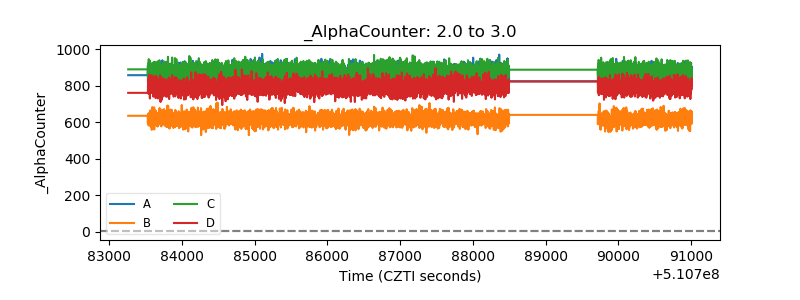 |
| _CPM_Rate | 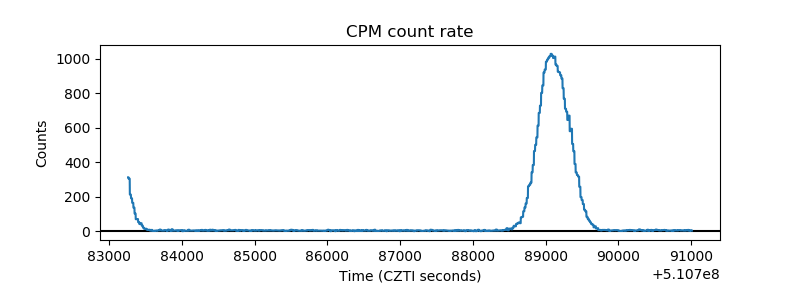 |
| CZT Counter |  |
| +2.5 Volts monitor |  |
| +5 Volts monitor |  |
| _ROLL_ROT | 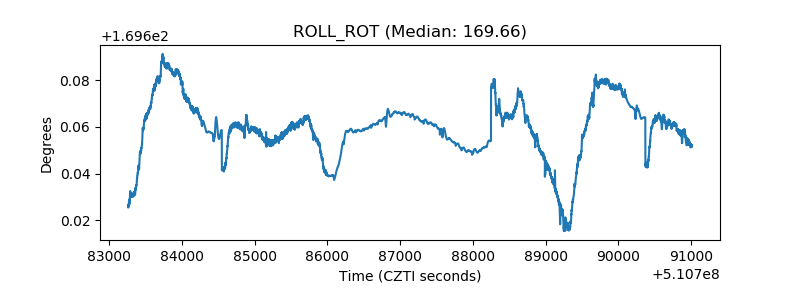 |
| _Roll_DEC |  |
| _Roll_RA | 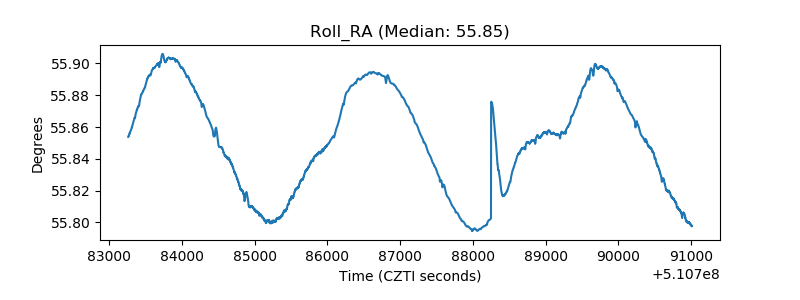 |
| Veto Counter | 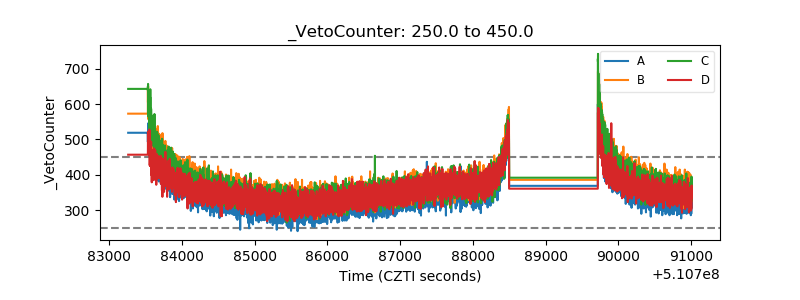 |