| Param | Original file | Final file |
|---|---|---|
| Filename | modeM0/AS1A14_060T01_9000006556_56523cztM0_level2.fits | modeM0/AS1A14_060T01_9000006556_56523cztM0_level2_quad_clean.evt |
| Size (bytes) | 559,869,120 | 98,596,800 |
| Size | 533.9 MB | 94.0 MB |
| Events in quadrant A | 6,058,728 | 645,488 |
| Events in quadrant B | 4,716,950 | 687,630 |
| Events in quadrant C | 5,377,938 | 582,293 |
| Events in quadrant D | 4,036,824 | 589,986 |
| Mode M0 | |||
|---|---|---|---|
| Quadrant | BADHDUFLAG | Total packets | Discarded packets |
| A | 0 | 22960 | 2 |
| B | 0 | 18764 | 2 |
| C | 0 | 20701 | 2 |
| D | 0 | 16848 | 4 |
| Mode M9 | |||
|---|---|---|---|
| Quadrant | BADHDUFLAG | Total packets | Discarded packets |
| A | 0 | 15 | 0 |
| B | 0 | 15 | 0 |
| C | 0 | 16 | 0 |
| D | 0 | 16 | 0 |
| Mode SS | |||
|---|---|---|---|
| Quadrant | BADHDUFLAG | Total packets | Discarded packets |
| A | 0 | 140 | 0 |
| B | 0 | 140 | 0 |
| C | 0 | 140 | 0 |
| D | 0 | 140 | 0 |
| Quadrant | Total seconds | Saturated seconds | Saturation percentage |
|---|---|---|---|
| A | 6886 | 319 | 4.632588% |
| B | 6886 | 498 | 7.232065% |
| C | 6886 | 702 | 10.194598% |
| D | 6885 | 114 | 1.655773% |
Noise dominated data is calculated using 1-second bins in cleaned event files. If a bin has >2000 counts, and if more than 50% of those come from <1% of pixels, then it is considered to be noise-dominated and hence unusable.
| Quadrant | # 1 sec bins | Bins with >0 counts | Bins with >2000 counts | High rate bins dominated by noise | Noise dominated (total time) | Noise dominated (detector-on time) | Marked lightcurve |
|---|---|---|---|---|---|---|---|
| A | 7906 | 6886 | 117 | 117 | 1.48% | 1.70% | 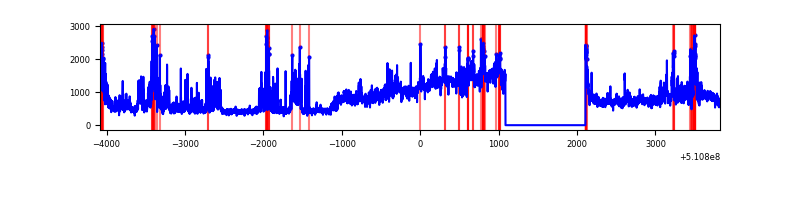 |
| B | 7906 | 6886 | 200 | 200 | 2.53% | 2.90% |  |
| C | 7905 | 6885 | 700 | 700 | 8.86% | 10.17% |  |
| D | 7905 | 6885 | 58 | 58 | 0.73% | 0.84% |  |
Top three noisy pixels from each quadrant. If the there are fewer than three noisy pixels in the level2.evt file, extra rows are filled as -1
| Pixel properties | Quadrant properties | ||||||
|---|---|---|---|---|---|---|---|
| Quadrant | DetID | PixID | Counts | Sigma | Mean | Median | Sigma |
| A | 0 | 12 | 1947220 | 10575.27 | 749 | 732 | 184.1 |
| A | 7 | 64 | 880333 | 4778.87 | 749 | 732 | 184.1 |
| A | 4 | 95 | 230326 | 1247.38 | 749 | 732 | 184.1 |
| B | 4 | 206 | 1141568 | 7136.67 | 747 | 719 | 159.9 |
| B | 4 | 171 | 259799 | 1620.7 | 747 | 719 | 159.9 |
| B | 5 | 185 | 124270 | 772.88 | 747 | 719 | 159.9 |
| C | 15 | 230 | 1834879 | 9509.64 | 699 | 693 | 192.9 |
| C | 13 | 3 | 419815 | 2173.01 | 699 | 693 | 192.9 |
| C | 12 | 252 | 169598 | 875.72 | 699 | 693 | 192.9 |
| D | 2 | 249 | 458164 | 2194.84 | 735 | 702 | 208.4 |
| D | 9 | 49 | 245997 | 1176.89 | 735 | 702 | 208.4 |
| D | 8 | 240 | 115880 | 552.61 | 735 | 702 | 208.4 |
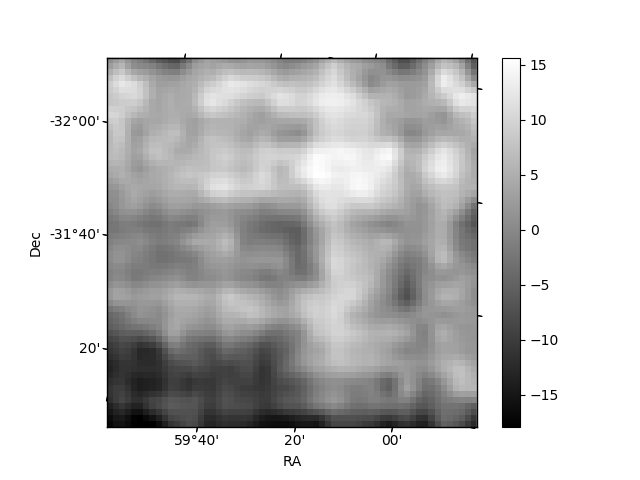
Histogram calculated using DETX and DETY for each event in the final _common_clean file
| Quadrant A |  |
 |
Quadrant B |
|---|---|---|---|
| Quadrant D | 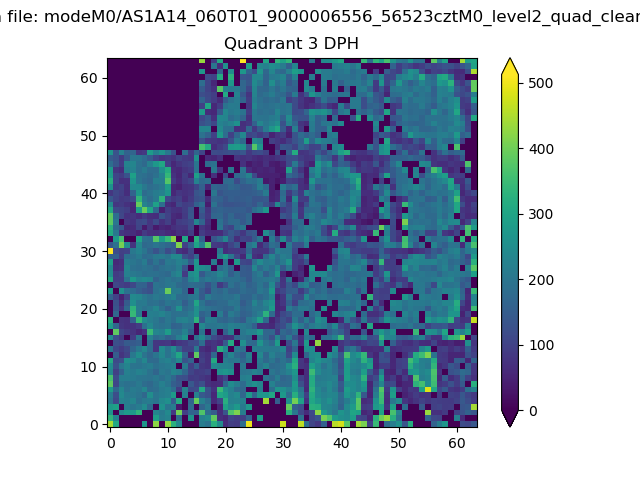 |
 |
Quadrant C |
| Plot type | Count rate plots | Images |
|---|---|---|
| Comparison with Poisson distribution Blue bars denote a histogram of data divided into 1 sec bins. Red curve is a Poisson curve with rate = median count rate of data. |
 |
 |
| Quadrant-wise count rates Data is divided into 100 sec bins |
 |
|
| Module-wise count rates for Quadrant A Data is divided into 100 sec bins |
 |
 |
| Module-wise count rates for Quadrant B Data is divided into 100 sec bins |
 |
 |
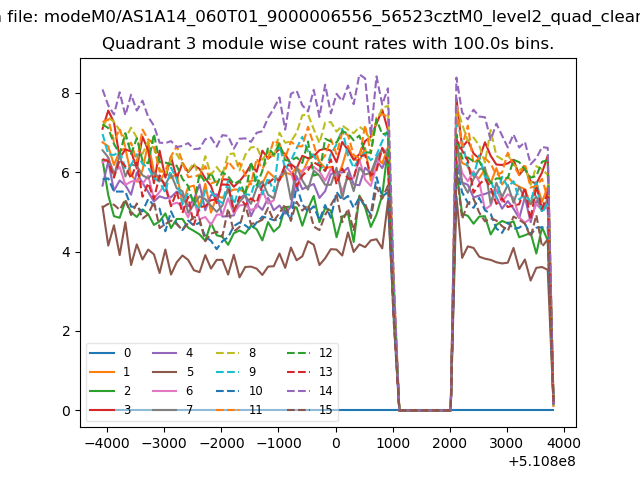
| Module-wise count rates for Quadrant C Data is divided into 100 sec bins |
 |
 |
| Module-wise count rates for Quadrant D Data is divided into 100 sec bins |
 |
 |
| Parameter | Plot |
|---|---|
| CZT HV Monitor | 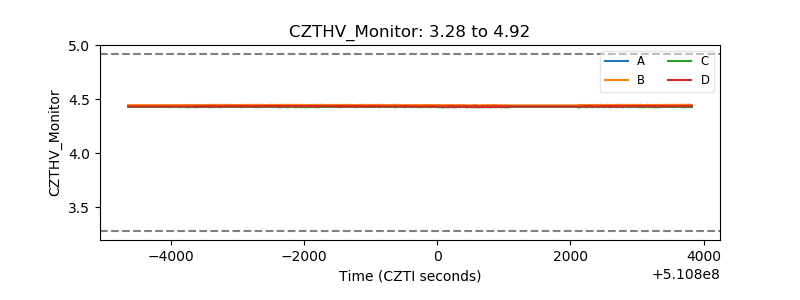 |
| D_VDD |  |
| Temperature 1 | 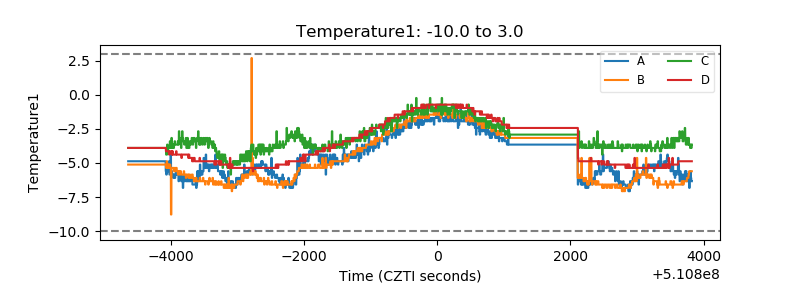 |
| Veto HV Monitor | 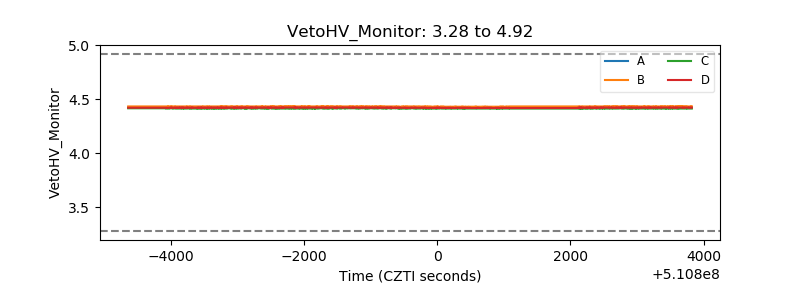 |
| Veto LLD |  |
| Alpha Counter |  |
| _CPM_Rate | 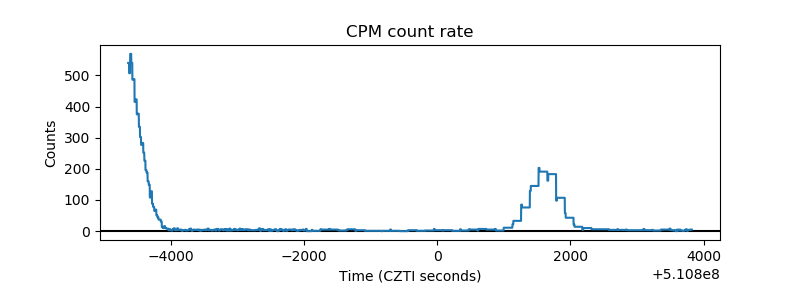 |
| CZT Counter | 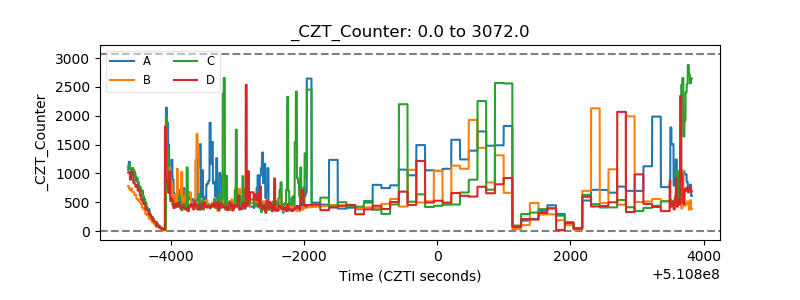 |
| +2.5 Volts monitor | 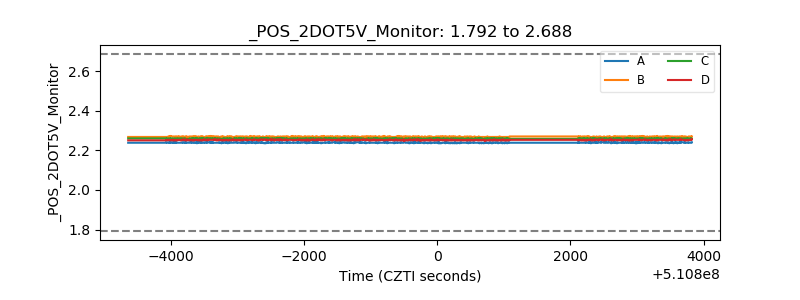 |
| +5 Volts monitor | 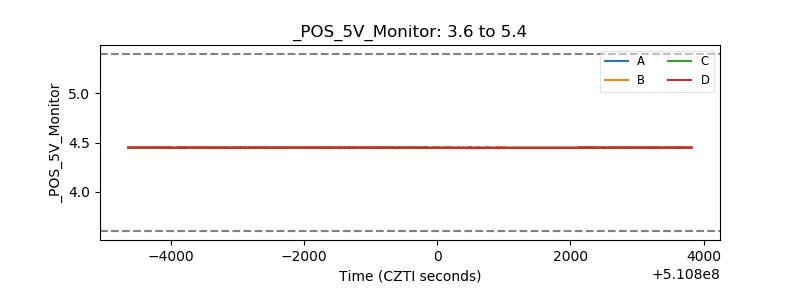 |
| _ROLL_ROT | 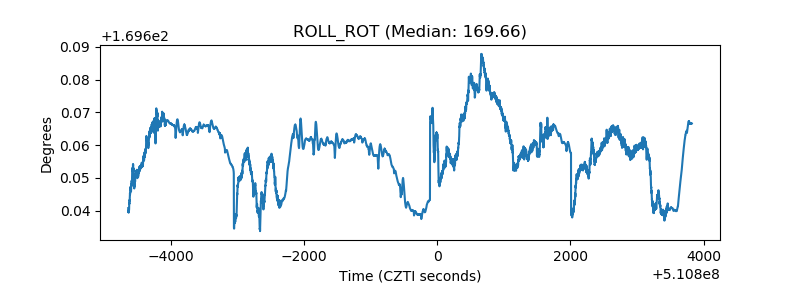 |
| _Roll_DEC | 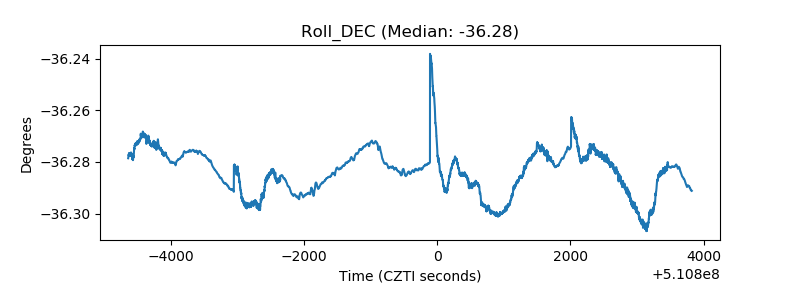 |
| _Roll_RA |  |
| Veto Counter | 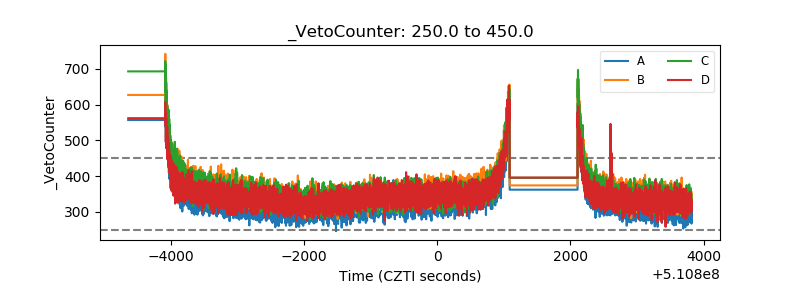 |