| Param | Original file | Final file |
|---|---|---|
| Filename | modeM0/AS1A14_060T01_9000006556_56526cztM0_level2.fits | modeM0/AS1A14_060T01_9000006556_56526cztM0_level2_quad_clean.evt |
| Size (bytes) | 868,432,320 | 97,865,280 |
| Size | 828.2 MB | 93.3 MB |
| Events in quadrant A | 5,210,205 | 737,056 |
| Events in quadrant B | 12,034,699 | 447,421 |
| Events in quadrant C | 6,512,457 | 649,044 |
| Events in quadrant D | 7,775,383 | 578,587 |
| Mode M0 | |||
|---|---|---|---|
| Quadrant | BADHDUFLAG | Total packets | Discarded packets |
| A | 0 | 21177 | 0 |
| B | 0 | 41143 | 0 |
| C | 0 | 24835 | 0 |
| D | 0 | 28498 | 0 |
| Mode SS | |||
|---|---|---|---|
| Quadrant | BADHDUFLAG | Total packets | Discarded packets |
| A | 0 | 158 | 0 |
| B | 0 | 158 | 0 |
| C | 0 | 158 | 0 |
| D | 0 | 158 | 0 |
| Quadrant | Total seconds | Saturated seconds | Saturation percentage |
|---|---|---|---|
| A | 7924 | 72 | 0.908632% |
| B | 7925 | 3772 | 47.596215% |
| C | 7925 | 839 | 10.586751% |
| D | 7925 | 1157 | 14.599369% |
Noise dominated data is calculated using 1-second bins in cleaned event files. If a bin has >2000 counts, and if more than 50% of those come from <1% of pixels, then it is considered to be noise-dominated and hence unusable.
| Quadrant | # 1 sec bins | Bins with >0 counts | Bins with >2000 counts | High rate bins dominated by noise | Noise dominated (total time) | Noise dominated (detector-on time) | Marked lightcurve |
|---|---|---|---|---|---|---|---|
| A | 7924 | 7924 | 56 | 56 | 0.71% | 0.71% | 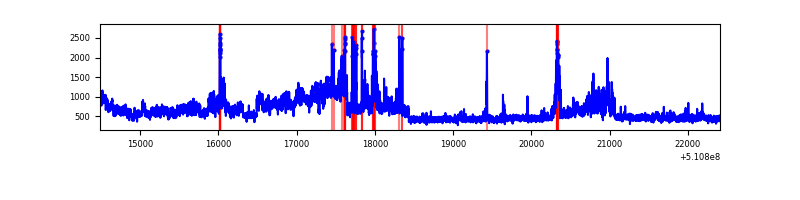 |
| B | 7925 | 7925 | 3206 | 3206 | 40.45% | 40.45% |  |
| C | 7925 | 7925 | 818 | 818 | 10.32% | 10.32% |  |
| D | 7925 | 7925 | 1180 | 1180 | 14.89% | 14.89% |  |
Top three noisy pixels from each quadrant. If the there are fewer than three noisy pixels in the level2.evt file, extra rows are filled as -1
| Pixel properties | Quadrant properties | ||||||
|---|---|---|---|---|---|---|---|
| Quadrant | DetID | PixID | Counts | Sigma | Mean | Median | Sigma |
| A | 0 | 12 | 1209526 | 5677.6 | 856 | 831 | 212.9 |
| A | 4 | 159 | 252641 | 1182.83 | 856 | 831 | 212.9 |
| A | 4 | 95 | 165024 | 771.26 | 856 | 831 | 212.9 |
| B | 4 | 206 | 8769779 | 62342.4 | 657 | 632 | 140.7 |
| B | 0 | 213 | 352489 | 2501.45 | 657 | 632 | 140.7 |
| B | 5 | 172 | 101613 | 717.9 | 657 | 632 | 140.7 |
| C | 15 | 230 | 2280303 | 10436.52 | 801 | 793 | 218.4 |
| C | 12 | 252 | 365393 | 1669.29 | 801 | 793 | 218.4 |
| C | 6 | 223 | 214123 | 976.71 | 801 | 793 | 218.4 |
| D | 8 | 240 | 2178646 | 9636.44 | 789 | 754 | 226.0 |
| D | 2 | 249 | 1337217 | 5913.4 | 789 | 754 | 226.0 |
| D | 3 | 12 | 226761 | 1000.0 | 789 | 754 | 226.0 |
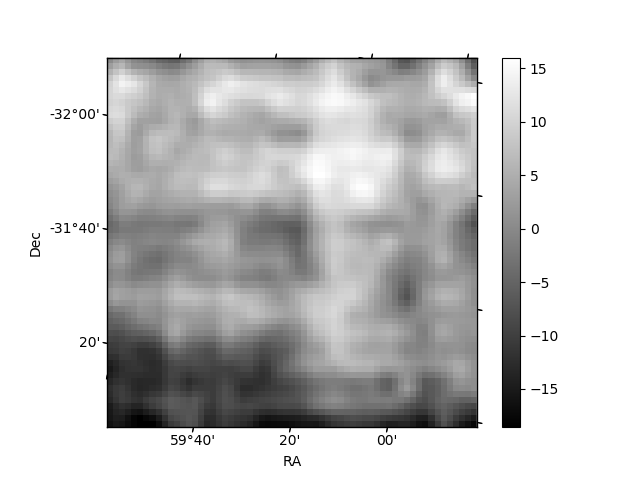
Histogram calculated using DETX and DETY for each event in the final _common_clean file
| Quadrant A |  |
 |
Quadrant B |
|---|---|---|---|
| Quadrant D | 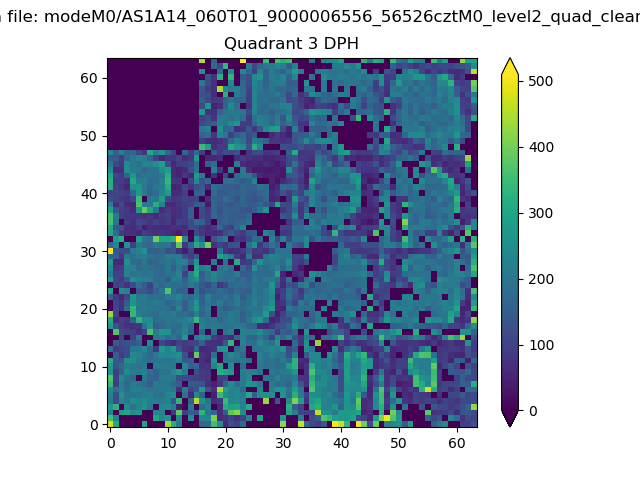 |
 |
Quadrant C |
| Plot type | Count rate plots | Images |
|---|---|---|
| Comparison with Poisson distribution Blue bars denote a histogram of data divided into 1 sec bins. Red curve is a Poisson curve with rate = median count rate of data. |
 |
 |
| Quadrant-wise count rates Data is divided into 100 sec bins |
 |
|
| Module-wise count rates for Quadrant A Data is divided into 100 sec bins |
 |
 |
| Module-wise count rates for Quadrant B Data is divided into 100 sec bins |
 |
 |
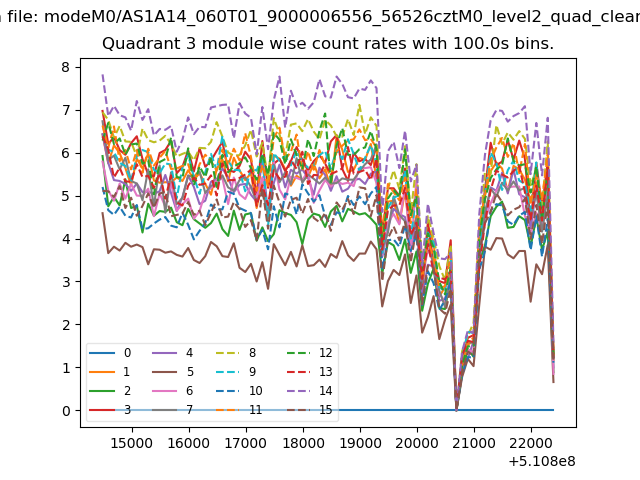
| Module-wise count rates for Quadrant C Data is divided into 100 sec bins |
 |
 |
| Module-wise count rates for Quadrant D Data is divided into 100 sec bins |
 |
 |
| Parameter | Plot |
|---|---|
| CZT HV Monitor | 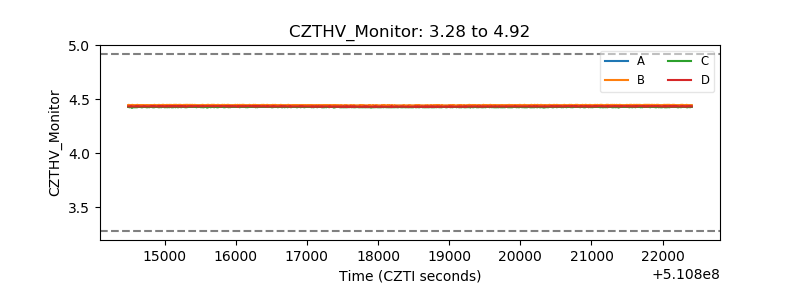 |
| D_VDD |  |
| Temperature 1 | 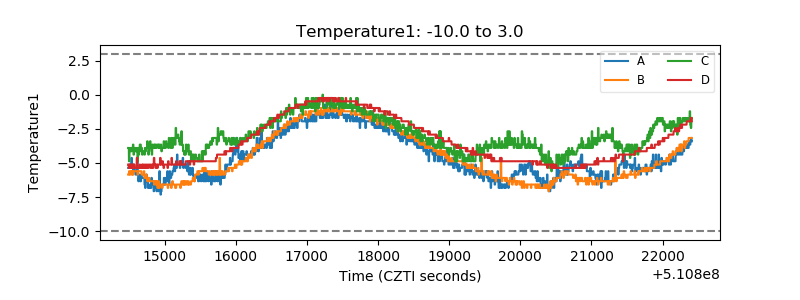 |
| Veto HV Monitor | 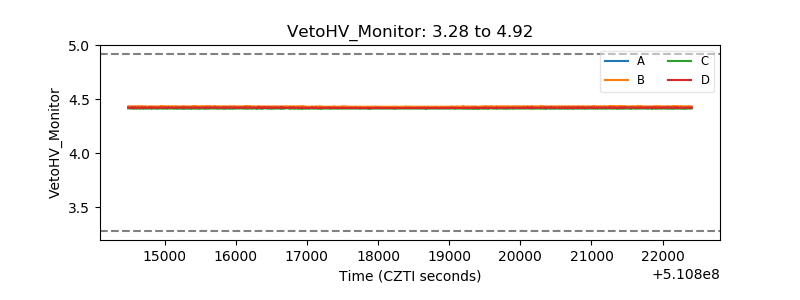 |
| Veto LLD |  |
| Alpha Counter |  |
| _CPM_Rate | 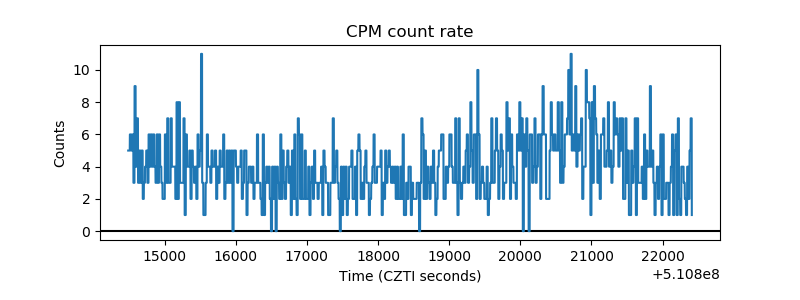 |
| CZT Counter | 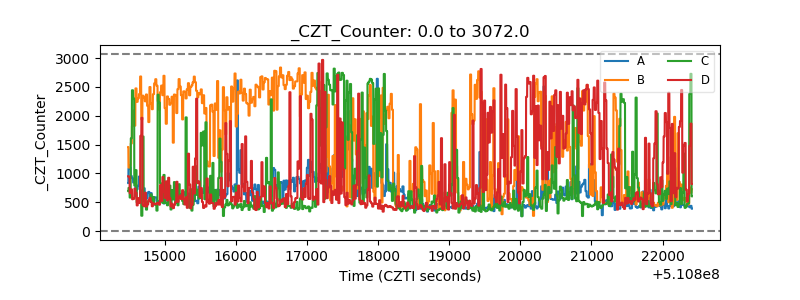 |
| +2.5 Volts monitor | 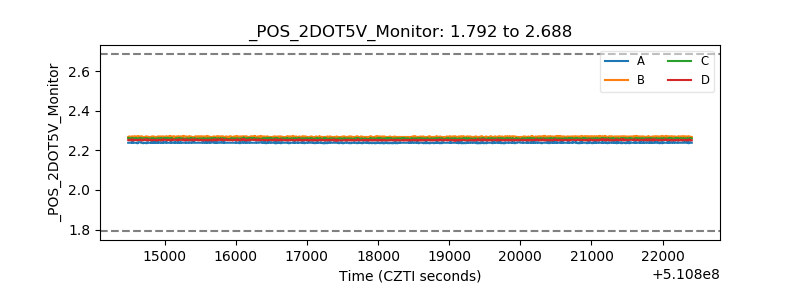 |
| +5 Volts monitor | 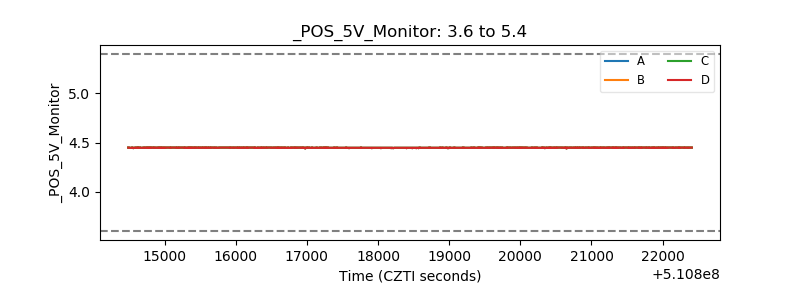 |
| _ROLL_ROT | 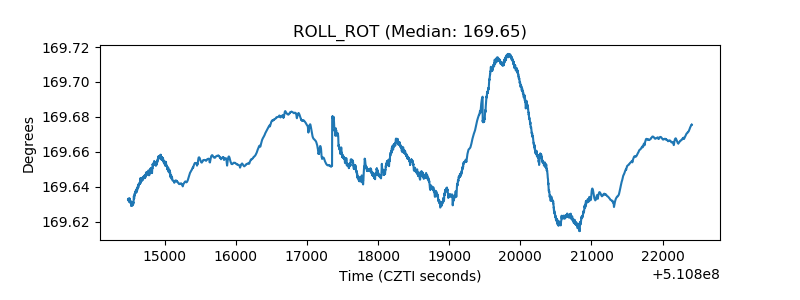 |
| _Roll_DEC | 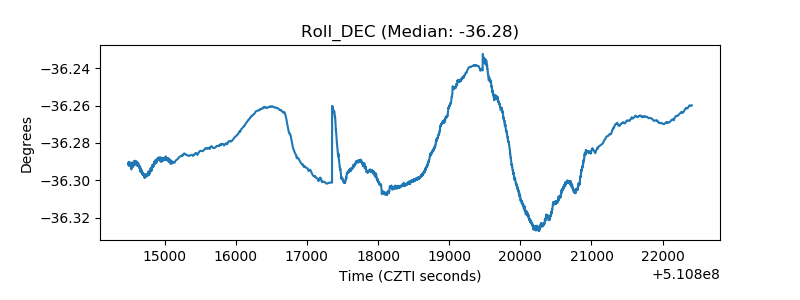 |
| _Roll_RA |  |
| Veto Counter | 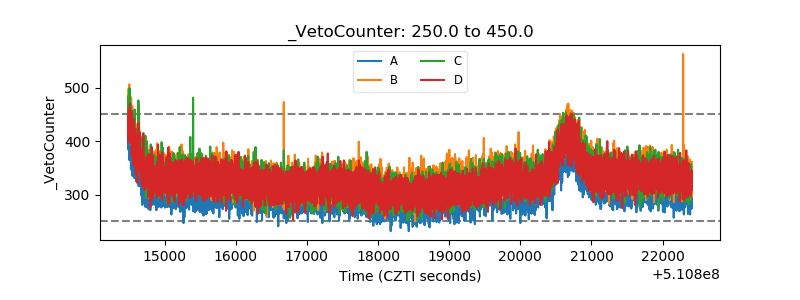 |