| Param | Original file | Final file |
|---|---|---|
| Filename | modeM0/AS1A14_060T01_9000006556_56527cztM0_level2.fits | modeM0/AS1A14_060T01_9000006556_56527cztM0_level2_quad_clean.evt |
| Size (bytes) | 723,185,280 | 101,790,720 |
| Size | 689.7 MB | 97.1 MB |
| Events in quadrant A | 4,518,756 | 716,877 |
| Events in quadrant B | 8,548,834 | 584,476 |
| Events in quadrant C | 6,624,933 | 630,695 |
| Events in quadrant D | 6,475,843 | 609,991 |
| Mode M0 | |||
|---|---|---|---|
| Quadrant | BADHDUFLAG | Total packets | Discarded packets |
| A | 0 | 18924 | 0 |
| B | 0 | 30719 | 2 |
| C | 0 | 25165 | 0 |
| D | 0 | 24574 | 0 |
| Mode SS | |||
|---|---|---|---|
| Quadrant | BADHDUFLAG | Total packets | Discarded packets |
| A | 0 | 156 | 0 |
| B | 0 | 156 | 0 |
| C | 0 | 156 | 0 |
| D | 0 | 156 | 0 |
| Quadrant | Total seconds | Saturated seconds | Saturation percentage |
|---|---|---|---|
| A | 7757 | 139 | 1.791930% |
| B | 7756 | 2156 | 27.797834% |
| C | 7757 | 955 | 12.311461% |
| D | 7757 | 682 | 8.792059% |
Noise dominated data is calculated using 1-second bins in cleaned event files. If a bin has >2000 counts, and if more than 50% of those come from <1% of pixels, then it is considered to be noise-dominated and hence unusable.
| Quadrant | # 1 sec bins | Bins with >0 counts | Bins with >2000 counts | High rate bins dominated by noise | Noise dominated (total time) | Noise dominated (detector-on time) | Marked lightcurve |
|---|---|---|---|---|---|---|---|
| A | 7757 | 7757 | 65 | 65 | 0.84% | 0.84% |  |
| B | 7756 | 7756 | 1265 | 1265 | 16.31% | 16.31% |  |
| C | 7757 | 7757 | 884 | 884 | 11.40% | 11.40% |  |
| D | 7757 | 7757 | 659 | 659 | 8.50% | 8.50% | 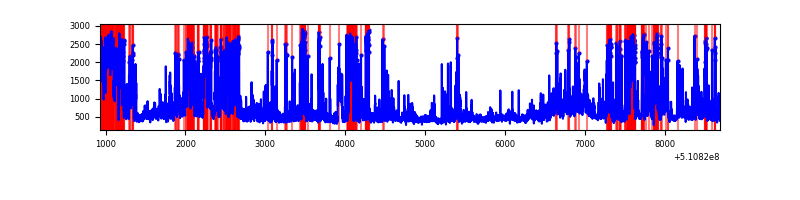 |
Top three noisy pixels from each quadrant. If the there are fewer than three noisy pixels in the level2.evt file, extra rows are filled as -1
| Pixel properties | Quadrant properties | ||||||
|---|---|---|---|---|---|---|---|
| Quadrant | DetID | PixID | Counts | Sigma | Mean | Median | Sigma |
| A | 7 | 64 | 549973 | 2637.61 | 841 | 821 | 208.2 |
| A | 4 | 159 | 270161 | 1293.65 | 841 | 821 | 208.2 |
| A | 3 | 14 | 112215 | 535.03 | 841 | 821 | 208.2 |
| B | 4 | 206 | 4623669 | 28515.84 | 745 | 717 | 162.1 |
| B | 0 | 213 | 596063 | 3672.28 | 745 | 717 | 162.1 |
| B | 5 | 172 | 141547 | 868.68 | 745 | 717 | 162.1 |
| C | 15 | 230 | 2838520 | 13311.15 | 782 | 775 | 213.2 |
| C | 12 | 252 | 321117 | 1502.64 | 782 | 775 | 213.2 |
| C | 6 | 223 | 104969 | 488.75 | 782 | 775 | 213.2 |
| D | 2 | 249 | 1244502 | 5553.29 | 790 | 756 | 224.0 |
| D | 8 | 240 | 761090 | 3394.87 | 790 | 756 | 224.0 |
| D | 8 | 129 | 312994 | 1394.13 | 790 | 756 | 224.0 |
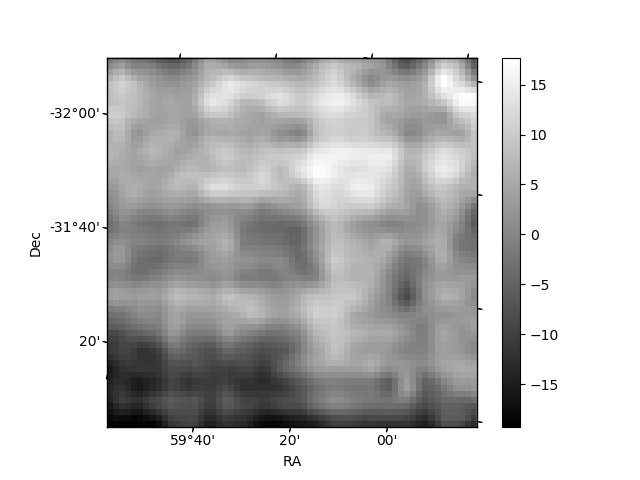
Histogram calculated using DETX and DETY for each event in the final _common_clean file
| Quadrant A |  |
 |
Quadrant B |
|---|---|---|---|
| Quadrant D | 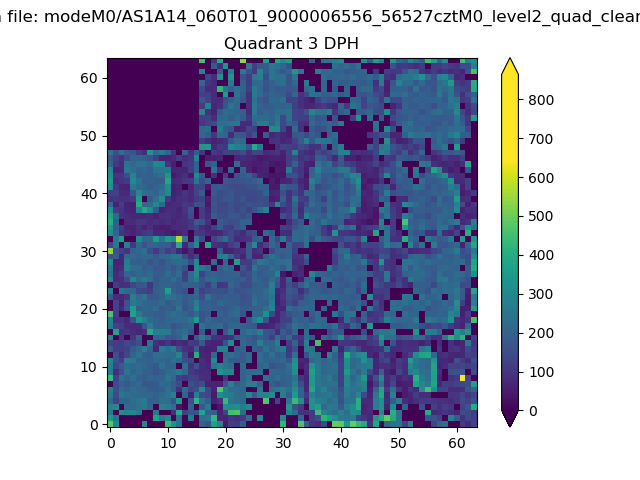 |
 |
Quadrant C |
| Plot type | Count rate plots | Images |
|---|---|---|
| Comparison with Poisson distribution Blue bars denote a histogram of data divided into 1 sec bins. Red curve is a Poisson curve with rate = median count rate of data. |
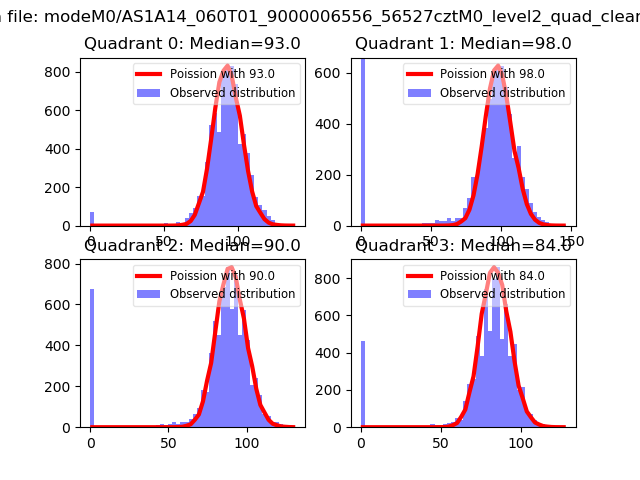 |
 |
| Quadrant-wise count rates Data is divided into 100 sec bins |
 |
|
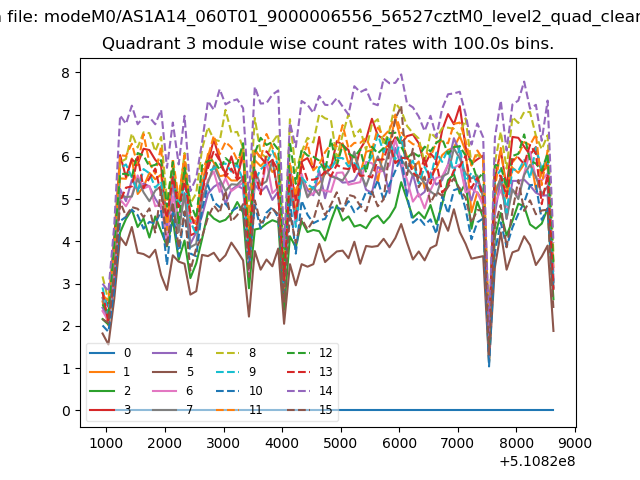
| Module-wise count rates for Quadrant A Data is divided into 100 sec bins |
 |
 |
| Module-wise count rates for Quadrant B Data is divided into 100 sec bins |
 |
 |
| Module-wise count rates for Quadrant C Data is divided into 100 sec bins |
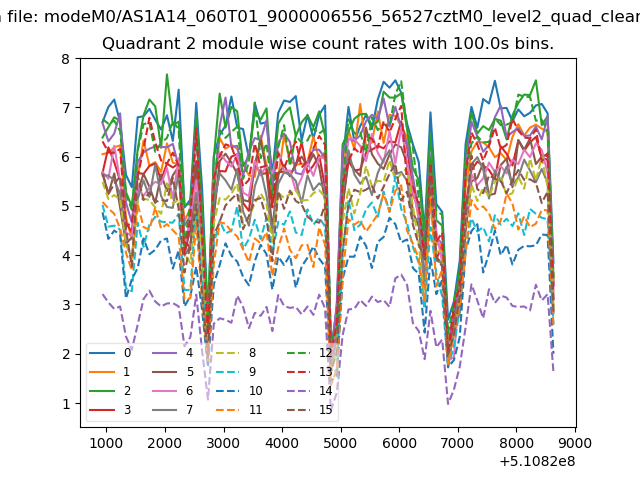 |
 |
| Module-wise count rates for Quadrant D Data is divided into 100 sec bins |
 |
 |
| Parameter | Plot |
|---|---|
| CZT HV Monitor | 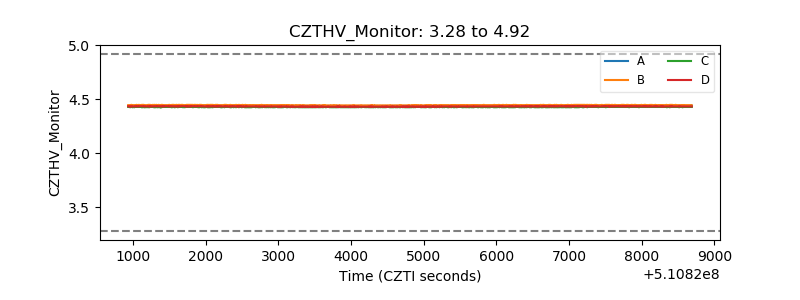 |
| D_VDD |  |
| Temperature 1 | 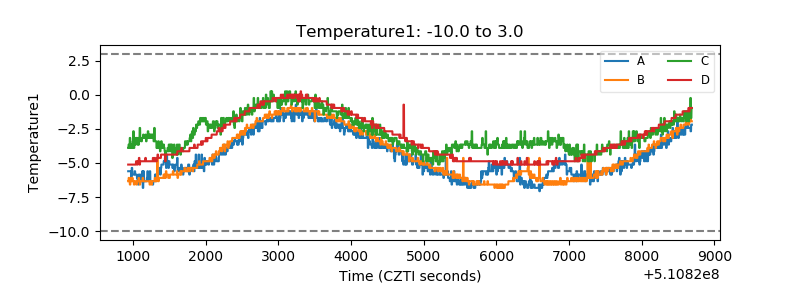 |
| Veto HV Monitor | 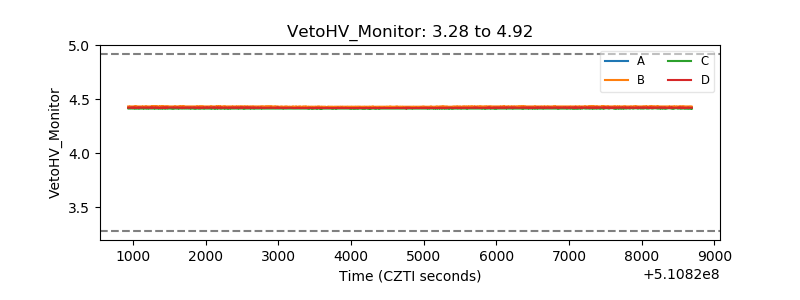 |
| Veto LLD |  |
| Alpha Counter |  |
| _CPM_Rate |  |
| CZT Counter | 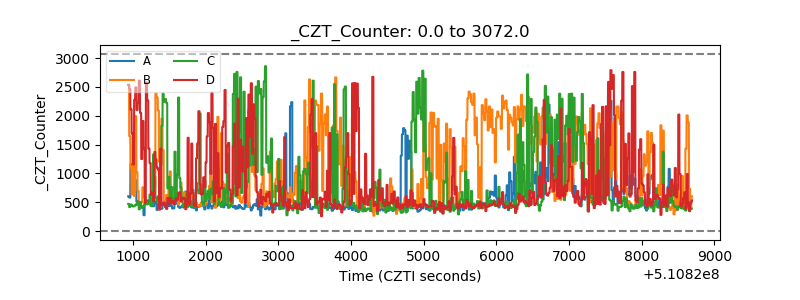 |
| +2.5 Volts monitor | 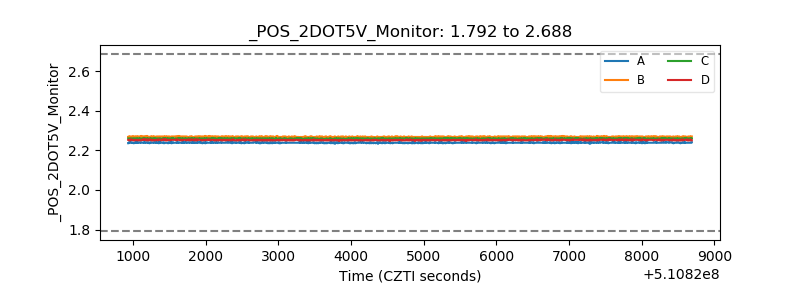 |
| +5 Volts monitor | 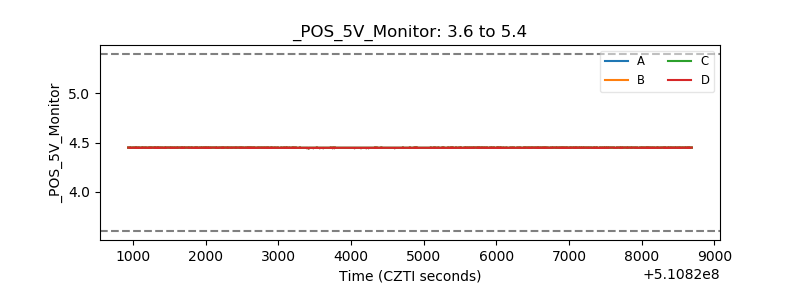 |
| _ROLL_ROT | 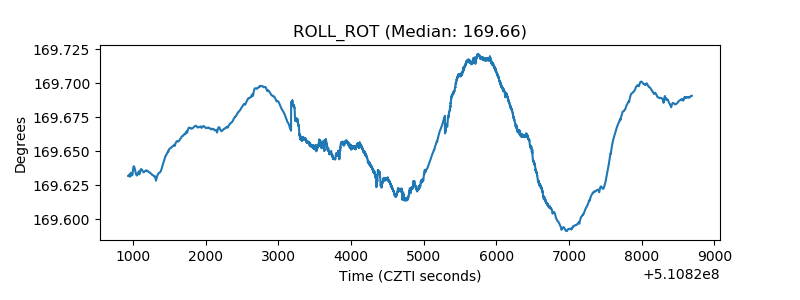 |
| _Roll_DEC | 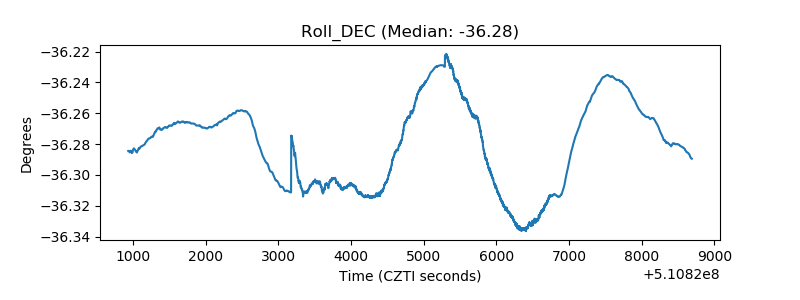 |
| _Roll_RA |  |
| Veto Counter | 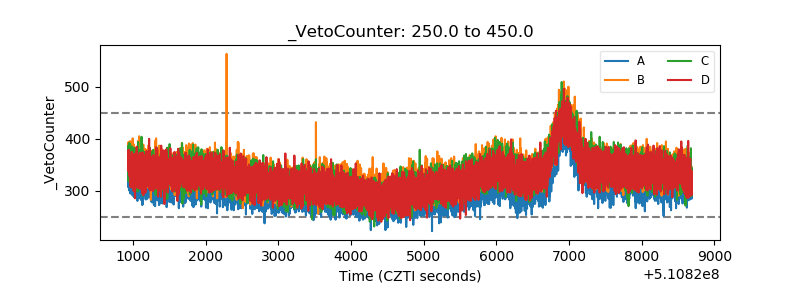 |