| Param | Original file | Final file |
|---|---|---|
| Filename | modeM0/AS1A14_060T01_9000006556_56531cztM0_level2.fits | modeM0/AS1A14_060T01_9000006556_56531cztM0_level2_quad_clean.evt |
| Size (bytes) | 475,876,800 | 84,072,960 |
| Size | 453.8 MB | 80.2 MB |
| Events in quadrant A | 4,116,791 | 542,579 |
| Events in quadrant B | 6,495,776 | 536,067 |
| Events in quadrant C | 3,162,715 | 538,798 |
| Events in quadrant D | 3,370,052 | 505,838 |
| Mode M0 | |||
|---|---|---|---|
| Quadrant | BADHDUFLAG | Total packets | Discarded packets |
| A | 0 | 16206 | 3 |
| B | 0 | 23485 | 1 |
| C | 0 | 13920 | 1 |
| D | 0 | 14391 | 1 |
| Mode M9 | |||
|---|---|---|---|
| Quadrant | BADHDUFLAG | Total packets | Discarded packets |
| A | 0 | 9 | 0 |
| B | 0 | 9 | 0 |
| C | 0 | 9 | 0 |
| D | 0 | 9 | 0 |
| Mode SS | |||
|---|---|---|---|
| Quadrant | BADHDUFLAG | Total packets | Discarded packets |
| A | 0 | 122 | 0 |
| B | 0 | 122 | 0 |
| C | 0 | 122 | 0 |
| D | 0 | 122 | 0 |
| Quadrant | Total seconds | Saturated seconds | Saturation percentage |
|---|---|---|---|
| A | 6045 | 358 | 5.922250% |
| B | 6045 | 1090 | 18.031431% |
| C | 6046 | 146 | 2.414820% |
| D | 6046 | 141 | 2.332120% |
Noise dominated data is calculated using 1-second bins in cleaned event files. If a bin has >2000 counts, and if more than 50% of those come from <1% of pixels, then it is considered to be noise-dominated and hence unusable.
| Quadrant | # 1 sec bins | Bins with >0 counts | Bins with >2000 counts | High rate bins dominated by noise | Noise dominated (total time) | Noise dominated (detector-on time) | Marked lightcurve |
|---|---|---|---|---|---|---|---|
| A | 6910 | 6046 | 333 | 333 | 4.82% | 5.51% | 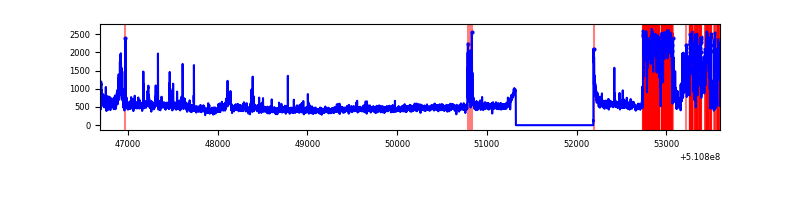 |
| B | 6910 | 6046 | 628 | 628 | 9.09% | 10.39% |  |
| C | 6911 | 6047 | 134 | 134 | 1.94% | 2.22% |  |
| D | 6911 | 6047 | 137 | 137 | 1.98% | 2.27% |  |
Top three noisy pixels from each quadrant. If the there are fewer than three noisy pixels in the level2.evt file, extra rows are filled as -1
| Pixel properties | Quadrant properties | ||||||
|---|---|---|---|---|---|---|---|
| Quadrant | DetID | PixID | Counts | Sigma | Mean | Median | Sigma |
| A | 4 | 95 | 1091948 | 6793.18 | 643 | 626 | 160.6 |
| A | 3 | 14 | 309916 | 1925.24 | 643 | 626 | 160.6 |
| A | 4 | 3 | 71883 | 443.56 | 643 | 626 | 160.6 |
| B | 4 | 206 | 2506292 | 19022.33 | 609 | 589 | 131.7 |
| B | 4 | 171 | 592828 | 4496.05 | 609 | 589 | 131.7 |
| B | 10 | 44 | 231794 | 1755.22 | 609 | 589 | 131.7 |
| C | 12 | 252 | 600148 | 3492.55 | 621 | 617 | 171.7 |
| C | 12 | 254 | 34866 | 199.52 | 621 | 617 | 171.7 |
| C | 14 | 254 | 27759 | 158.11 | 621 | 617 | 171.7 |
| D | 2 | 120 | 249055 | 1391.23 | 620 | 593 | 178.6 |
| D | 8 | 129 | 125441 | 699.07 | 620 | 593 | 178.6 |
| D | 8 | 240 | 100705 | 560.56 | 620 | 593 | 178.6 |
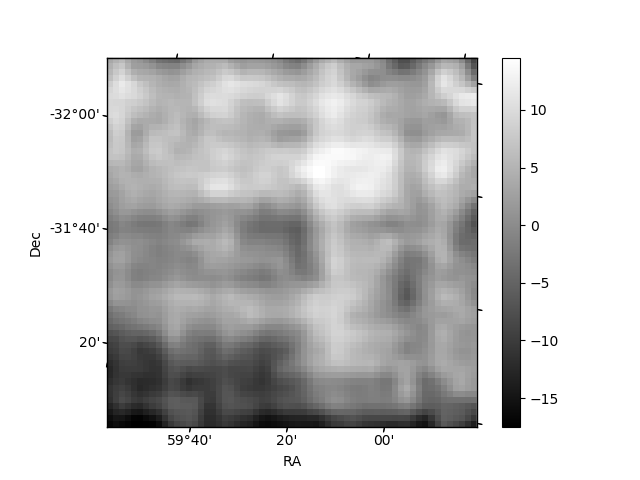
Histogram calculated using DETX and DETY for each event in the final _common_clean file
| Quadrant A |  |
 |
Quadrant B |
|---|---|---|---|
| Quadrant D | 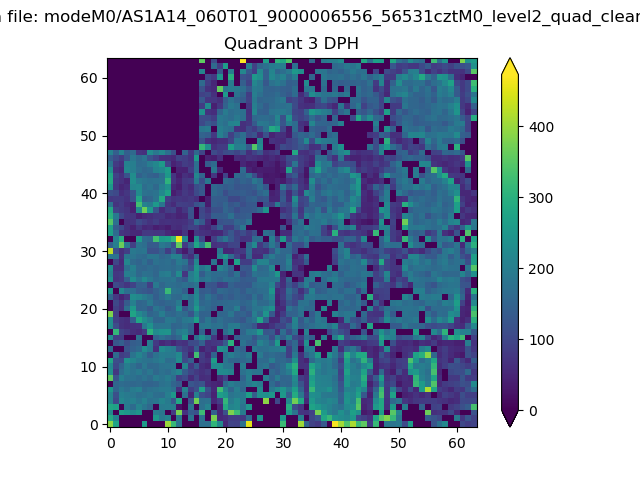 |
 |
Quadrant C |
| Plot type | Count rate plots | Images |
|---|---|---|
| Comparison with Poisson distribution Blue bars denote a histogram of data divided into 1 sec bins. Red curve is a Poisson curve with rate = median count rate of data. |
 |
 |
| Quadrant-wise count rates Data is divided into 100 sec bins |
 |
|
| Module-wise count rates for Quadrant A Data is divided into 100 sec bins |
 |
 |
| Module-wise count rates for Quadrant B Data is divided into 100 sec bins |
 |
 |
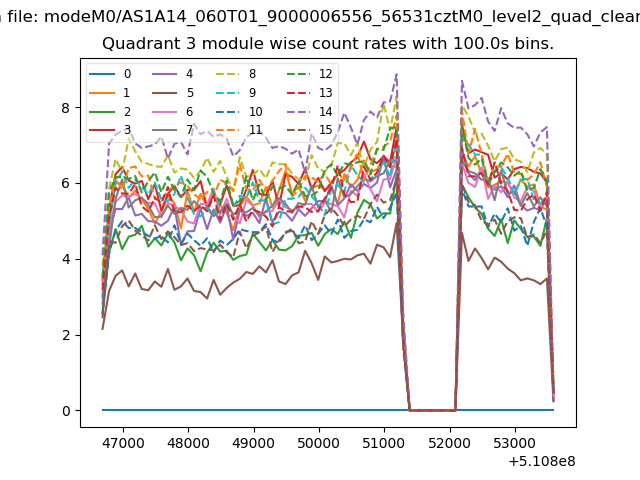
| Module-wise count rates for Quadrant C Data is divided into 100 sec bins |
 |
 |
| Module-wise count rates for Quadrant D Data is divided into 100 sec bins |
 |
 |
| Parameter | Plot |
|---|---|
| CZT HV Monitor | 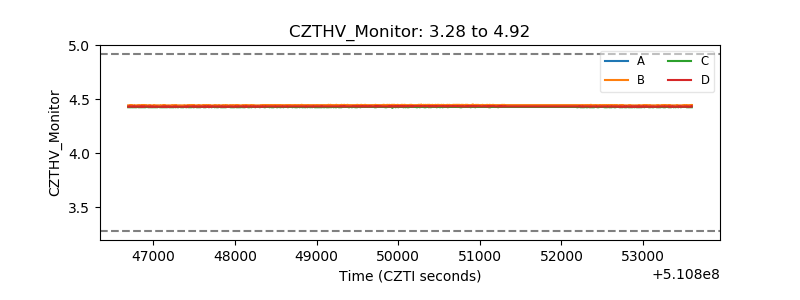 |
| D_VDD |  |
| Temperature 1 | 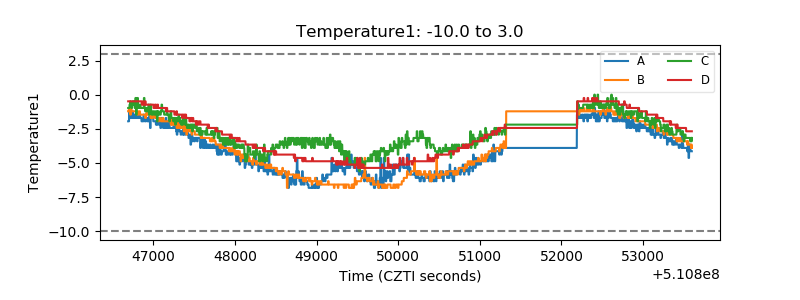 |
| Veto HV Monitor | 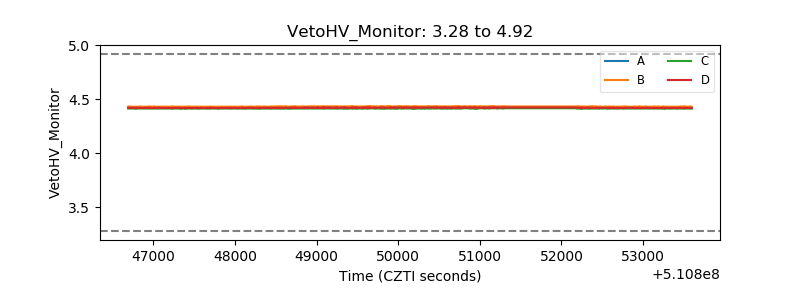 |
| Veto LLD |  |
| Alpha Counter |  |
| _CPM_Rate | 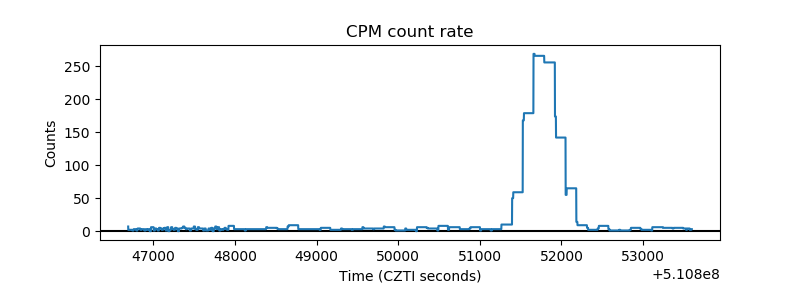 |
| CZT Counter | 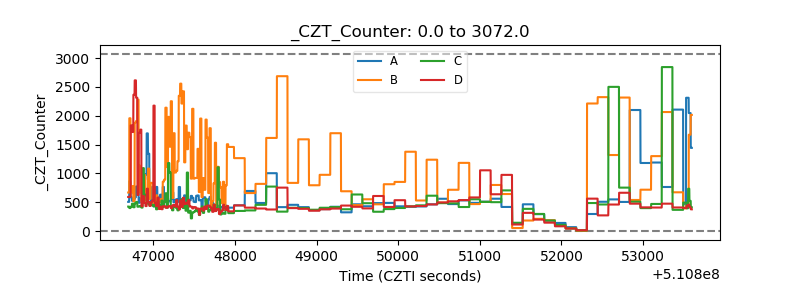 |
| +2.5 Volts monitor | 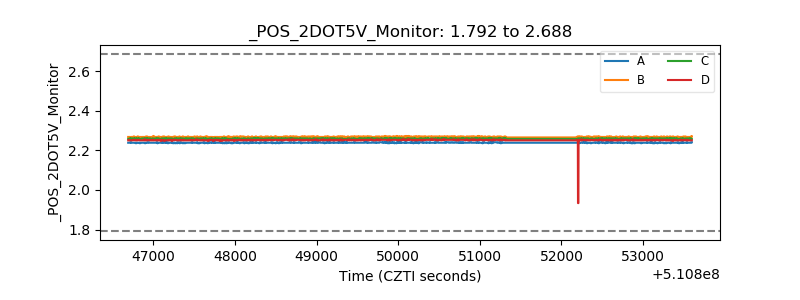 |
| +5 Volts monitor | 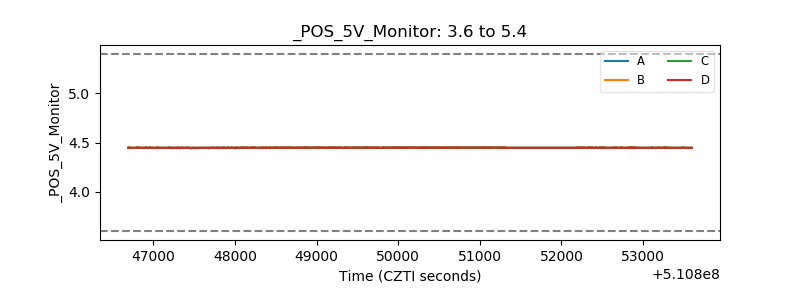 |
| _ROLL_ROT | 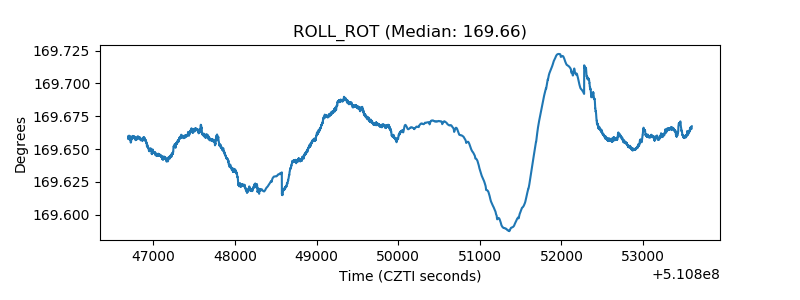 |
| _Roll_DEC | 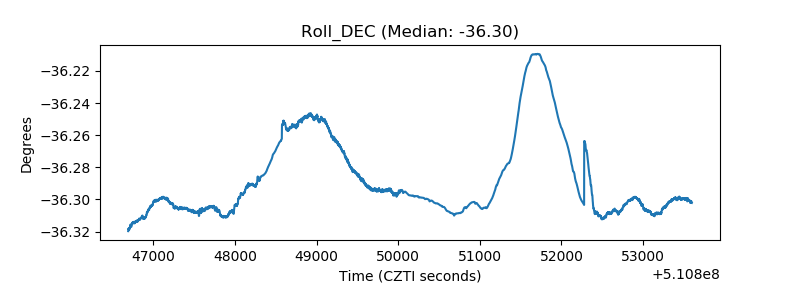 |
| _Roll_RA |  |
| Veto Counter | 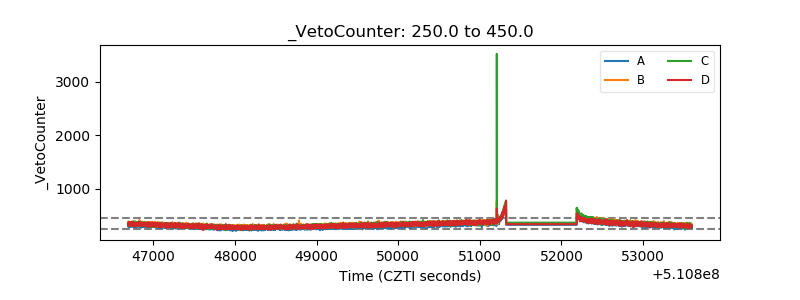 |