| Param | Original file | Final file |
|---|---|---|
| Filename | modeM0/AS1A14_060T01_9000006556_56535cztM0_level2.fits | modeM0/AS1A14_060T01_9000006556_56535cztM0_level2_quad_clean.evt |
| Size (bytes) | 458,331,840 | 96,269,760 |
| Size | 437.1 MB | 91.8 MB |
| Events in quadrant A | 4,359,919 | 618,662 |
| Events in quadrant B | 3,806,801 | 692,499 |
| Events in quadrant C | 4,026,577 | 600,888 |
| Events in quadrant D | 4,274,291 | 555,504 |
| Mode M0 | |||
|---|---|---|---|
| Quadrant | BADHDUFLAG | Total packets | Discarded packets |
| A | 0 | 17387 | 2 |
| B | 0 | 15644 | 3 |
| C | 0 | 16524 | 2 |
| D | 0 | 17165 | 2 |
| Mode M9 | |||
|---|---|---|---|
| Quadrant | BADHDUFLAG | Total packets | Discarded packets |
| A | 0 | 16 | 0 |
| B | 0 | 17 | 0 |
| C | 0 | 17 | 0 |
| D | 0 | 17 | 0 |
| Mode SS | |||
|---|---|---|---|
| Quadrant | BADHDUFLAG | Total packets | Discarded packets |
| A | 0 | 130 | 0 |
| B | 0 | 130 | 0 |
| C | 0 | 130 | 0 |
| D | 0 | 130 | 0 |
| Quadrant | Total seconds | Saturated seconds | Saturation percentage |
|---|---|---|---|
| A | 6415 | 331 | 5.159782% |
| B | 6414 | 115 | 1.792953% |
| C | 6414 | 250 | 3.897724% |
| D | 6414 | 245 | 3.819769% |
Noise dominated data is calculated using 1-second bins in cleaned event files. If a bin has >2000 counts, and if more than 50% of those come from <1% of pixels, then it is considered to be noise-dominated and hence unusable.
| Quadrant | # 1 sec bins | Bins with >0 counts | Bins with >2000 counts | High rate bins dominated by noise | Noise dominated (total time) | Noise dominated (detector-on time) | Marked lightcurve |
|---|---|---|---|---|---|---|---|
| A | 7615 | 6416 | 289 | 289 | 3.80% | 4.50% |  |
| B | 7614 | 6415 | 57 | 57 | 0.75% | 0.89% |  |
| C | 7614 | 6415 | 236 | 236 | 3.10% | 3.68% |  |
| D | 7614 | 6415 | 222 | 222 | 2.92% | 3.46% |  |
Top three noisy pixels from each quadrant. If the there are fewer than three noisy pixels in the level2.evt file, extra rows are filled as -1
| Pixel properties | Quadrant properties | ||||||
|---|---|---|---|---|---|---|---|
| Quadrant | DetID | PixID | Counts | Sigma | Mean | Median | Sigma |
| A | 4 | 249 | 1233106 | 7112.28 | 696 | 677 | 173.3 |
| A | 4 | 95 | 311810 | 1795.53 | 696 | 677 | 173.3 |
| A | 4 | 3 | 30672 | 173.1 | 696 | 677 | 173.3 |
| B | 4 | 171 | 332681 | 2201.71 | 706 | 682 | 150.8 |
| B | 0 | 63 | 192823 | 1274.22 | 706 | 682 | 150.8 |
| B | 10 | 247 | 191495 | 1265.41 | 706 | 682 | 150.8 |
| C | 12 | 252 | 678908 | 3635.15 | 678 | 672 | 186.6 |
| C | 15 | 230 | 345358 | 1847.42 | 678 | 672 | 186.6 |
| C | 6 | 223 | 137176 | 731.62 | 678 | 672 | 186.6 |
| D | 2 | 249 | 924140 | 4795.49 | 667 | 638 | 192.6 |
| D | 8 | 240 | 181279 | 938.02 | 667 | 638 | 192.6 |
| D | 8 | 129 | 118552 | 612.29 | 667 | 638 | 192.6 |
Histogram calculated using DETX and DETY for each event in the final _common_clean file
| Quadrant A |  |
 |
Quadrant B |
|---|---|---|---|
| Quadrant D | 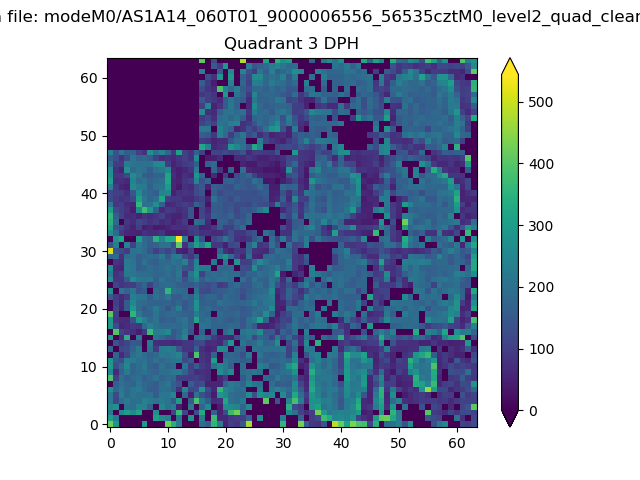 |
 |
Quadrant C |
| Plot type | Count rate plots | Images |
|---|---|---|
| Comparison with Poisson distribution Blue bars denote a histogram of data divided into 1 sec bins. Red curve is a Poisson curve with rate = median count rate of data. |
 |
 |
| Quadrant-wise count rates Data is divided into 100 sec bins |
 |
|
| Module-wise count rates for Quadrant A Data is divided into 100 sec bins |
 |
 |
| Module-wise count rates for Quadrant B Data is divided into 100 sec bins |
 |
 |
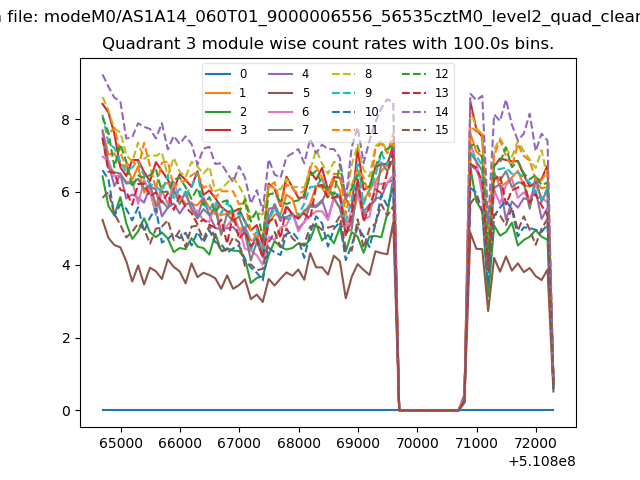
| Module-wise count rates for Quadrant C Data is divided into 100 sec bins |
 |
 |
| Module-wise count rates for Quadrant D Data is divided into 100 sec bins |
 |
 |
| Parameter | Plot |
|---|---|
| CZT HV Monitor | 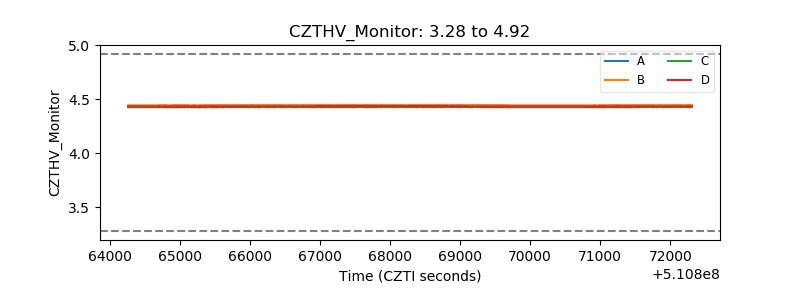 |
| D_VDD |  |
| Temperature 1 | 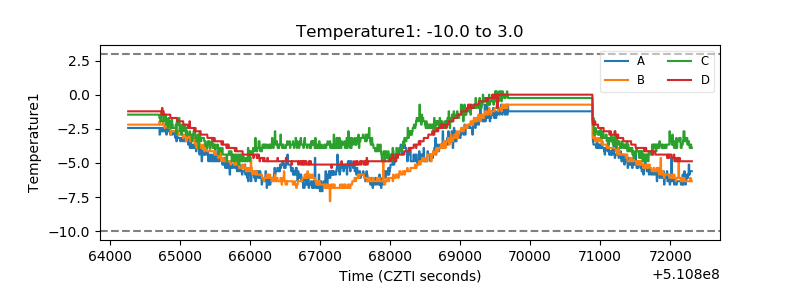 |
| Veto HV Monitor | 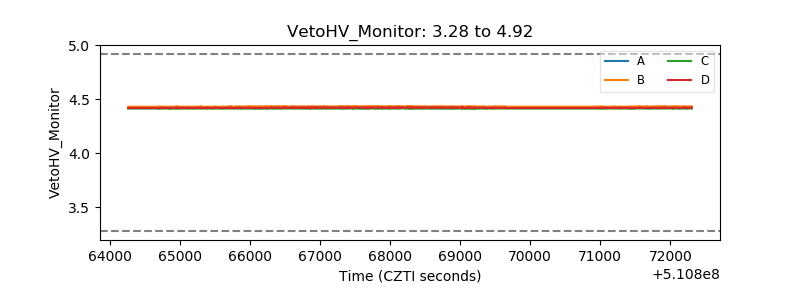 |
| Veto LLD |  |
| Alpha Counter |  |
| _CPM_Rate | 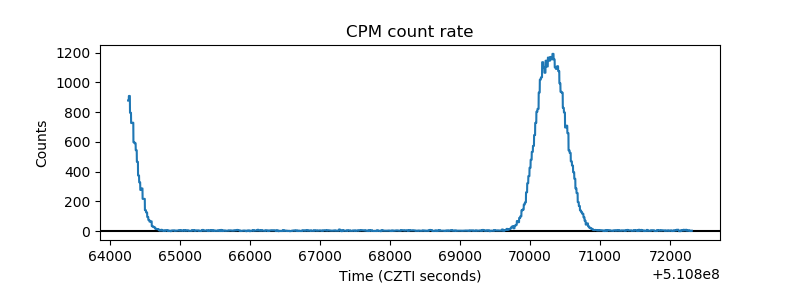 |
| CZT Counter | 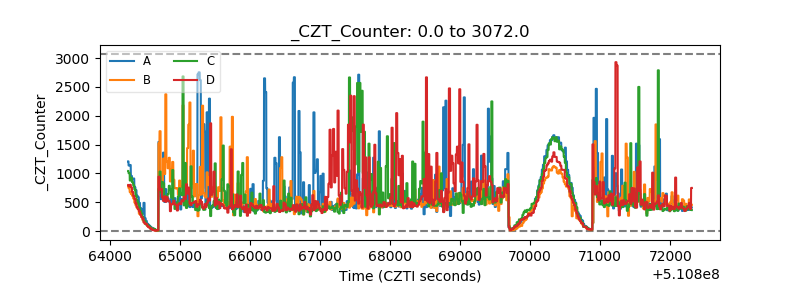 |
| +2.5 Volts monitor | 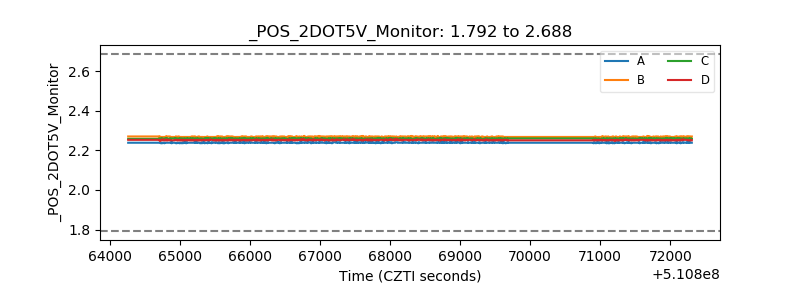 |
| +5 Volts monitor | 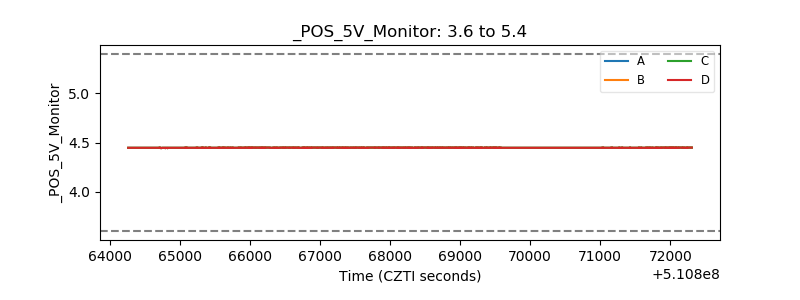 |
| _ROLL_ROT | 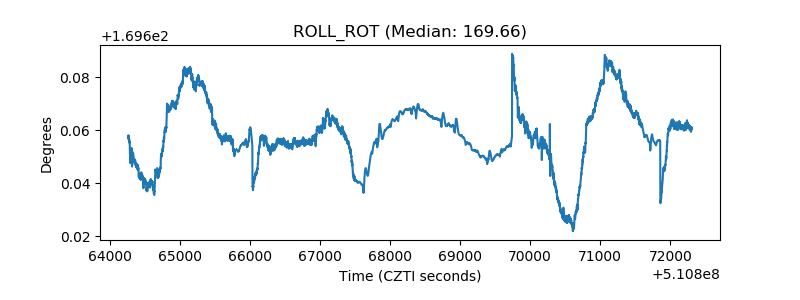 |
| _Roll_DEC |  |
| _Roll_RA |  |
| Veto Counter | 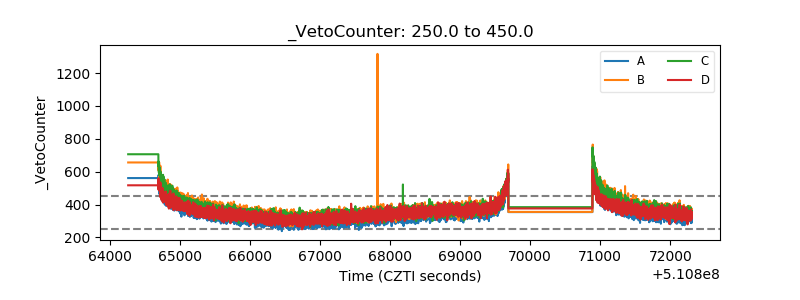 |