| Param | Original file | Final file |
|---|---|---|
| Filename | modeM0/AS1A14_060T01_9000006556_56537cztM0_level2.fits | modeM0/AS1A14_060T01_9000006556_56537cztM0_level2_quad_clean.evt |
| Size (bytes) | 391,141,440 | 93,856,320 |
| Size | 373.0 MB | 89.5 MB |
| Events in quadrant A | 3,543,523 | 606,433 |
| Events in quadrant B | 3,413,460 | 672,362 |
| Events in quadrant C | 3,646,873 | 578,710 |
| Events in quadrant D | 3,384,481 | 544,378 |
| Mode M0 | |||
|---|---|---|---|
| Quadrant | BADHDUFLAG | Total packets | Discarded packets |
| A | 0 | 14679 | 2 |
| B | 0 | 14479 | 2 |
| C | 0 | 15334 | 2 |
| D | 0 | 14466 | 2 |
| Mode M9 | |||
|---|---|---|---|
| Quadrant | BADHDUFLAG | Total packets | Discarded packets |
| A | 0 | 17 | 0 |
| B | 0 | 17 | 0 |
| C | 0 | 17 | 0 |
| D | 0 | 17 | 0 |
| Mode SS | |||
|---|---|---|---|
| Quadrant | BADHDUFLAG | Total packets | Discarded packets |
| A | 0 | 130 | 0 |
| B | 0 | 130 | 0 |
| C | 0 | 130 | 0 |
| D | 0 | 130 | 0 |
| Quadrant | Total seconds | Saturated seconds | Saturation percentage |
|---|---|---|---|
| A | 6300 | 172 | 2.730159% |
| B | 6300 | 96 | 1.523810% |
| C | 6299 | 254 | 4.032386% |
| D | 6299 | 129 | 2.047944% |
Noise dominated data is calculated using 1-second bins in cleaned event files. If a bin has >2000 counts, and if more than 50% of those come from <1% of pixels, then it is considered to be noise-dominated and hence unusable.
| Quadrant | # 1 sec bins | Bins with >0 counts | Bins with >2000 counts | High rate bins dominated by noise | Noise dominated (total time) | Noise dominated (detector-on time) | Marked lightcurve |
|---|---|---|---|---|---|---|---|
| A | 7455 | 6301 | 102 | 102 | 1.37% | 1.62% |  |
| B | 7455 | 6301 | 25 | 25 | 0.34% | 0.40% | 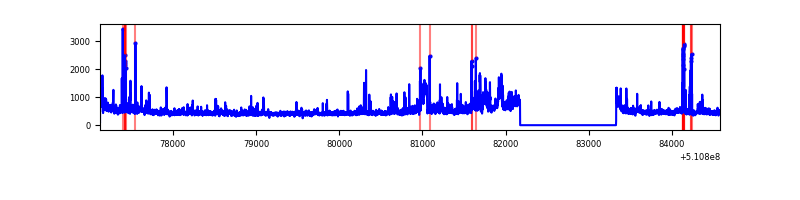 |
| C | 7454 | 6300 | 228 | 228 | 3.06% | 3.62% | 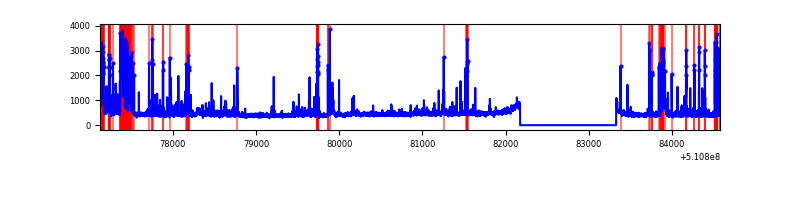 |
| D | 7454 | 6300 | 83 | 83 | 1.11% | 1.32% |  |
Top three noisy pixels from each quadrant. If the there are fewer than three noisy pixels in the level2.evt file, extra rows are filled as -1
| Pixel properties | Quadrant properties | ||||||
|---|---|---|---|---|---|---|---|
| Quadrant | DetID | PixID | Counts | Sigma | Mean | Median | Sigma |
| A | 7 | 64 | 300991 | 1749.83 | 692 | 675 | 171.6 |
| A | 13 | 153 | 250831 | 1457.57 | 692 | 675 | 171.6 |
| A | 4 | 95 | 110031 | 637.18 | 692 | 675 | 171.6 |
| B | 5 | 172 | 174430 | 1172.3 | 695 | 671 | 148.2 |
| B | 10 | 246 | 87414 | 585.23 | 695 | 671 | 148.2 |
| B | 4 | 206 | 79822 | 534.0 | 695 | 671 | 148.2 |
| C | 12 | 252 | 782884 | 4308.1 | 669 | 662 | 181.6 |
| C | 14 | 254 | 138881 | 761.24 | 669 | 662 | 181.6 |
| C | 6 | 223 | 89405 | 488.75 | 669 | 662 | 181.6 |
| D | 2 | 249 | 294951 | 1540.93 | 668 | 636 | 191.0 |
| D | 8 | 240 | 128582 | 669.88 | 668 | 636 | 191.0 |
| D | 8 | 129 | 101212 | 526.58 | 668 | 636 | 191.0 |
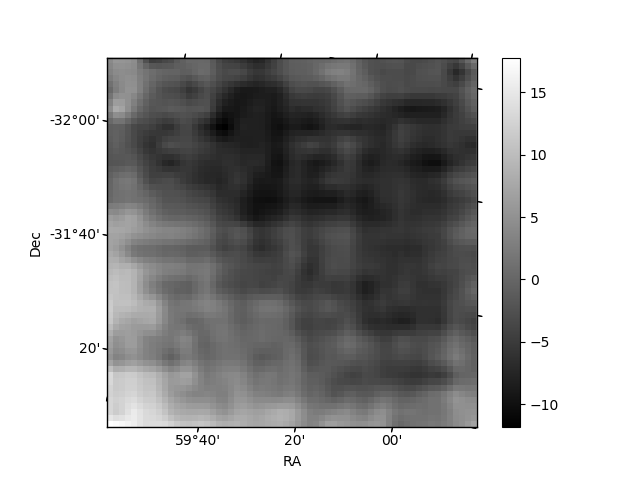
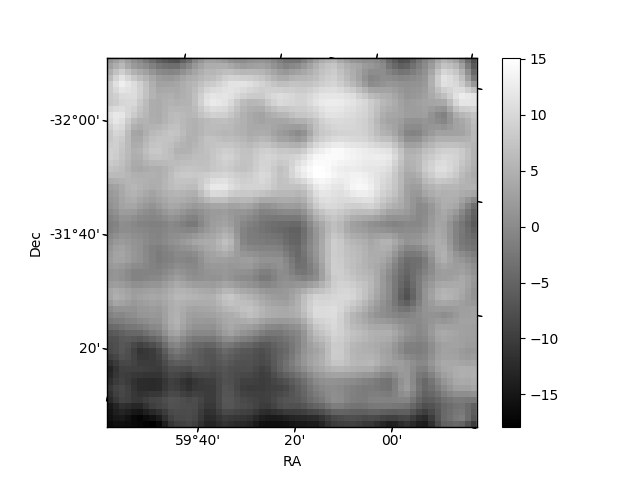
Histogram calculated using DETX and DETY for each event in the final _common_clean file
| Quadrant A | 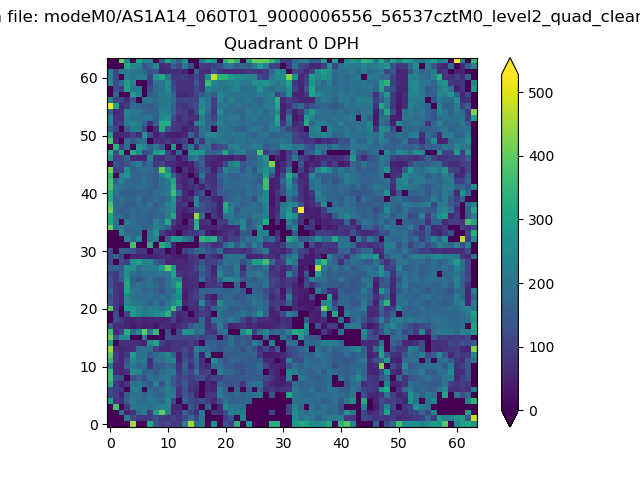 |
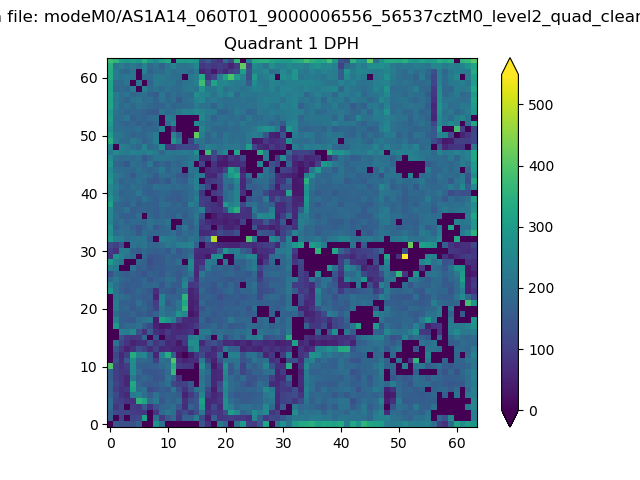 |
Quadrant B |
|---|---|---|---|
| Quadrant D |  |
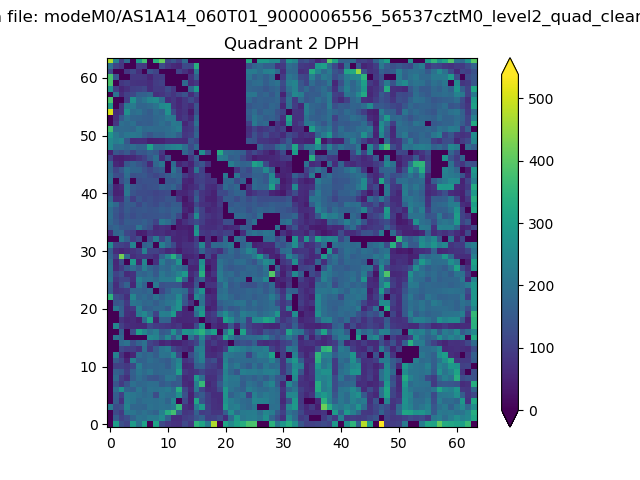 |
Quadrant C |
| Plot type | Count rate plots | Images |
|---|---|---|
| Comparison with Poisson distribution Blue bars denote a histogram of data divided into 1 sec bins. Red curve is a Poisson curve with rate = median count rate of data. |
 |
 |
| Quadrant-wise count rates Data is divided into 100 sec bins |
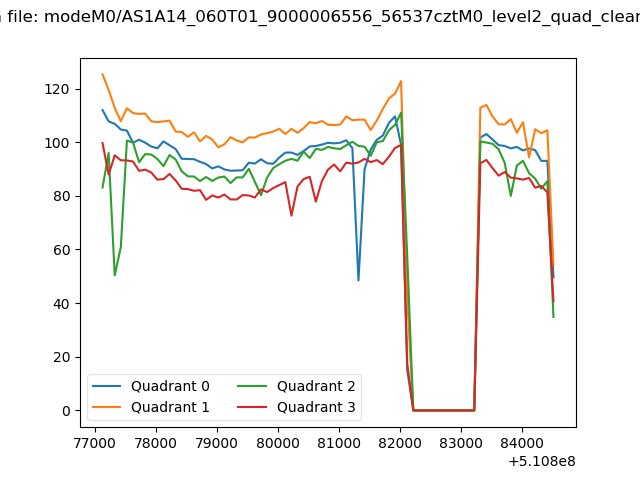 |
|
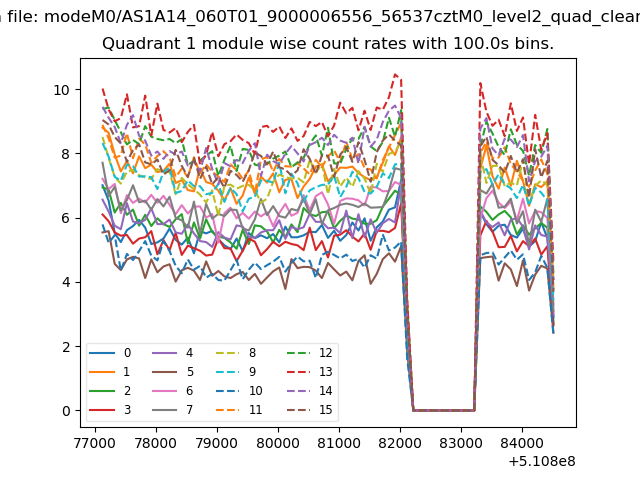
| Module-wise count rates for Quadrant A Data is divided into 100 sec bins |
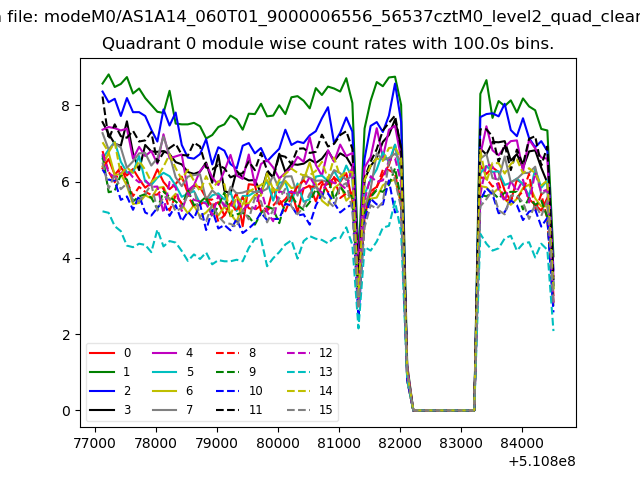 |
 |
| Module-wise count rates for Quadrant B Data is divided into 100 sec bins |
 |
 |
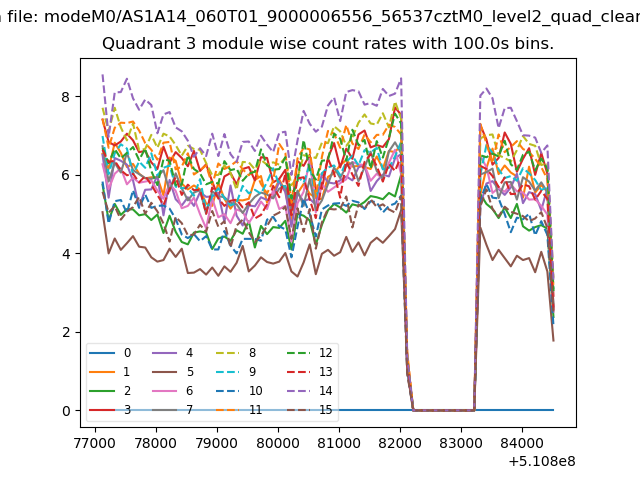
| Module-wise count rates for Quadrant C Data is divided into 100 sec bins |
 |
 |
| Module-wise count rates for Quadrant D Data is divided into 100 sec bins |
 |
 |
| Parameter | Plot |
|---|---|
| CZT HV Monitor | 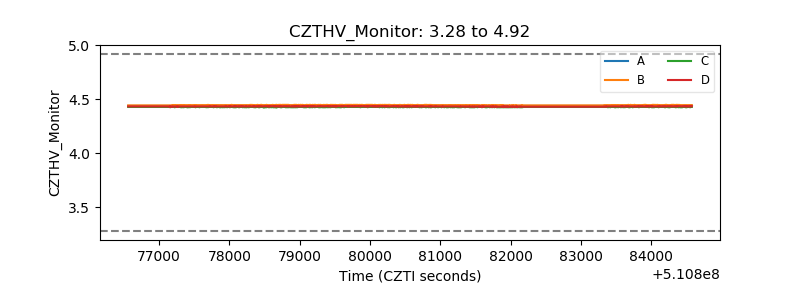 |
| D_VDD |  |
| Temperature 1 | 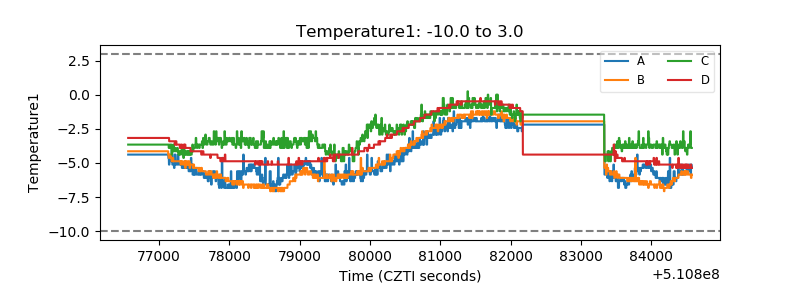 |
| Veto HV Monitor | 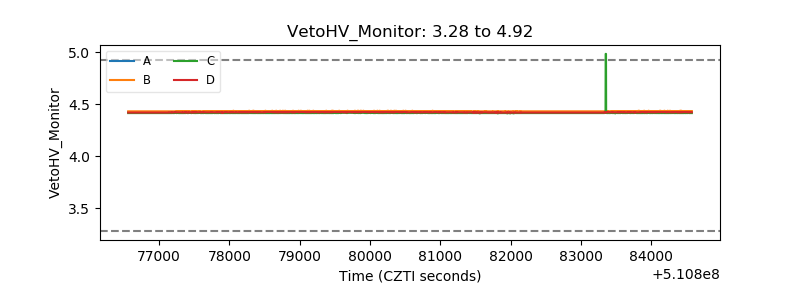 |
| Veto LLD |  |
| Alpha Counter |  |
| _CPM_Rate |  |
| CZT Counter | 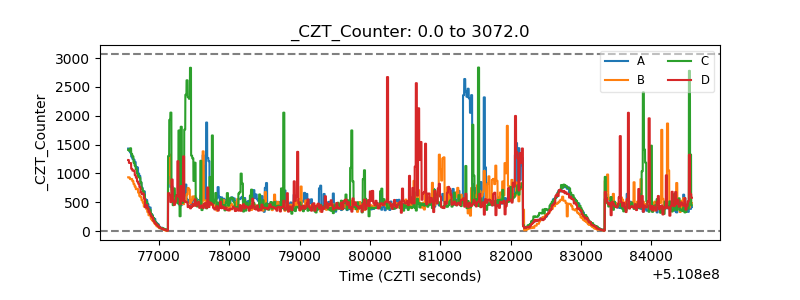 |
| +2.5 Volts monitor | 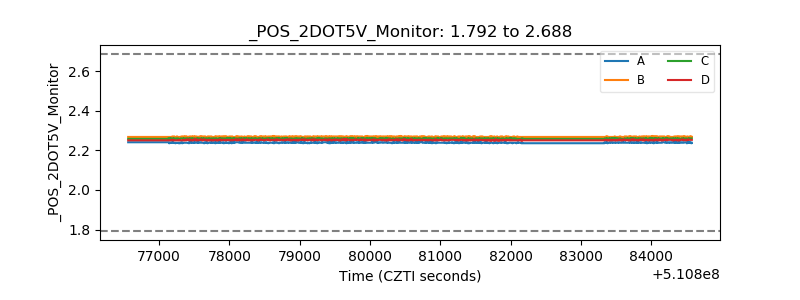 |
| +5 Volts monitor |  |
| _ROLL_ROT | 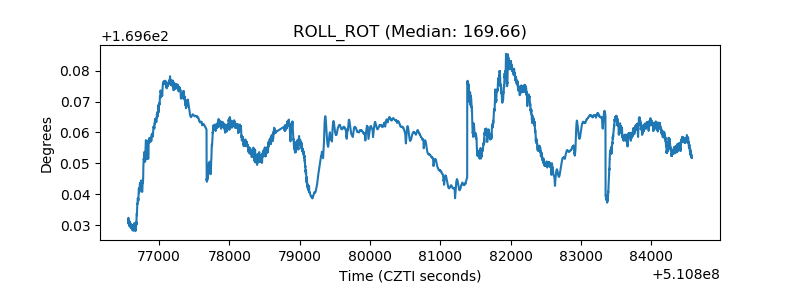 |
| _Roll_DEC | 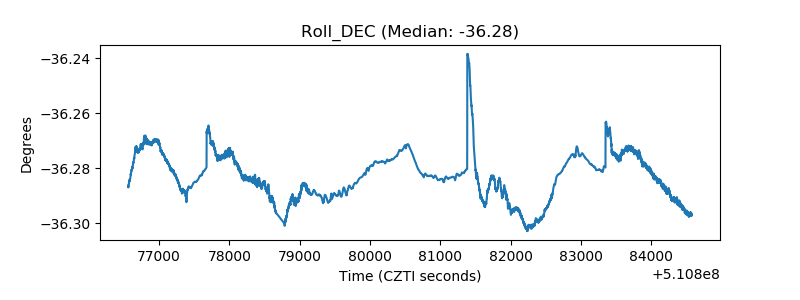 |
| _Roll_RA |  |
| Veto Counter | 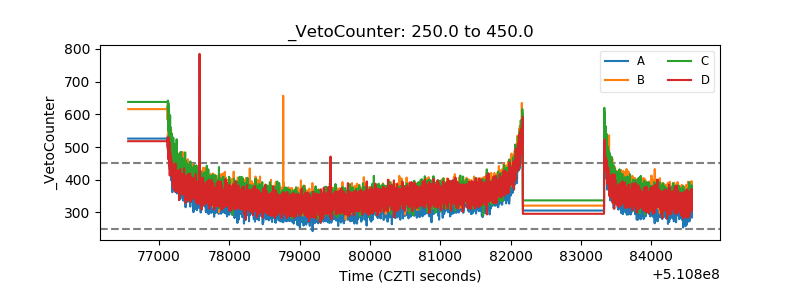 |