| Param | Original file | Final file |
|---|---|---|
| Filename | modeM0/AS1A14_060T01_9000006556_56538cztM0_level2.fits | modeM0/AS1A14_060T01_9000006556_56538cztM0_level2_quad_clean.evt |
| Size (bytes) | 446,120,640 | 101,384,640 |
| Size | 425.5 MB | 96.7 MB |
| Events in quadrant A | 3,806,653 | 665,363 |
| Events in quadrant B | 4,328,080 | 696,691 |
| Events in quadrant C | 3,685,252 | 633,593 |
| Events in quadrant D | 4,151,239 | 588,516 |
| Mode M0 | |||
|---|---|---|---|
| Quadrant | BADHDUFLAG | Total packets | Discarded packets |
| A | 0 | 16146 | 2 |
| B | 0 | 17385 | 2 |
| C | 0 | 16100 | 3 |
| D | 0 | 17187 | 2 |
| Mode M9 | |||
|---|---|---|---|
| Quadrant | BADHDUFLAG | Total packets | Discarded packets |
| A | 0 | 20 | 0 |
| B | 0 | 21 | 0 |
| C | 0 | 21 | 0 |
| D | 0 | 21 | 0 |
| Mode SS | |||
|---|---|---|---|
| Quadrant | BADHDUFLAG | Total packets | Discarded packets |
| A | 0 | 140 | 0 |
| B | 0 | 142 | 0 |
| C | 0 | 142 | 0 |
| D | 0 | 142 | 0 |
| Quadrant | Total seconds | Saturated seconds | Saturation percentage |
|---|---|---|---|
| A | 6980 | 89 | 1.275072% |
| B | 6980 | 372 | 5.329513% |
| C | 6979 | 173 | 2.478865% |
| D | 6979 | 148 | 2.120648% |
Noise dominated data is calculated using 1-second bins in cleaned event files. If a bin has >2000 counts, and if more than 50% of those come from <1% of pixels, then it is considered to be noise-dominated and hence unusable.
| Quadrant | # 1 sec bins | Bins with >0 counts | Bins with >2000 counts | High rate bins dominated by noise | Noise dominated (total time) | Noise dominated (detector-on time) | Marked lightcurve |
|---|---|---|---|---|---|---|---|
| A | 7905 | 6981 | 57 | 57 | 0.72% | 0.82% | 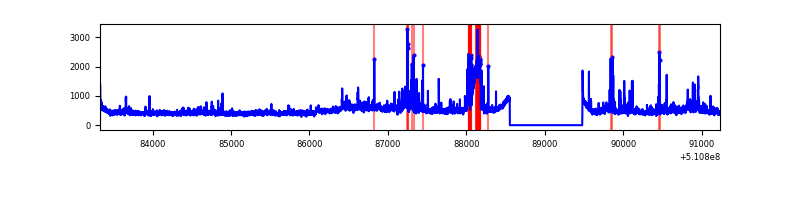 |
| B | 7905 | 6981 | 219 | 219 | 2.77% | 3.14% | 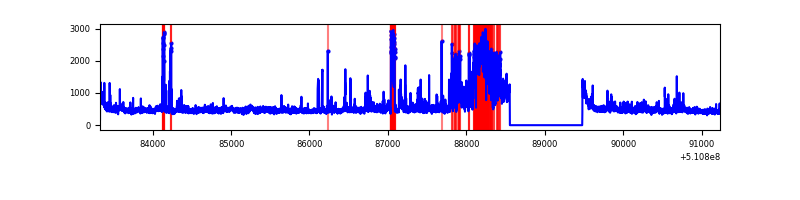 |
| C | 7904 | 6980 | 143 | 143 | 1.81% | 2.05% |  |
| D | 7904 | 6980 | 121 | 121 | 1.53% | 1.73% | 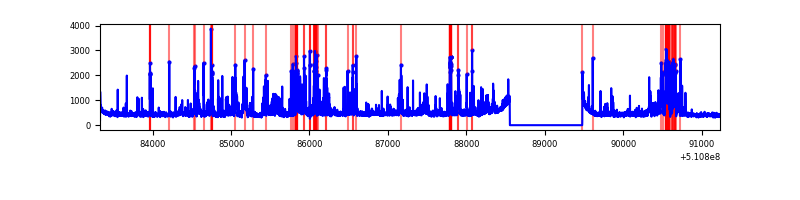 |
Top three noisy pixels from each quadrant. If the there are fewer than three noisy pixels in the level2.evt file, extra rows are filled as -1
| Pixel properties | Quadrant properties | ||||||
|---|---|---|---|---|---|---|---|
| Quadrant | DetID | PixID | Counts | Sigma | Mean | Median | Sigma |
| A | 4 | 95 | 315957 | 1672.94 | 765 | 746 | 188.4 |
| A | 13 | 153 | 252636 | 1336.87 | 765 | 746 | 188.4 |
| A | 4 | 249 | 105341 | 555.12 | 765 | 746 | 188.4 |
| B | 5 | 185 | 790002 | 4889.05 | 755 | 726 | 161.4 |
| B | 0 | 171 | 187320 | 1155.83 | 755 | 726 | 161.4 |
| B | 10 | 246 | 78969 | 484.66 | 755 | 726 | 161.4 |
| C | 12 | 252 | 446681 | 2183.83 | 747 | 740 | 204.2 |
| C | 14 | 254 | 127519 | 620.85 | 747 | 740 | 204.2 |
| C | 6 | 223 | 121814 | 592.92 | 747 | 740 | 204.2 |
| D | 2 | 249 | 540744 | 2567.49 | 740 | 707 | 210.3 |
| D | 12 | 218 | 196640 | 931.52 | 740 | 707 | 210.3 |
| D | 8 | 129 | 195438 | 925.81 | 740 | 707 | 210.3 |
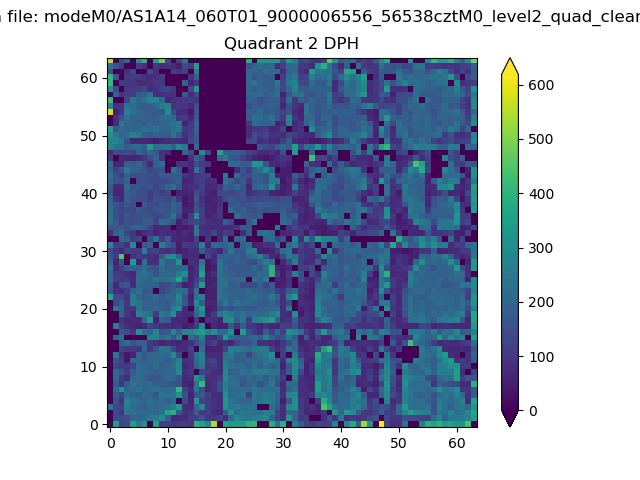
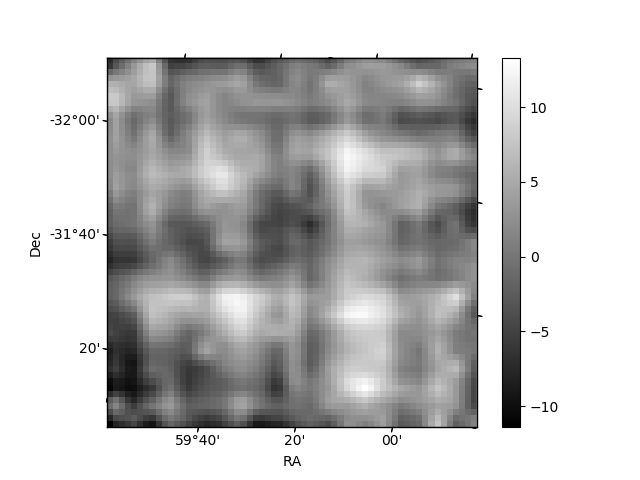
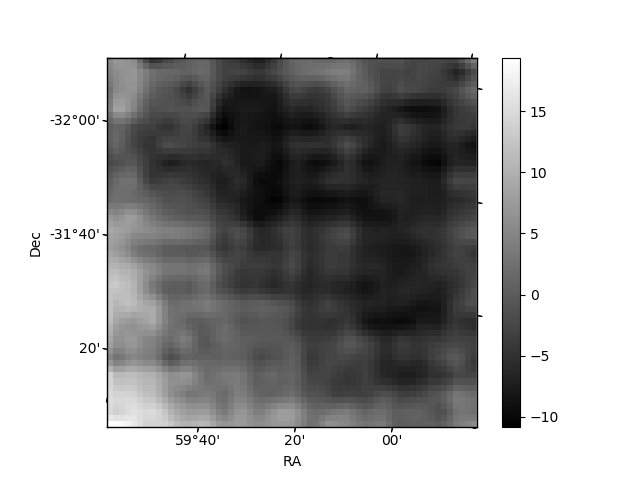
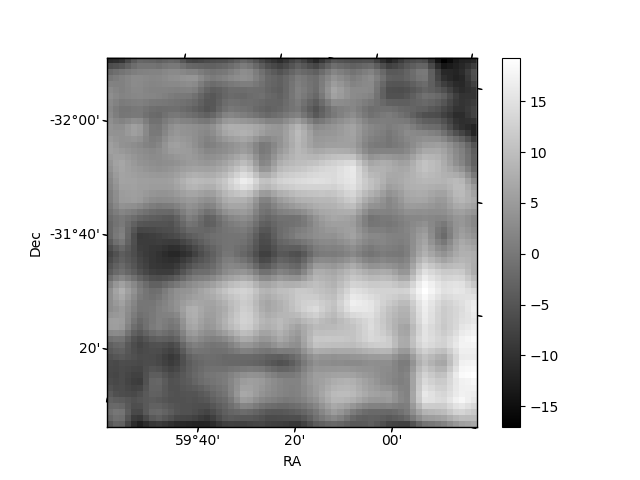
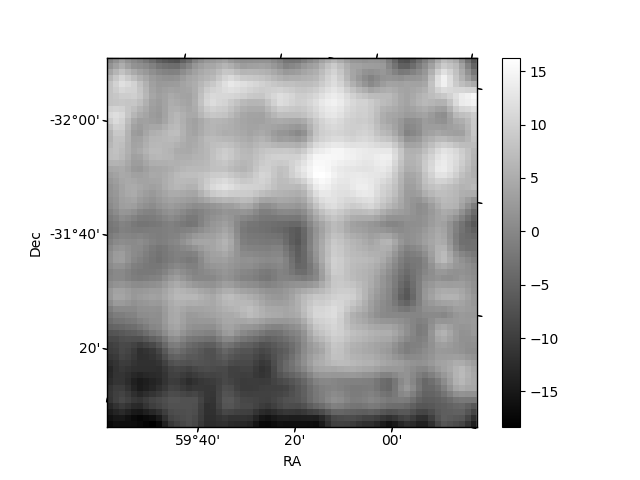
Histogram calculated using DETX and DETY for each event in the final _common_clean file
| Quadrant A | 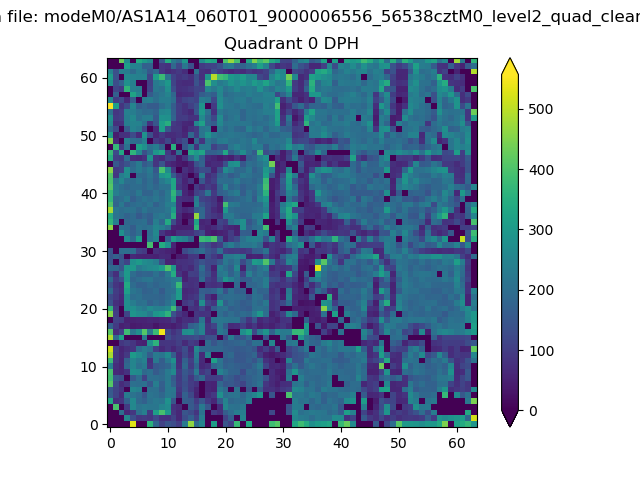 |
 |
Quadrant B |
|---|---|---|---|
| Quadrant D | 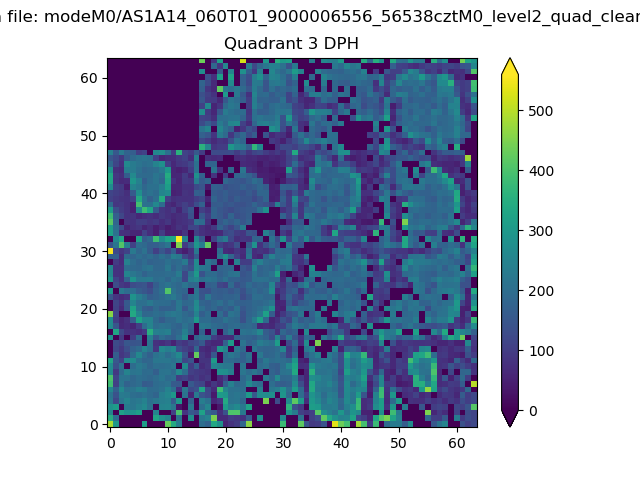 |
 |
Quadrant C |
| Plot type | Count rate plots | Images |
|---|---|---|
| Comparison with Poisson distribution Blue bars denote a histogram of data divided into 1 sec bins. Red curve is a Poisson curve with rate = median count rate of data. |
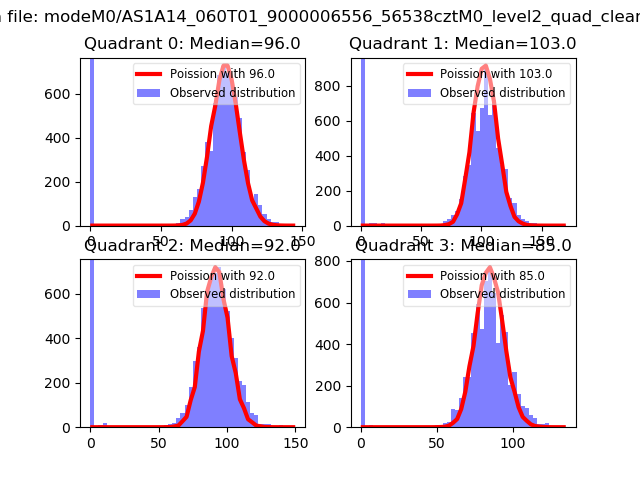 |
 |
| Quadrant-wise count rates Data is divided into 100 sec bins |
 |
|
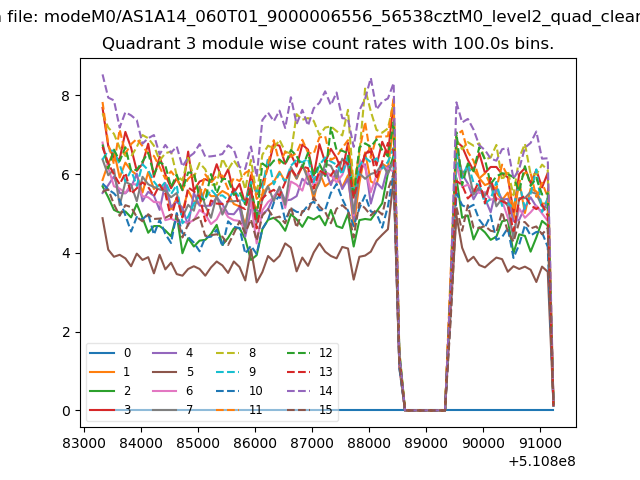
| Module-wise count rates for Quadrant A Data is divided into 100 sec bins |
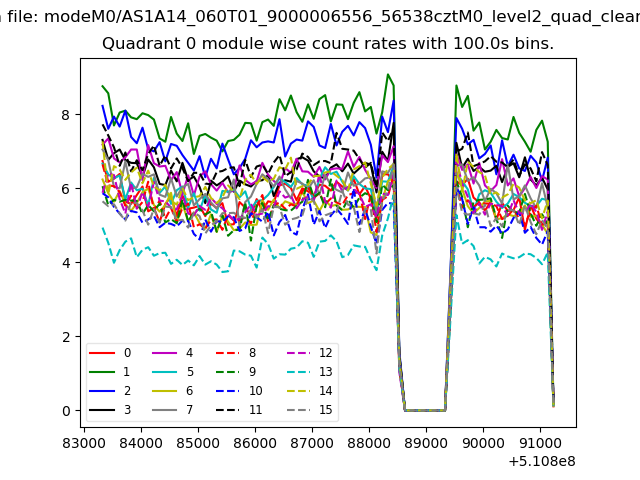 |
 |
| Module-wise count rates for Quadrant B Data is divided into 100 sec bins |
 |
 |
| Module-wise count rates for Quadrant C Data is divided into 100 sec bins |
 |
 |
| Module-wise count rates for Quadrant D Data is divided into 100 sec bins |
 |
 |
| Parameter | Plot |
|---|---|
| CZT HV Monitor | 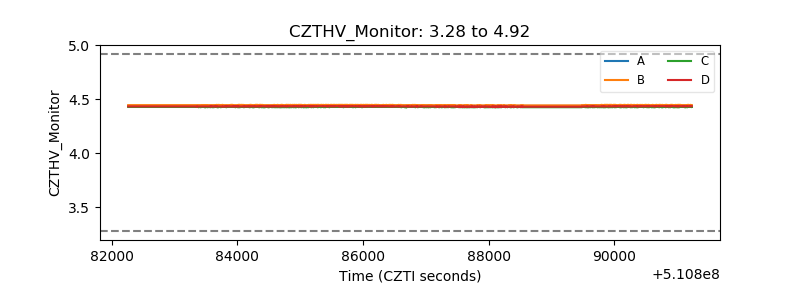 |
| D_VDD |  |
| Temperature 1 | 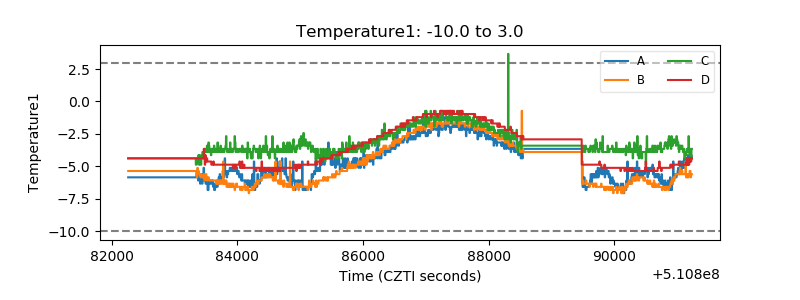 |
| Veto HV Monitor | 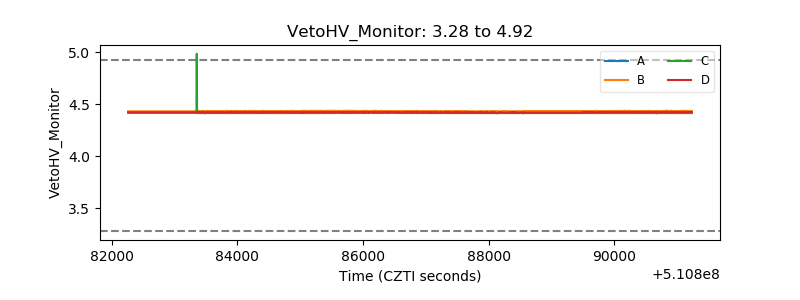 |
| Veto LLD |  |
| Alpha Counter |  |
| _CPM_Rate |  |
| CZT Counter | 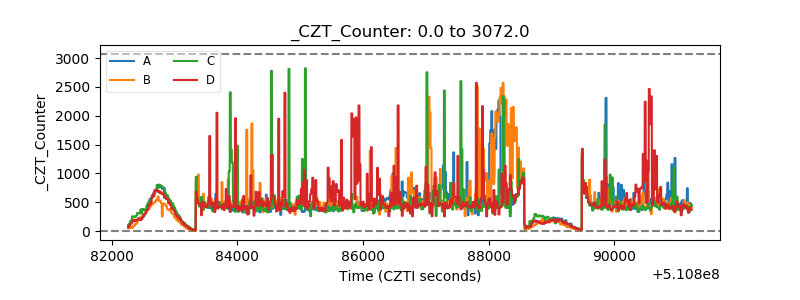 |
| +2.5 Volts monitor | 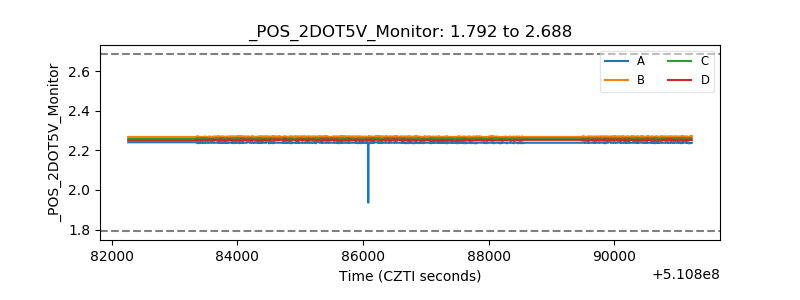 |
| +5 Volts monitor | 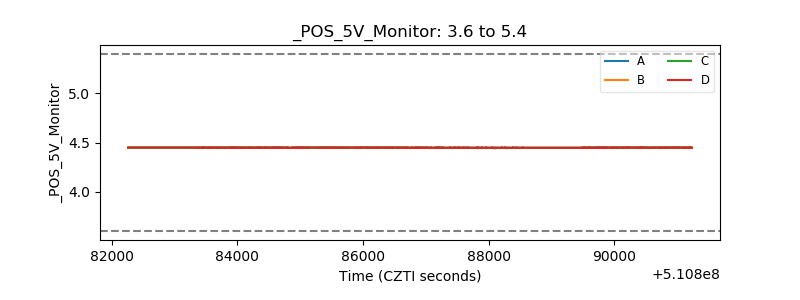 |
| _ROLL_ROT | 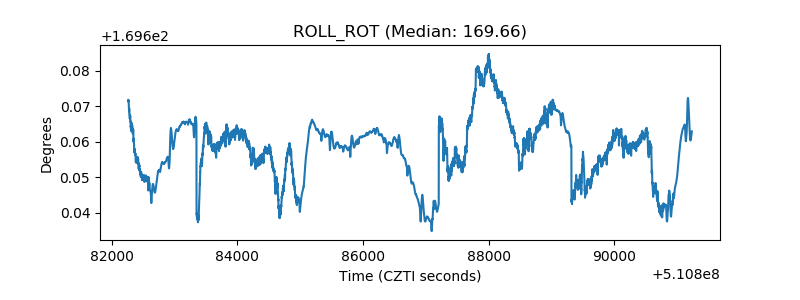 |
| _Roll_DEC | 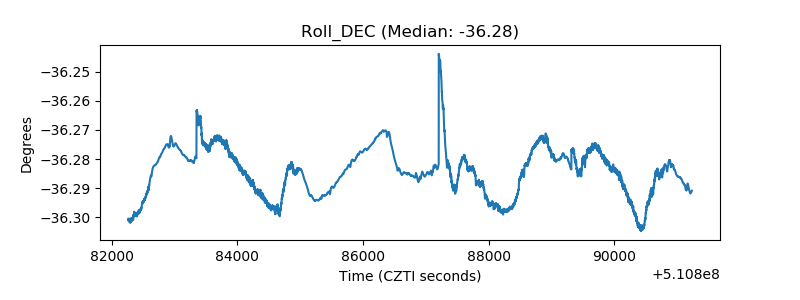 |
| _Roll_RA | 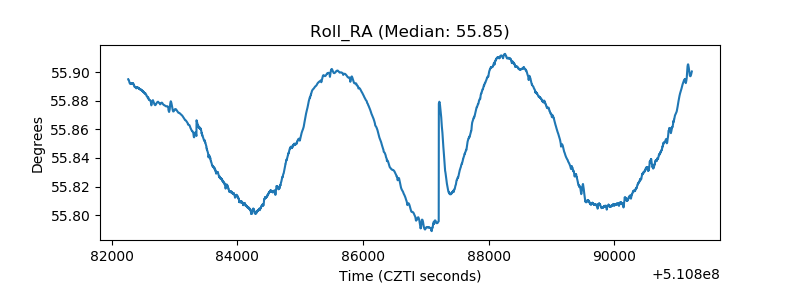 |
| Veto Counter | 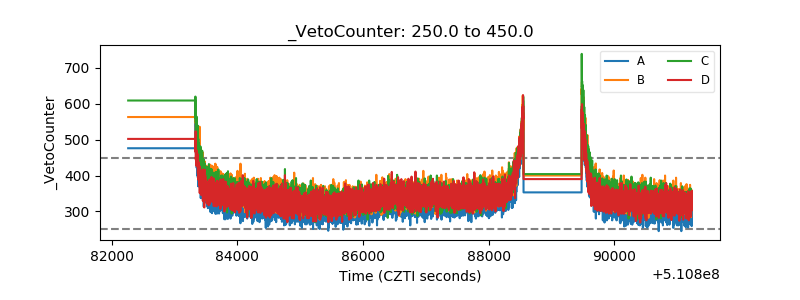 |