| Param | Original file | Final file |
|---|---|---|
| Filename | modeM0/AS1A14_060T01_9000006556_56539cztM0_level2.fits | modeM0/AS1A14_060T01_9000006556_56539cztM0_level2_quad_clean.evt |
| Size (bytes) | 488,214,720 | 105,672,960 |
| Size | 465.6 MB | 100.8 MB |
| Events in quadrant A | 5,223,349 | 666,271 |
| Events in quadrant B | 4,104,550 | 740,614 |
| Events in quadrant C | 3,621,750 | 665,544 |
| Events in quadrant D | 4,540,232 | 606,511 |
| Mode M0 | |||
|---|---|---|---|
| Quadrant | BADHDUFLAG | Total packets | Discarded packets |
| A | 0 | 20859 | 2 |
| B | 0 | 17278 | 2 |
| C | 0 | 16422 | 2 |
| D | 0 | 18827 | 2 |
| Mode M9 | |||
|---|---|---|---|
| Quadrant | BADHDUFLAG | Total packets | Discarded packets |
| A | 0 | 4 | 0 |
| B | 0 | 4 | 0 |
| C | 0 | 4 | 0 |
| D | 0 | 4 | 0 |
| Mode SS | |||
|---|---|---|---|
| Quadrant | BADHDUFLAG | Total packets | Discarded packets |
| A | 0 | 152 | 0 |
| B | 0 | 152 | 0 |
| C | 0 | 152 | 0 |
| D | 0 | 152 | 0 |
| Quadrant | Total seconds | Saturated seconds | Saturation percentage |
|---|---|---|---|
| A | 7488 | 478 | 6.383547% |
| B | 7488 | 313 | 4.180021% |
| C | 7489 | 217 | 2.897583% |
| D | 7489 | 367 | 4.900521% |
Noise dominated data is calculated using 1-second bins in cleaned event files. If a bin has >2000 counts, and if more than 50% of those come from <1% of pixels, then it is considered to be noise-dominated and hence unusable.
| Quadrant | # 1 sec bins | Bins with >0 counts | Bins with >2000 counts | High rate bins dominated by noise | Noise dominated (total time) | Noise dominated (detector-on time) | Marked lightcurve |
|---|---|---|---|---|---|---|---|
| A | 7853 | 7490 | 256 | 256 | 3.26% | 3.42% |  |
| B | 7853 | 7490 | 35 | 35 | 0.45% | 0.47% | 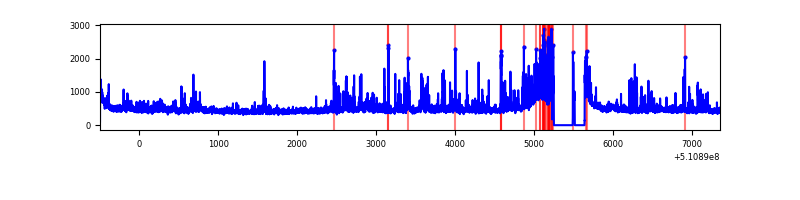 |
| C | 7854 | 7491 | 40 | 40 | 0.51% | 0.53% | 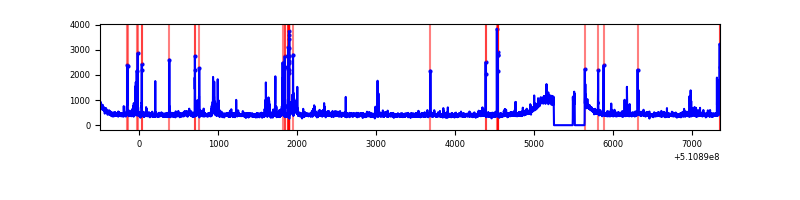 |
| D | 7854 | 7491 | 204 | 204 | 2.60% | 2.72% |  |
Top three noisy pixels from each quadrant. If the there are fewer than three noisy pixels in the level2.evt file, extra rows are filled as -1
| Pixel properties | Quadrant properties | ||||||
|---|---|---|---|---|---|---|---|
| Quadrant | DetID | PixID | Counts | Sigma | Mean | Median | Sigma |
| A | 13 | 153 | 603664 | 2954.83 | 826 | 807 | 204.0 |
| A | 4 | 249 | 457564 | 2238.74 | 826 | 807 | 204.0 |
| A | 10 | 251 | 450576 | 2204.49 | 826 | 807 | 204.0 |
| B | 4 | 206 | 340869 | 1909.05 | 824 | 791 | 178.1 |
| B | 5 | 185 | 118771 | 662.29 | 824 | 791 | 178.1 |
| B | 4 | 171 | 103064 | 574.12 | 824 | 791 | 178.1 |
| C | 6 | 223 | 126475 | 556.17 | 828 | 821 | 225.9 |
| C | 14 | 254 | 91509 | 401.4 | 828 | 821 | 225.9 |
| C | 13 | 3 | 72012 | 315.1 | 828 | 821 | 225.9 |
| D | 8 | 129 | 503238 | 2215.36 | 810 | 776 | 226.8 |
| D | 8 | 240 | 292343 | 1285.52 | 810 | 776 | 226.8 |
| D | 5 | 113 | 186379 | 818.33 | 810 | 776 | 226.8 |
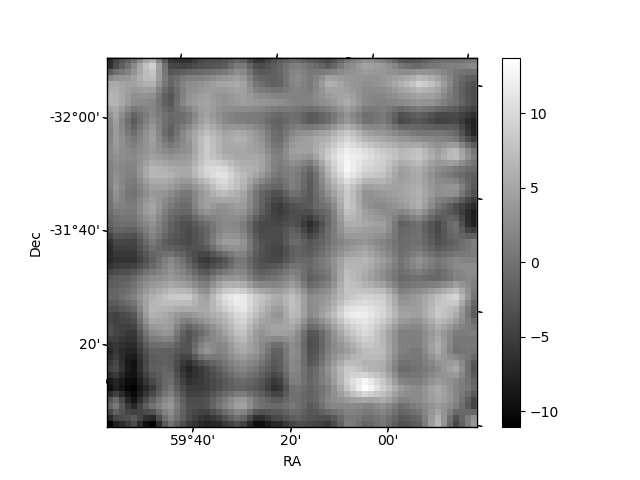
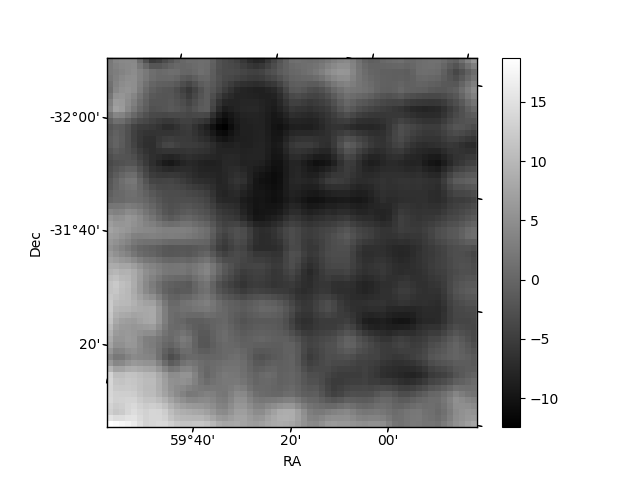
Histogram calculated using DETX and DETY for each event in the final _common_clean file
| Quadrant A | 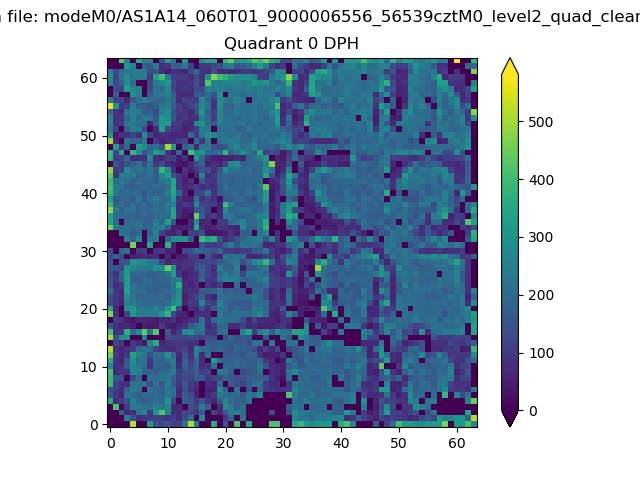 |
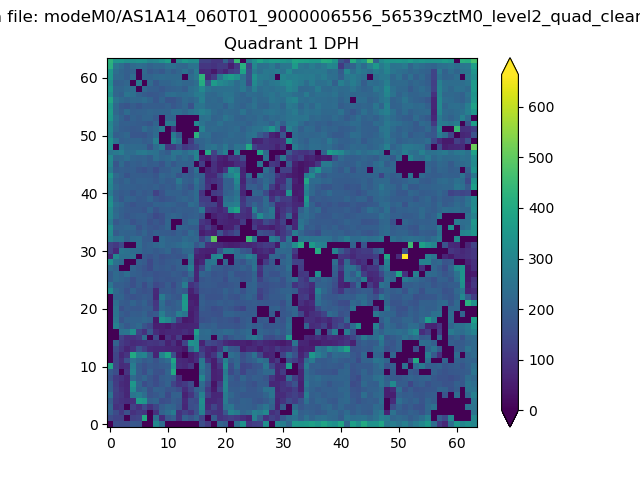 |
Quadrant B |
|---|---|---|---|
| Quadrant D |  |
 |
Quadrant C |
| Plot type | Count rate plots | Images |
|---|---|---|
| Comparison with Poisson distribution Blue bars denote a histogram of data divided into 1 sec bins. Red curve is a Poisson curve with rate = median count rate of data. |
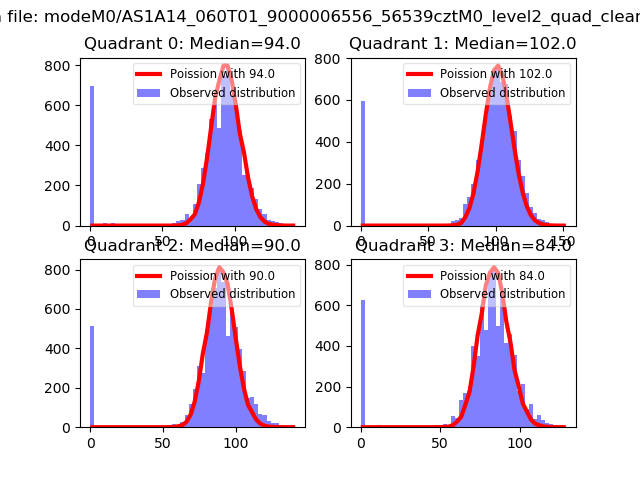 |
 |
| Quadrant-wise count rates Data is divided into 100 sec bins |
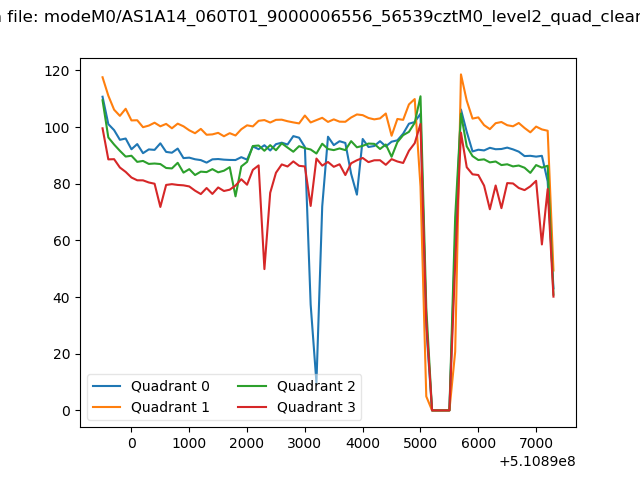 |
|
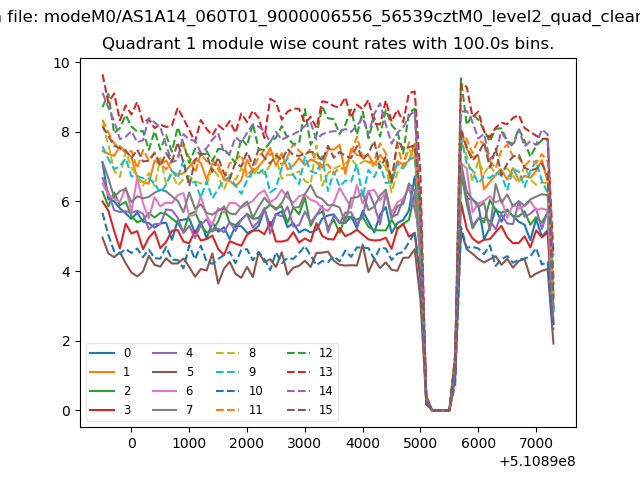
| Module-wise count rates for Quadrant A Data is divided into 100 sec bins |
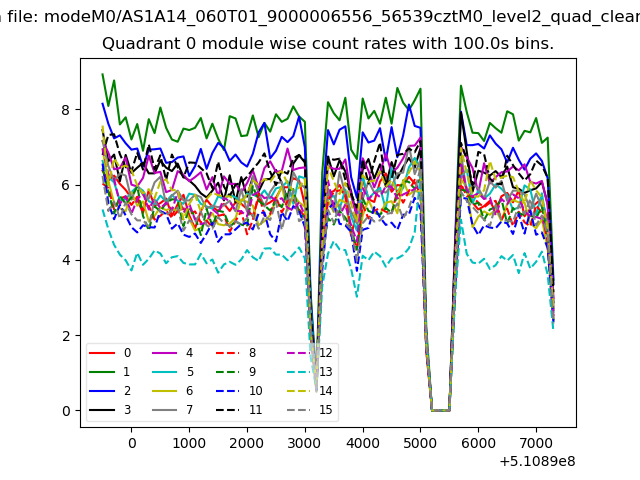 |
 |
| Module-wise count rates for Quadrant B Data is divided into 100 sec bins |
 |
 |
| Module-wise count rates for Quadrant C Data is divided into 100 sec bins |
 |
 |
| Module-wise count rates for Quadrant D Data is divided into 100 sec bins |
 |
 |
| Parameter | Plot |
|---|---|
| CZT HV Monitor |  |
| D_VDD | 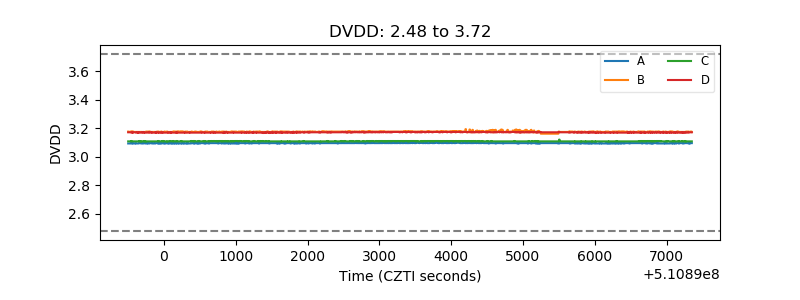 |
| Temperature 1 |  |
| Veto HV Monitor | 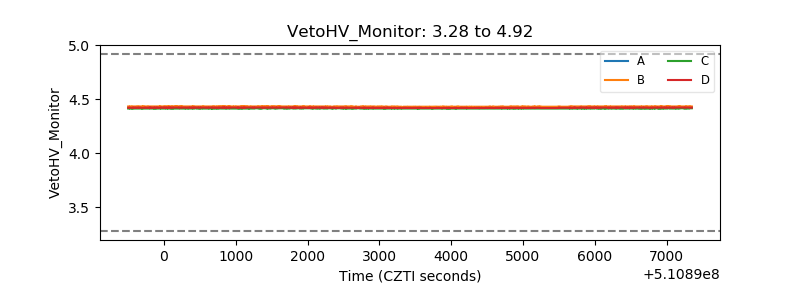 |
| Veto LLD | 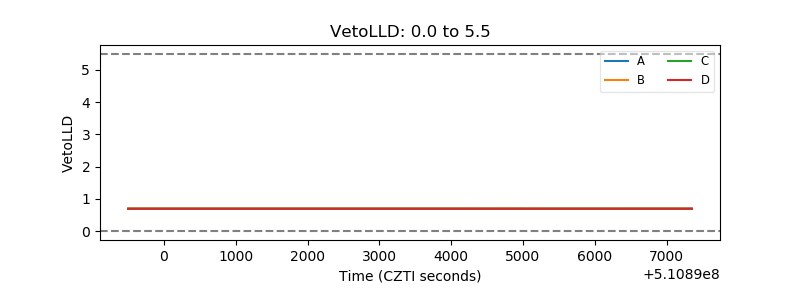 |
| Alpha Counter |  |
| _CPM_Rate | 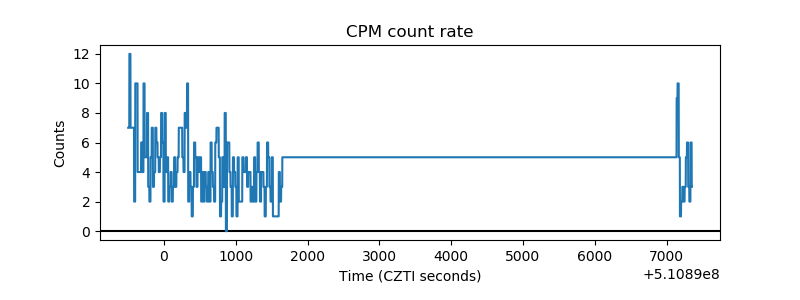 |
| CZT Counter | 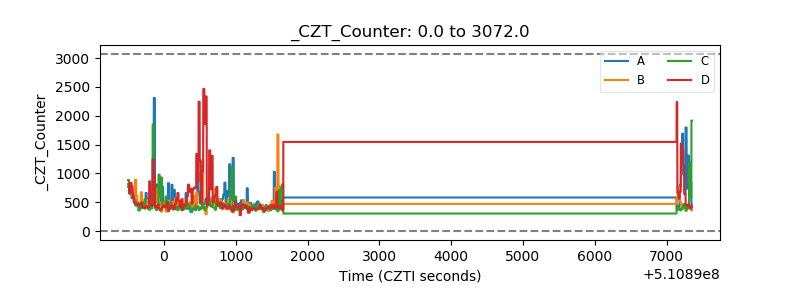 |
| +2.5 Volts monitor |  |
| +5 Volts monitor |  |
| _ROLL_ROT | 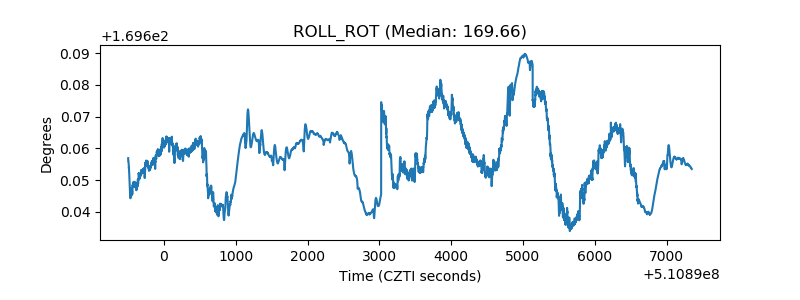 |
| _Roll_DEC | 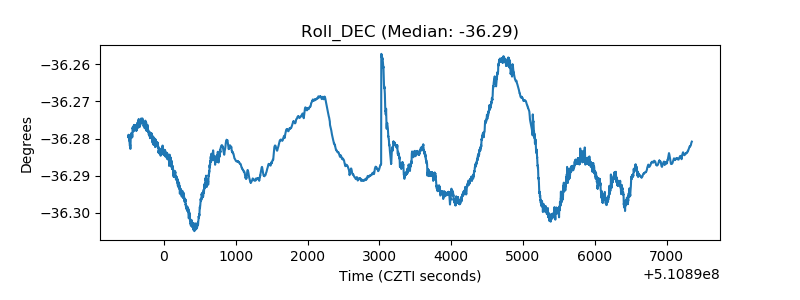 |
| _Roll_RA | 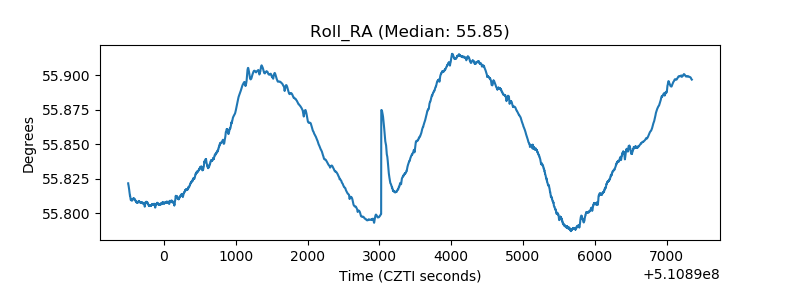 |
| Veto Counter | 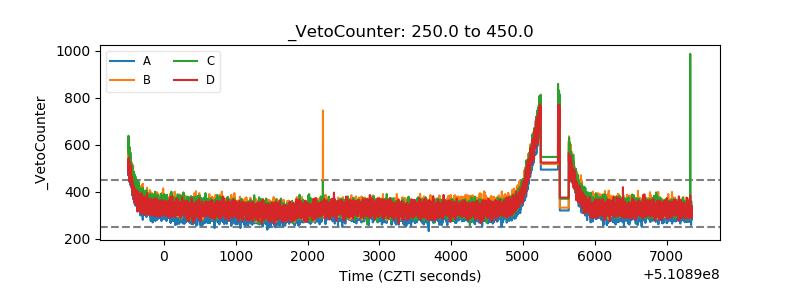 |