| Param | Original file | Final file |
|---|---|---|
| Filename | modeM0/AS1A14_060T01_9000006556_56540cztM0_level2.fits | modeM0/AS1A14_060T01_9000006556_56540cztM0_level2_quad_clean.evt |
| Size (bytes) | 595,992,960 | 118,961,280 |
| Size | 568.4 MB | 113.5 MB |
| Events in quadrant A | 5,176,841 | 778,151 |
| Events in quadrant B | 7,158,983 | 766,627 |
| Events in quadrant C | 4,388,552 | 759,474 |
| Events in quadrant D | 4,673,214 | 703,934 |
| Mode M0 | |||
|---|---|---|---|
| Quadrant | BADHDUFLAG | Total packets | Discarded packets |
| A | 0 | 21517 | 1 |
| B | 0 | 27114 | 1 |
| C | 0 | 19423 | 1 |
| D | 0 | 19985 | 1 |
| Mode M9 | |||
|---|---|---|---|
| Quadrant | BADHDUFLAG | Total packets | Discarded packets |
| A | 0 | 4 | 0 |
| B | 0 | 4 | 0 |
| C | 0 | 4 | 0 |
| D | 0 | 4 | 0 |
| Mode SS | |||
|---|---|---|---|
| Quadrant | BADHDUFLAG | Total packets | Discarded packets |
| A | 0 | 174 | 0 |
| B | 0 | 174 | 0 |
| C | 0 | 174 | 0 |
| D | 0 | 174 | 0 |
| Quadrant | Total seconds | Saturated seconds | Saturation percentage |
|---|---|---|---|
| A | 8550 | 376 | 4.397661% |
| B | 8550 | 1271 | 14.865497% |
| C | 8551 | 269 | 3.145831% |
| D | 8551 | 275 | 3.215998% |
Noise dominated data is calculated using 1-second bins in cleaned event files. If a bin has >2000 counts, and if more than 50% of those come from <1% of pixels, then it is considered to be noise-dominated and hence unusable.
| Quadrant | # 1 sec bins | Bins with >0 counts | Bins with >2000 counts | High rate bins dominated by noise | Noise dominated (total time) | Noise dominated (detector-on time) | Marked lightcurve |
|---|---|---|---|---|---|---|---|
| A | 8915 | 8552 | 179 | 179 | 2.01% | 2.09% | 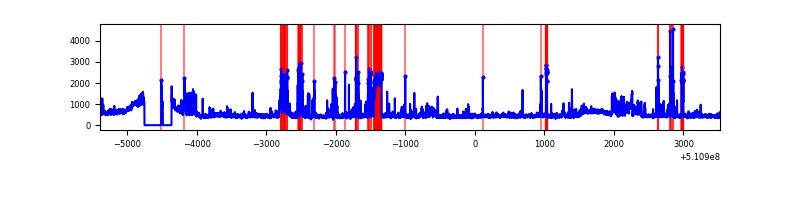 |
| B | 8915 | 8552 | 587 | 587 | 6.58% | 6.86% | 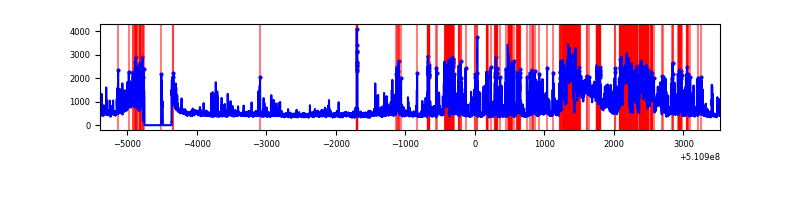 |
| C | 8916 | 8553 | 93 | 93 | 1.04% | 1.09% | 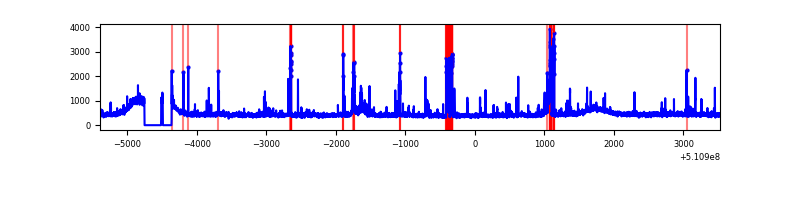 |
| D | 8916 | 8553 | 98 | 98 | 1.10% | 1.15% | 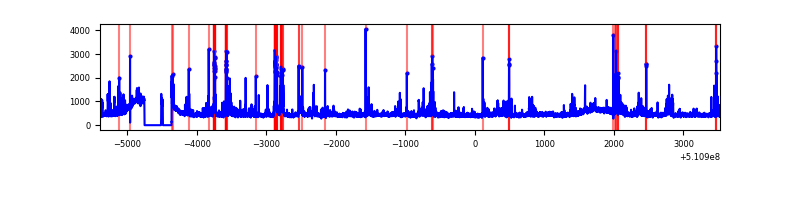 |
Top three noisy pixels from each quadrant. If the there are fewer than three noisy pixels in the level2.evt file, extra rows are filled as -1
| Pixel properties | Quadrant properties | ||||||
|---|---|---|---|---|---|---|---|
| Quadrant | DetID | PixID | Counts | Sigma | Mean | Median | Sigma |
| A | 4 | 95 | 466008 | 1942.18 | 970 | 944 | 239.5 |
| A | 4 | 249 | 347415 | 1446.92 | 970 | 944 | 239.5 |
| A | 13 | 153 | 332831 | 1386.01 | 970 | 944 | 239.5 |
| B | 5 | 185 | 2030324 | 10186.8 | 922 | 886 | 199.2 |
| B | 4 | 206 | 1015929 | 5095.02 | 922 | 886 | 199.2 |
| B | 8 | 128 | 89483 | 444.71 | 922 | 886 | 199.2 |
| C | 13 | 3 | 268035 | 1026.09 | 955 | 946 | 260.3 |
| C | 14 | 254 | 203398 | 777.77 | 955 | 946 | 260.3 |
| C | 6 | 223 | 47553 | 179.05 | 955 | 946 | 260.3 |
| D | 8 | 129 | 312031 | 1174.17 | 944 | 900 | 265.0 |
| D | 3 | 12 | 175565 | 659.16 | 944 | 900 | 265.0 |
| D | 2 | 31 | 140940 | 528.49 | 944 | 900 | 265.0 |
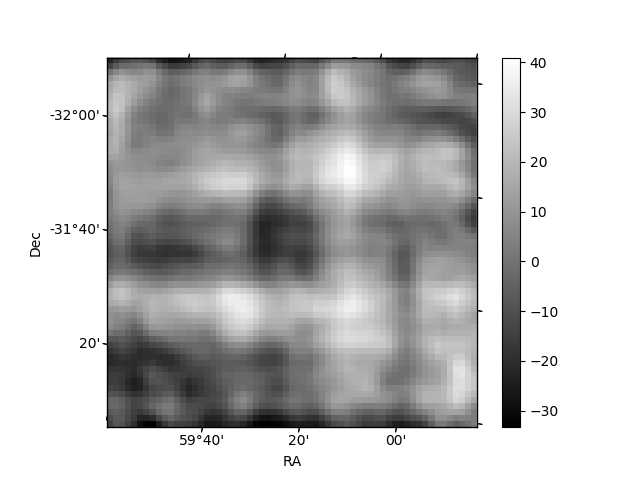
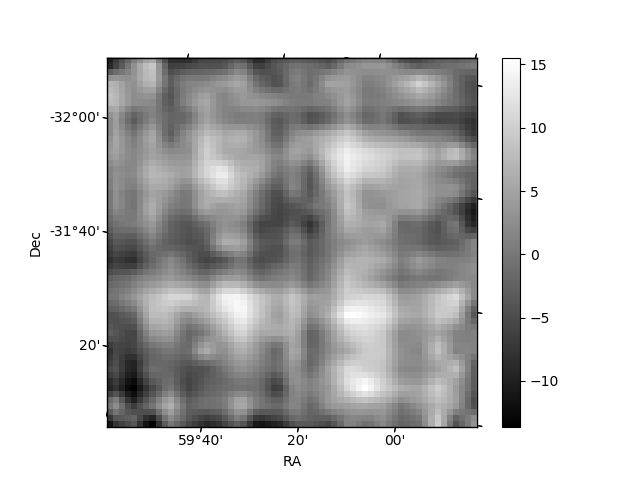
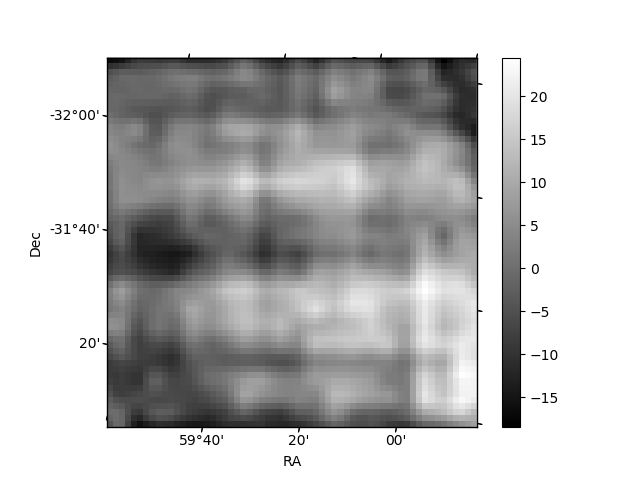
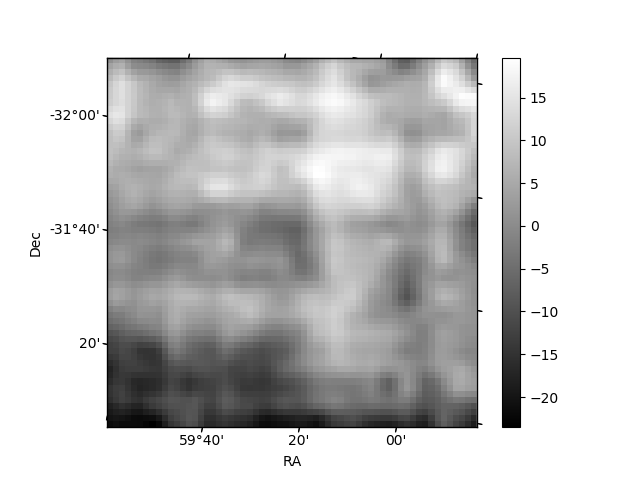
Histogram calculated using DETX and DETY for each event in the final _common_clean file
| Quadrant A | 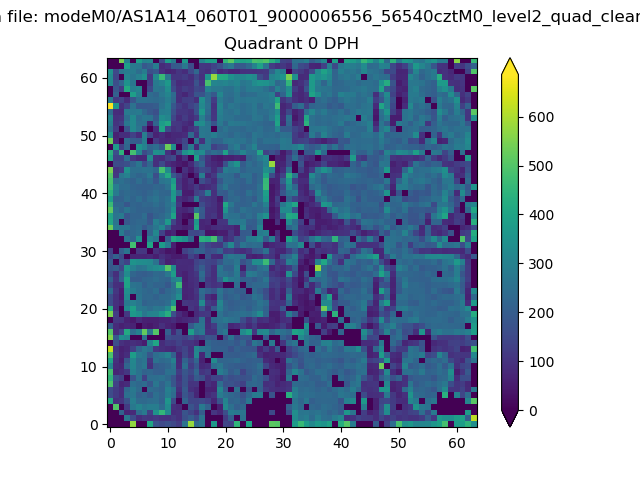 |
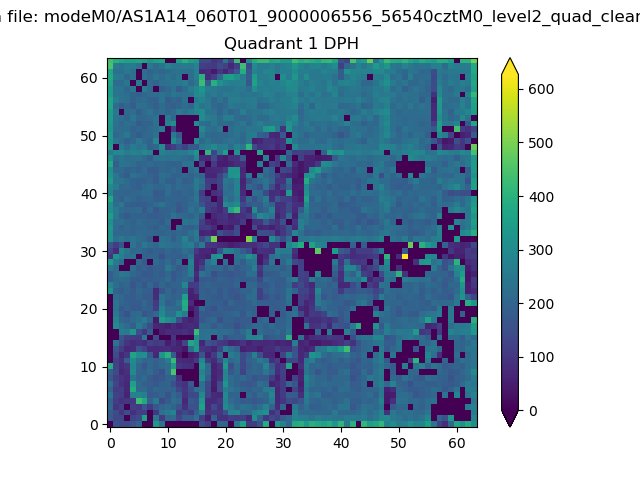 |
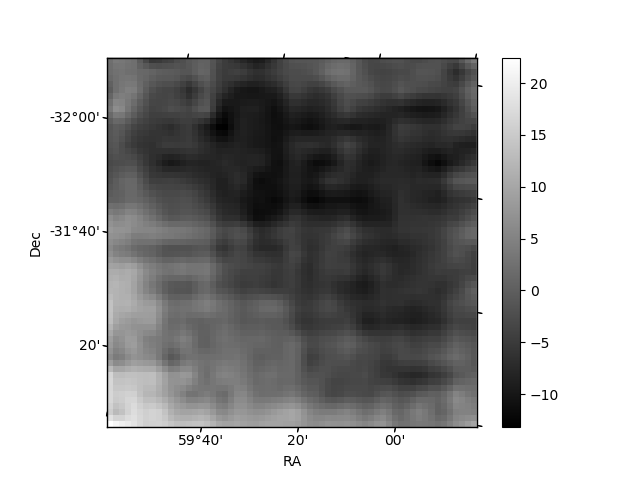
Quadrant B |
|---|---|---|---|
| Quadrant D | 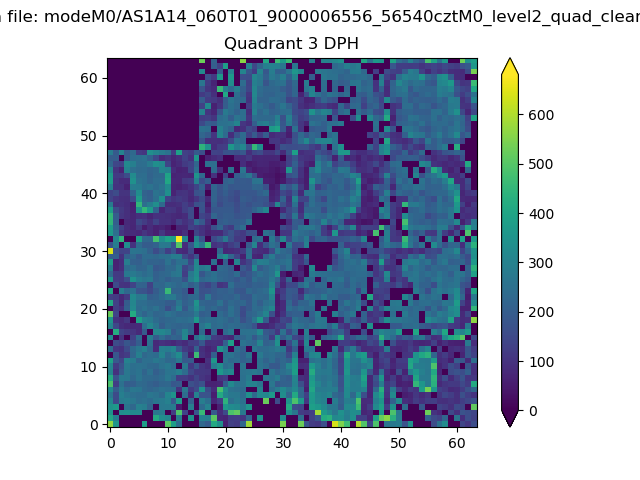 |
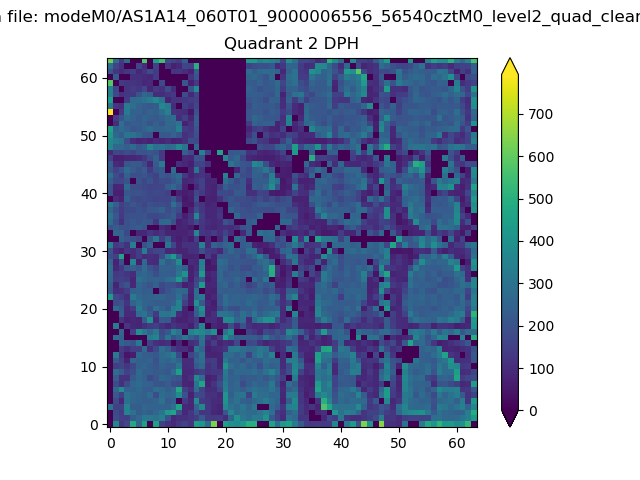 |
Quadrant C |
| Plot type | Count rate plots | Images |
|---|---|---|
| Comparison with Poisson distribution Blue bars denote a histogram of data divided into 1 sec bins. Red curve is a Poisson curve with rate = median count rate of data. |
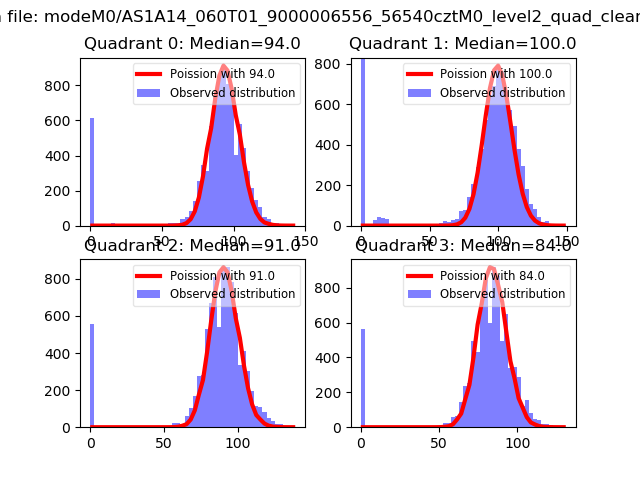 |
 |
| Quadrant-wise count rates Data is divided into 100 sec bins |
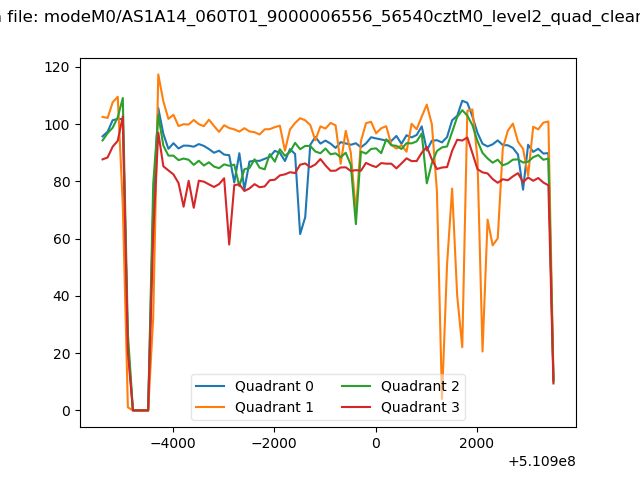 |
|
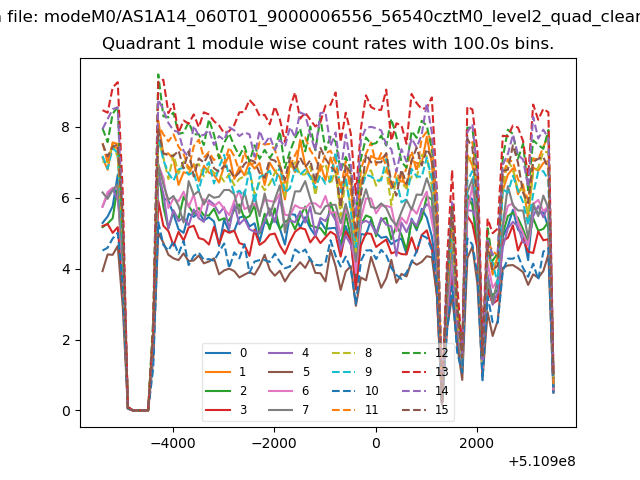
| Module-wise count rates for Quadrant A Data is divided into 100 sec bins |
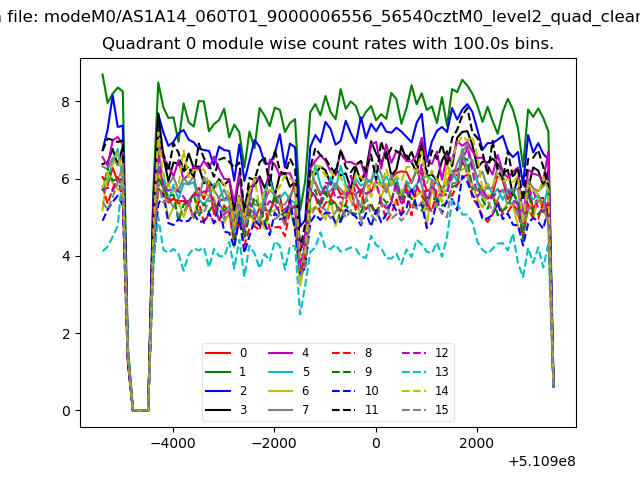 |
 |
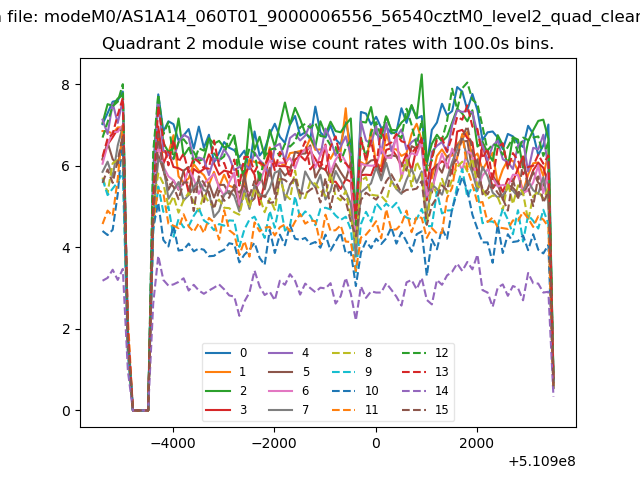
| Module-wise count rates for Quadrant B Data is divided into 100 sec bins |
 |
 |
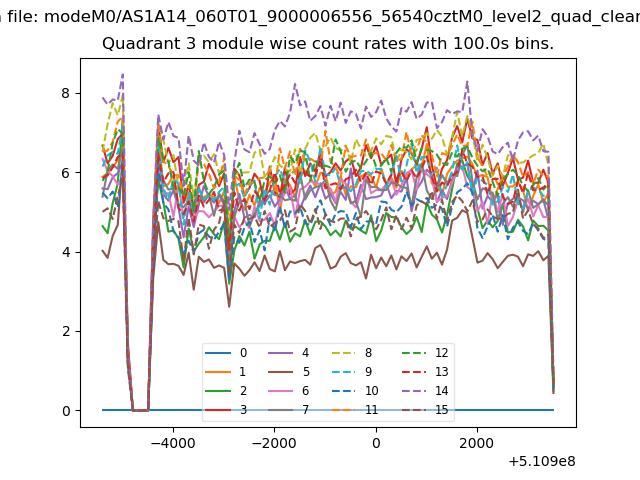
| Module-wise count rates for Quadrant C Data is divided into 100 sec bins |
 |
 |
| Module-wise count rates for Quadrant D Data is divided into 100 sec bins |
 |
 |
| Parameter | Plot |
|---|---|
| CZT HV Monitor | 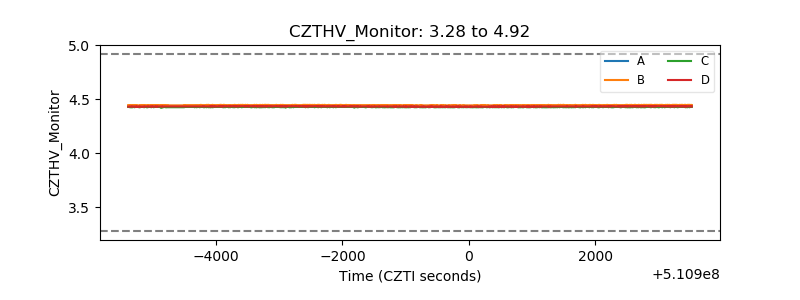 |
| D_VDD | 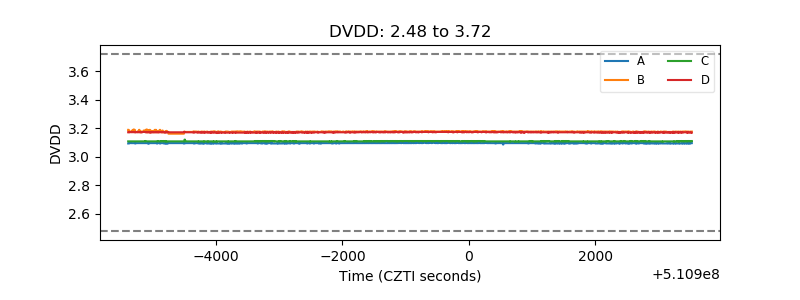 |
| Temperature 1 | 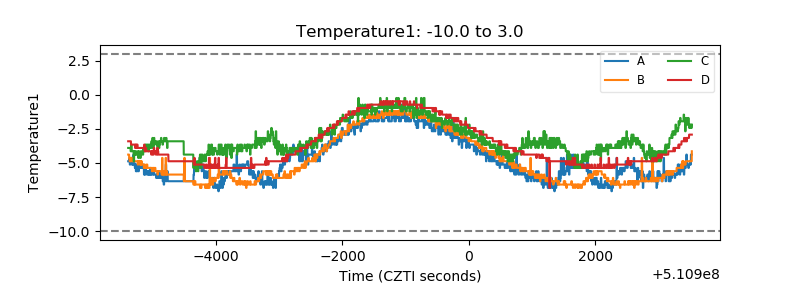 |
| Veto HV Monitor | 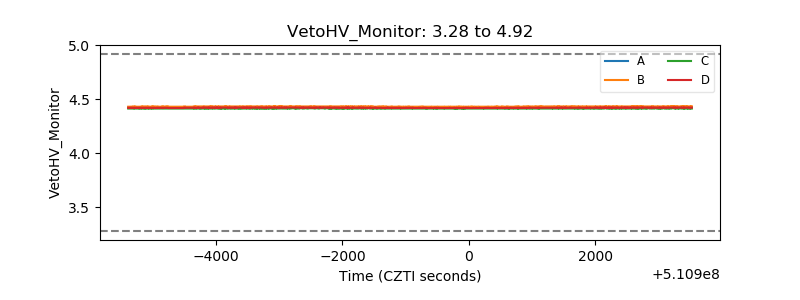 |
| Veto LLD | 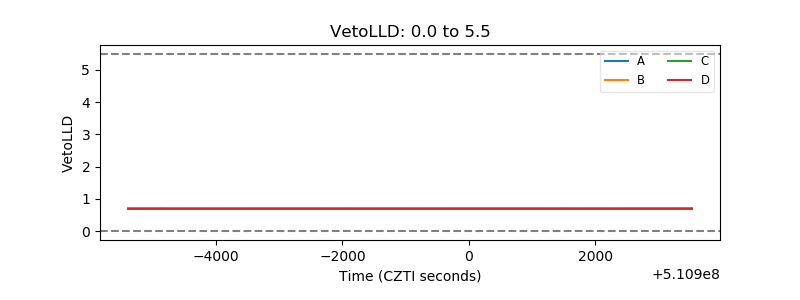 |
| Alpha Counter | 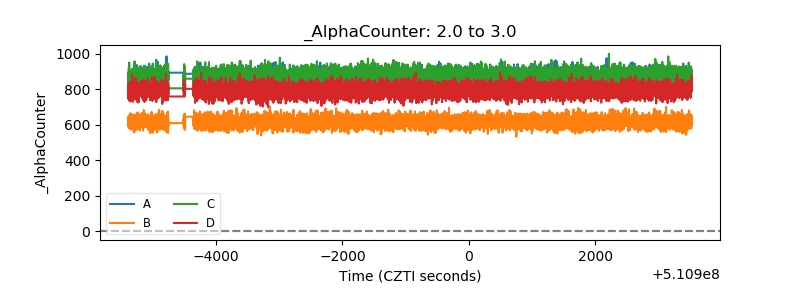 |
| _CPM_Rate | 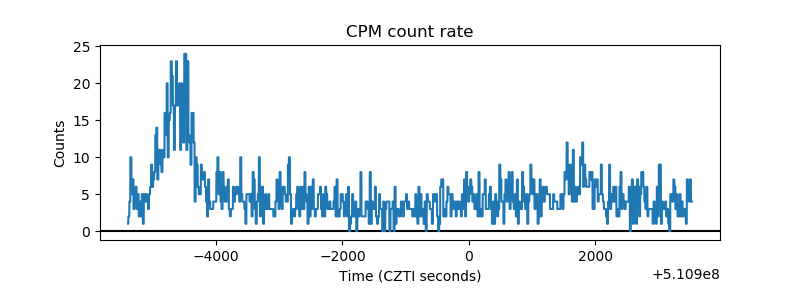 |
| CZT Counter | 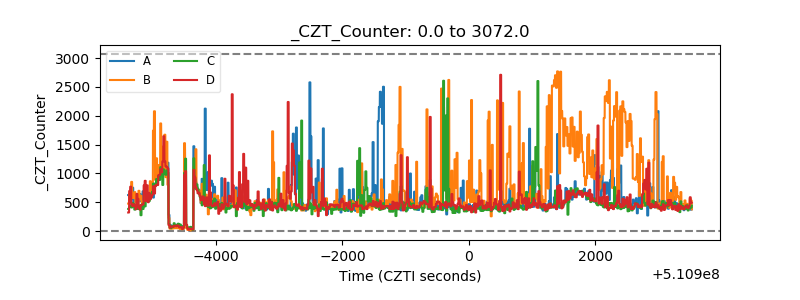 |
| +2.5 Volts monitor | 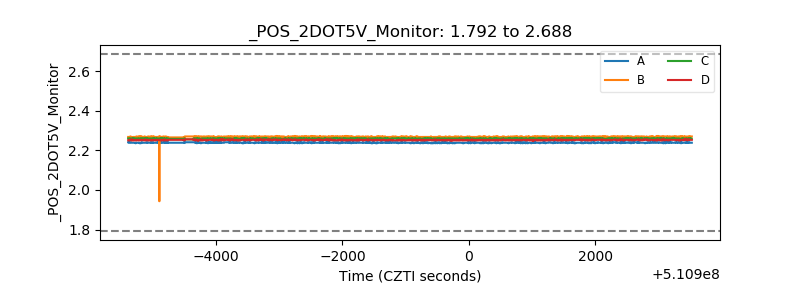 |
| +5 Volts monitor | 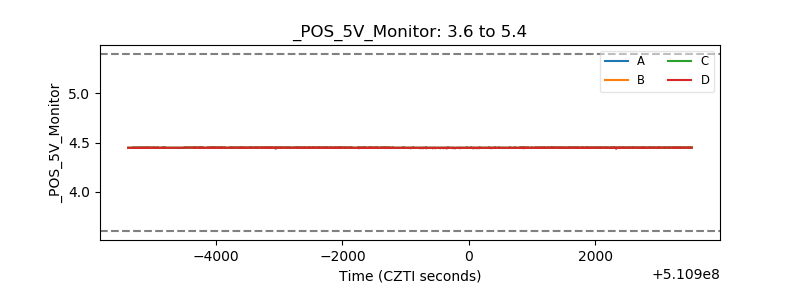 |
| _ROLL_ROT | 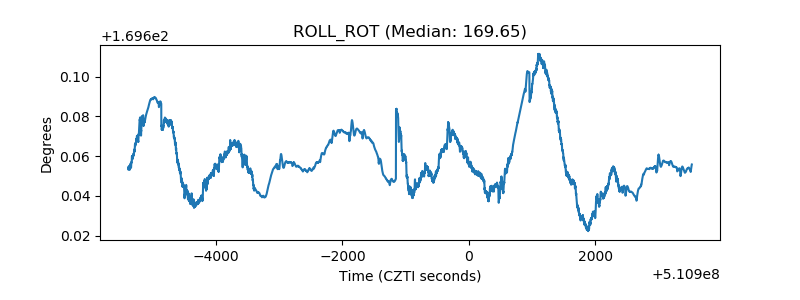 |
| _Roll_DEC | 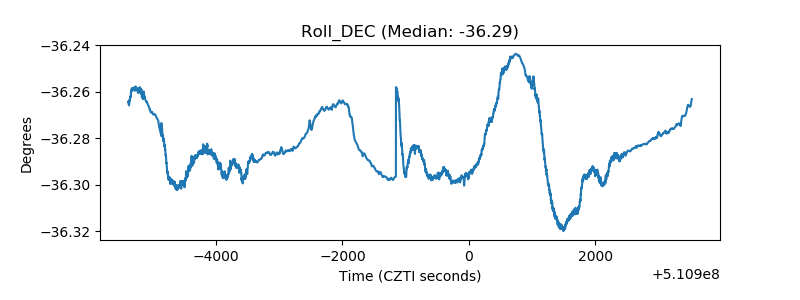 |
| _Roll_RA | 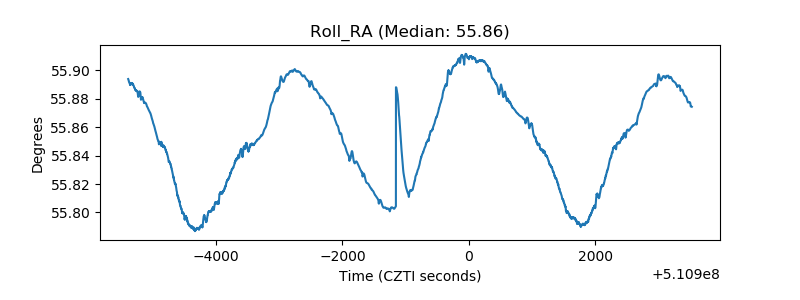 |
| Veto Counter | 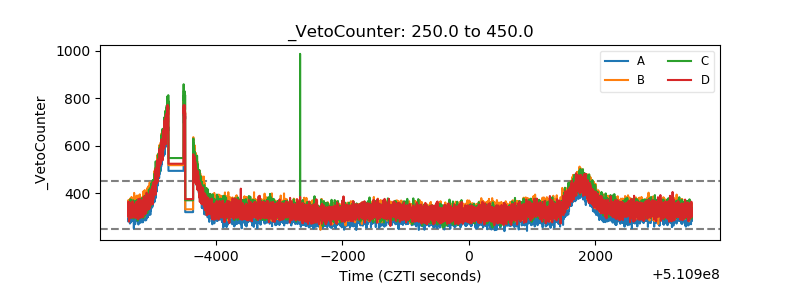 |