| Param | Original file | Final file |
|---|---|---|
| Filename | modeM0/AS1A14_060T01_9000006556_56541cztM0_level2.fits | modeM0/AS1A14_060T01_9000006556_56541cztM0_level2_quad_clean.evt |
| Size (bytes) | 573,940,800 | 116,922,240 |
| Size | 547.4 MB | 111.5 MB |
| Events in quadrant A | 4,240,571 | 774,842 |
| Events in quadrant B | 7,338,020 | 759,318 |
| Events in quadrant C | 4,896,576 | 735,732 |
| Events in quadrant D | 4,128,194 | 695,544 |
| Mode M0 | |||
|---|---|---|---|
| Quadrant | BADHDUFLAG | Total packets | Discarded packets |
| A | 0 | 18529 | 0 |
| B | 0 | 27521 | 0 |
| C | 0 | 20463 | 0 |
| D | 0 | 18061 | 1 |
| Mode SS | |||
|---|---|---|---|
| Quadrant | BADHDUFLAG | Total packets | Discarded packets |
| A | 0 | 166 | 0 |
| B | 0 | 166 | 0 |
| C | 0 | 166 | 0 |
| D | 0 | 166 | 0 |
| Quadrant | Total seconds | Saturated seconds | Saturation percentage |
|---|---|---|---|
| A | 8270 | 70 | 0.846433% |
| B | 8270 | 1083 | 13.095526% |
| C | 8270 | 251 | 3.035067% |
| D | 8270 | 34 | 0.411125% |
Noise dominated data is calculated using 1-second bins in cleaned event files. If a bin has >2000 counts, and if more than 50% of those come from <1% of pixels, then it is considered to be noise-dominated and hence unusable.
| Quadrant | # 1 sec bins | Bins with >0 counts | Bins with >2000 counts | High rate bins dominated by noise | Noise dominated (total time) | Noise dominated (detector-on time) | Marked lightcurve |
|---|---|---|---|---|---|---|---|
| A | 8270 | 8270 | 47 | 47 | 0.57% | 0.57% | 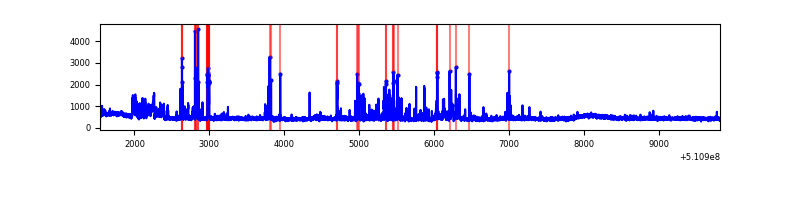 |
| B | 8270 | 8270 | 480 | 480 | 5.80% | 5.80% | 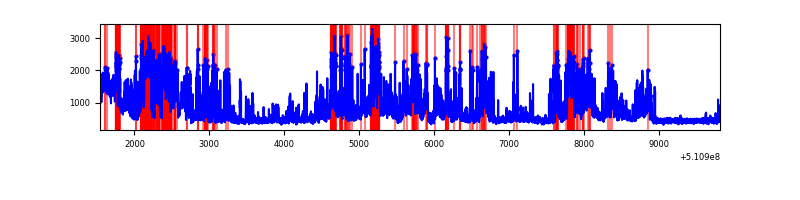 |
| C | 8270 | 8270 | 256 | 256 | 3.10% | 3.10% | 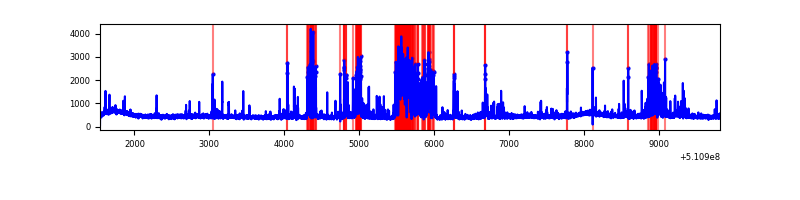 |
| D | 8270 | 8270 | 30 | 30 | 0.36% | 0.36% | 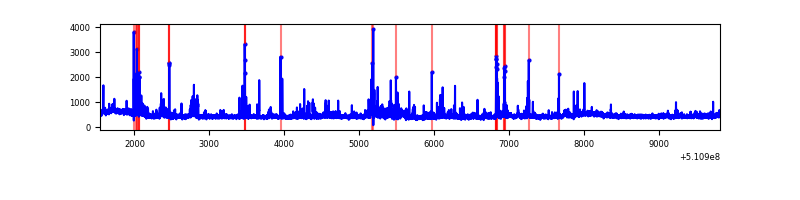 |
Top three noisy pixels from each quadrant. If the there are fewer than three noisy pixels in the level2.evt file, extra rows are filled as -1
| Pixel properties | Quadrant properties | ||||||
|---|---|---|---|---|---|---|---|
| Quadrant | DetID | PixID | Counts | Sigma | Mean | Median | Sigma |
| A | 4 | 95 | 232556 | 1023.53 | 915 | 891 | 226.3 |
| A | 10 | 251 | 203310 | 894.32 | 915 | 891 | 226.3 |
| A | 4 | 249 | 149653 | 657.25 | 915 | 891 | 226.3 |
| B | 5 | 185 | 2034196 | 10690.05 | 878 | 843 | 190.2 |
| B | 4 | 206 | 1565926 | 8228.19 | 878 | 843 | 190.2 |
| B | 4 | 171 | 127163 | 664.11 | 878 | 843 | 190.2 |
| C | 15 | 230 | 843516 | 3505.41 | 888 | 876 | 240.4 |
| C | 12 | 252 | 254370 | 1054.54 | 888 | 876 | 240.4 |
| C | 13 | 3 | 203532 | 843.06 | 888 | 876 | 240.4 |
| D | 3 | 12 | 147025 | 582.02 | 887 | 845 | 251.2 |
| D | 2 | 249 | 111422 | 440.27 | 887 | 845 | 251.2 |
| D | 2 | 31 | 76530 | 301.34 | 887 | 845 | 251.2 |
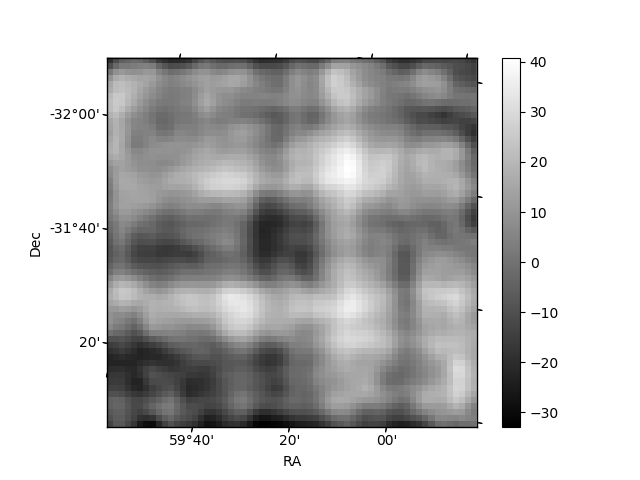
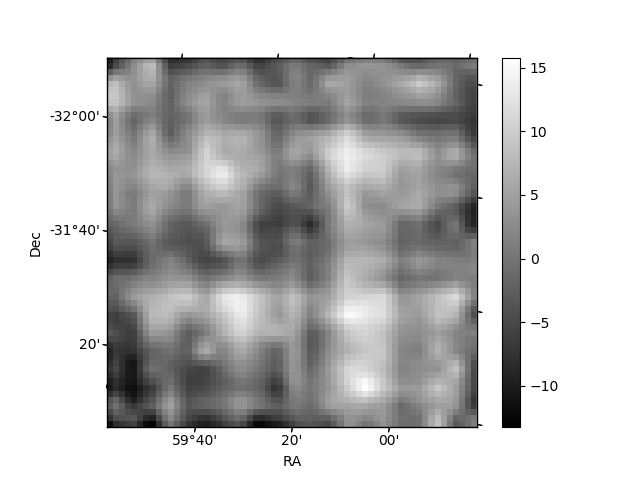
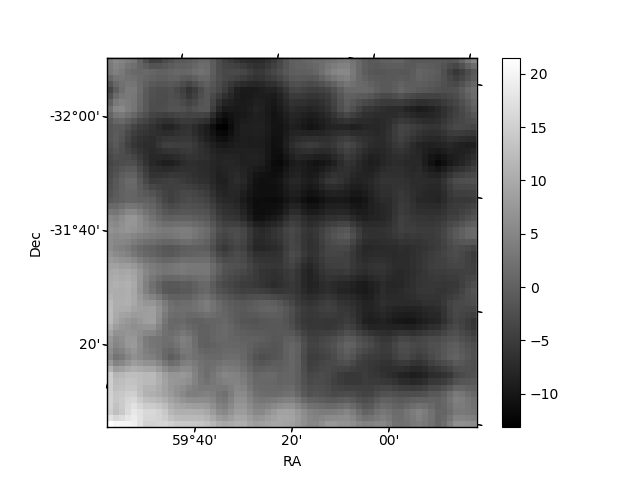
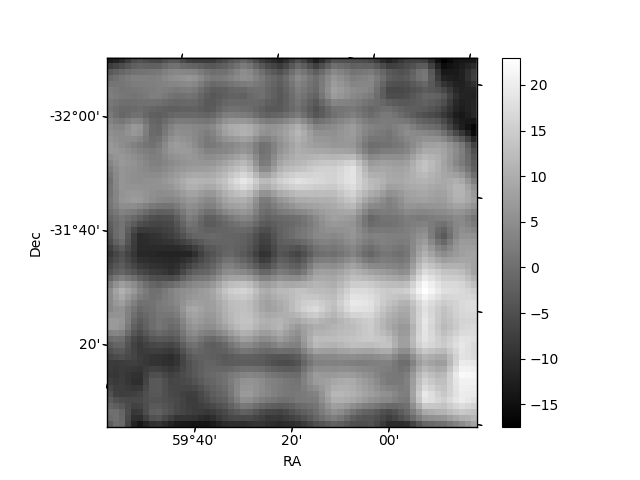
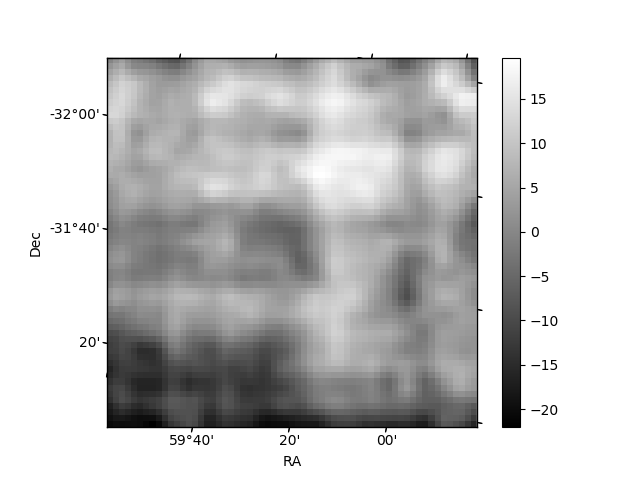
Histogram calculated using DETX and DETY for each event in the final _common_clean file
| Quadrant A | 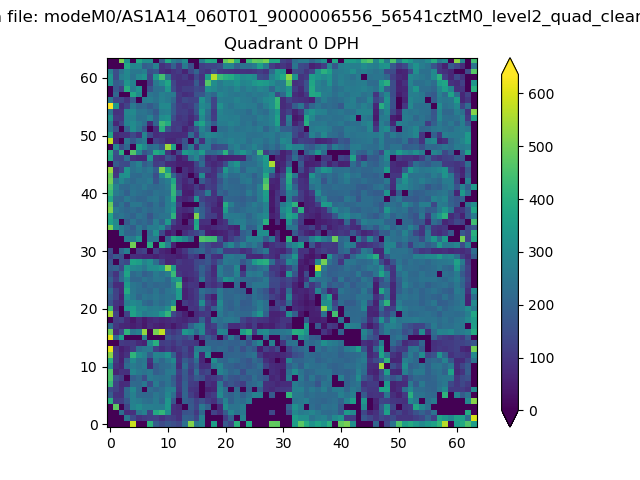 |
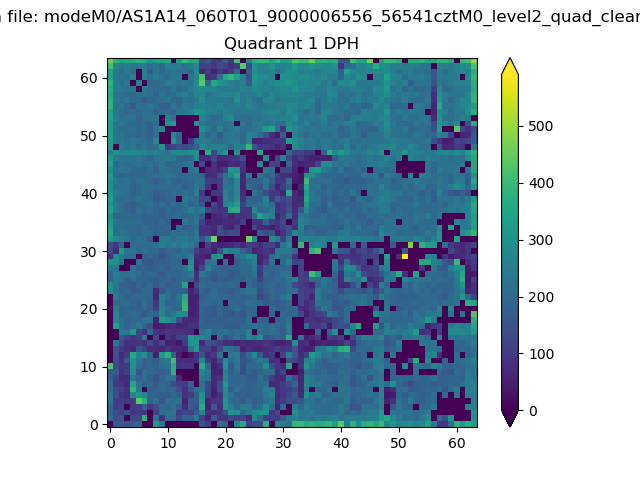 |
Quadrant B |
|---|---|---|---|
| Quadrant D | 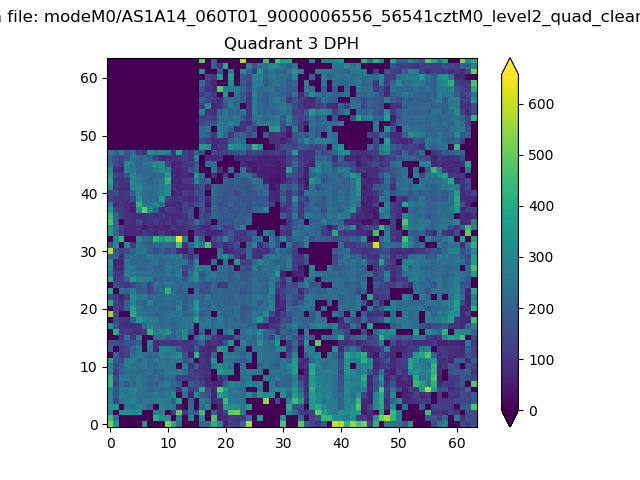 |
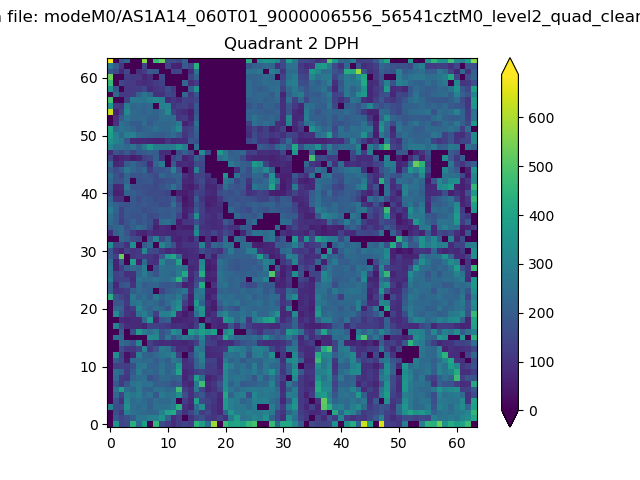 |
Quadrant C |
| Plot type | Count rate plots | Images |
|---|---|---|
| Comparison with Poisson distribution Blue bars denote a histogram of data divided into 1 sec bins. Red curve is a Poisson curve with rate = median count rate of data. |
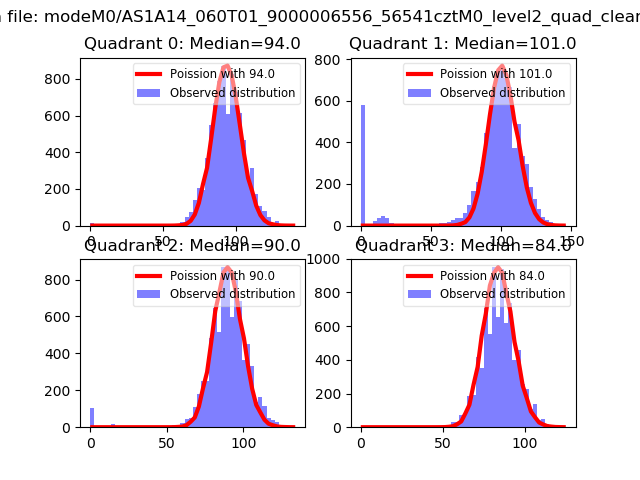 |
 |
| Quadrant-wise count rates Data is divided into 100 sec bins |
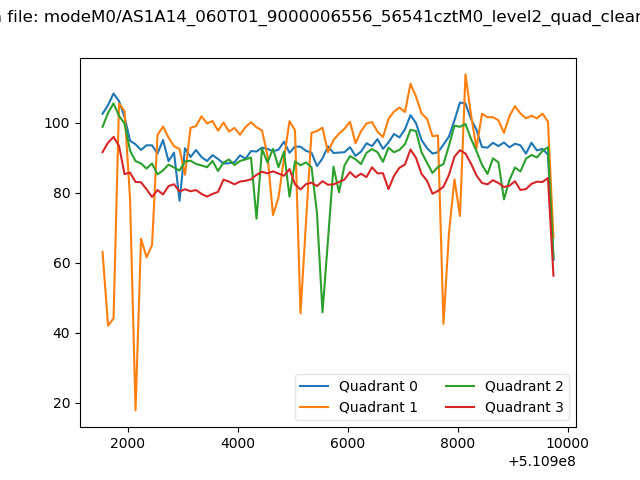 |
|
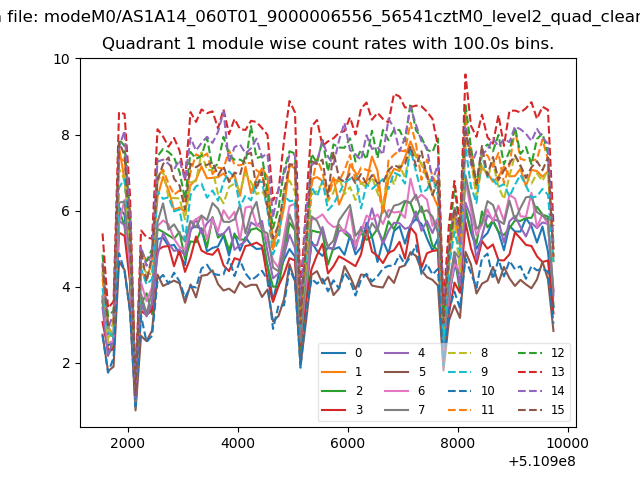
| Module-wise count rates for Quadrant A Data is divided into 100 sec bins |
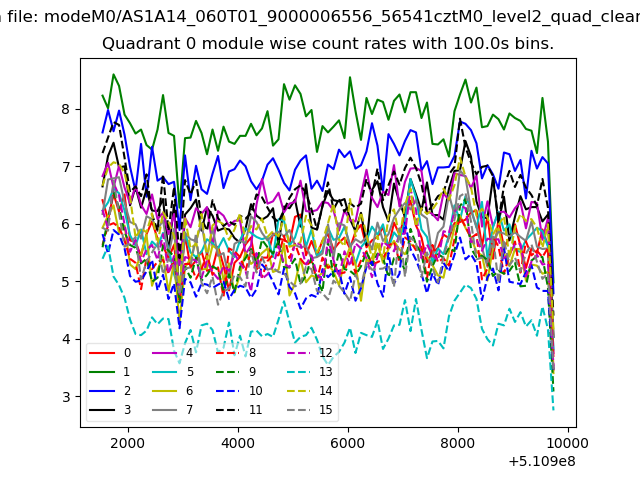 |
 |
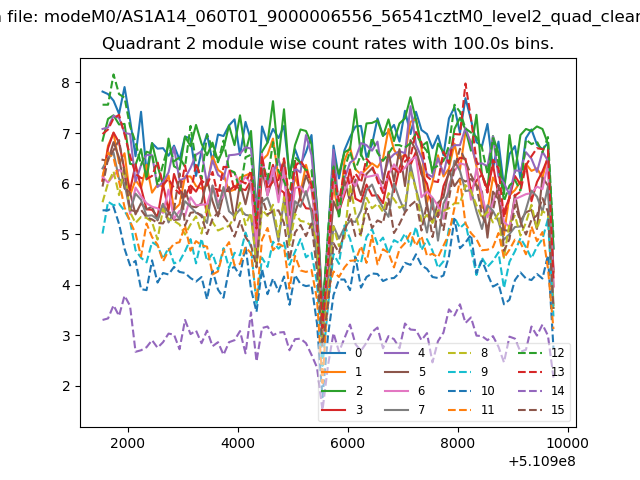
| Module-wise count rates for Quadrant B Data is divided into 100 sec bins |
 |
 |
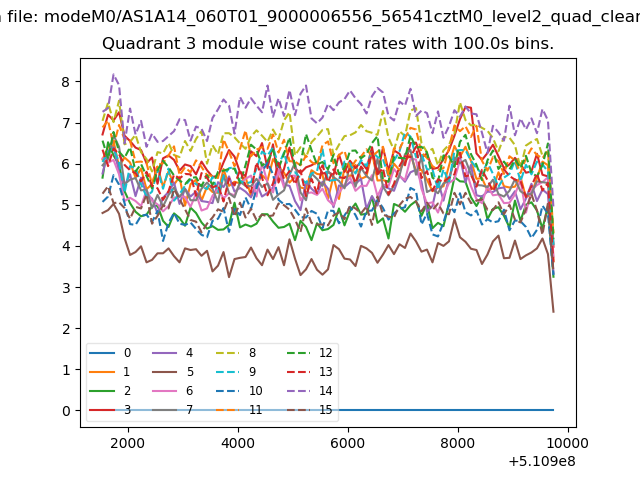
| Module-wise count rates for Quadrant C Data is divided into 100 sec bins |
 |
 |
| Module-wise count rates for Quadrant D Data is divided into 100 sec bins |
 |
 |
| Parameter | Plot |
|---|---|
| CZT HV Monitor |  |
| D_VDD | 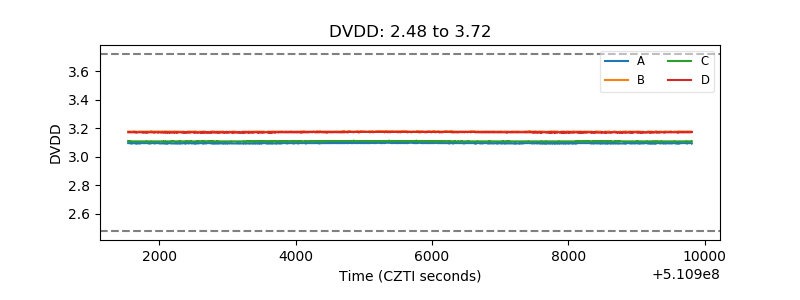 |
| Temperature 1 | 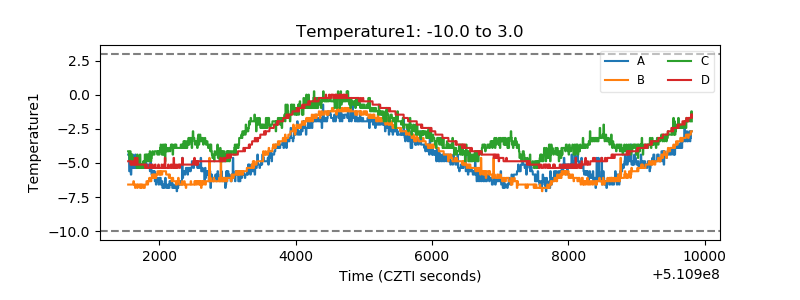 |
| Veto HV Monitor | 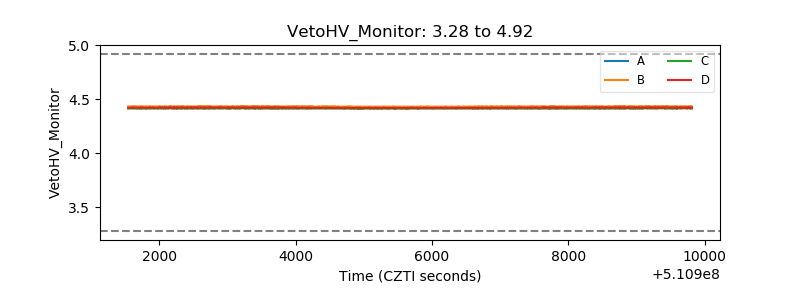 |
| Veto LLD | 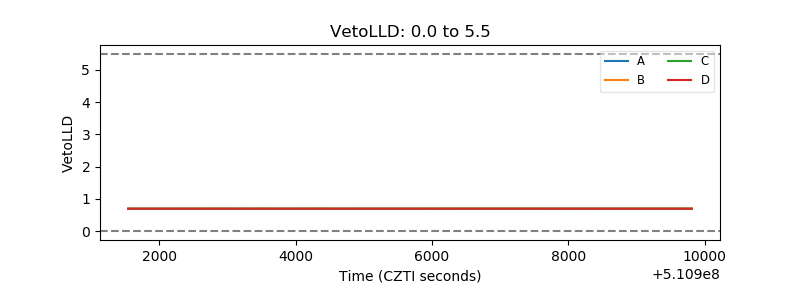 |
| Alpha Counter | 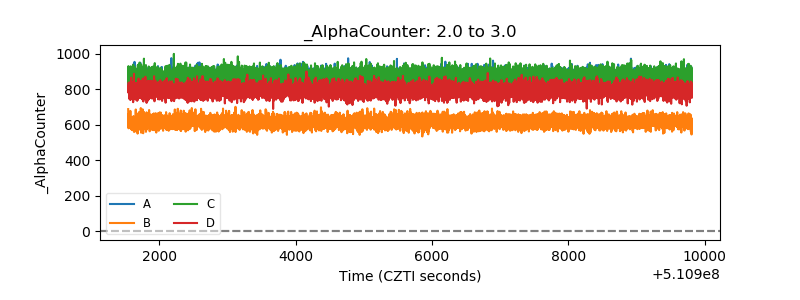 |
| _CPM_Rate | 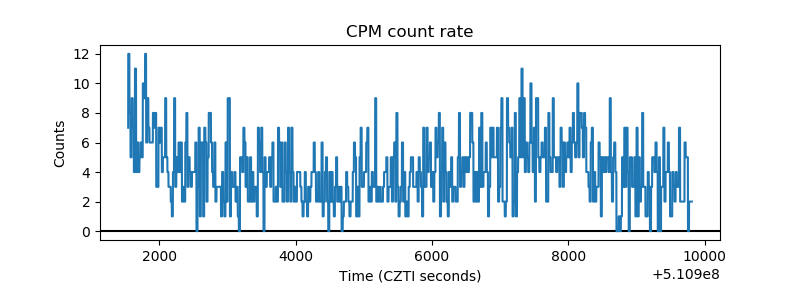 |
| CZT Counter | 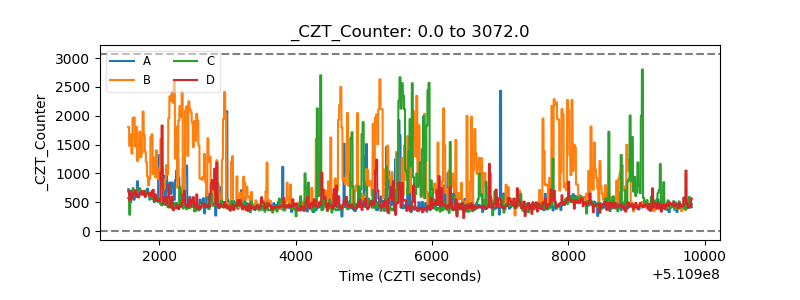 |
| +2.5 Volts monitor | 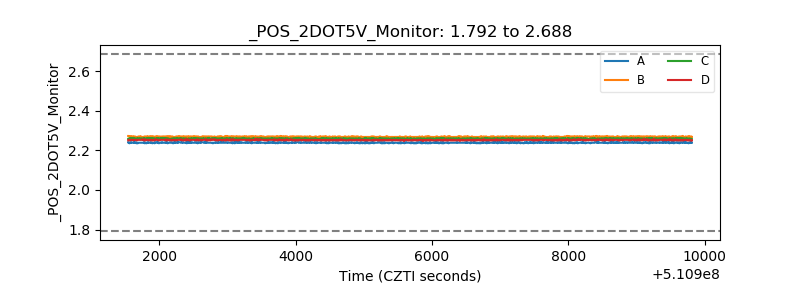 |
| +5 Volts monitor | 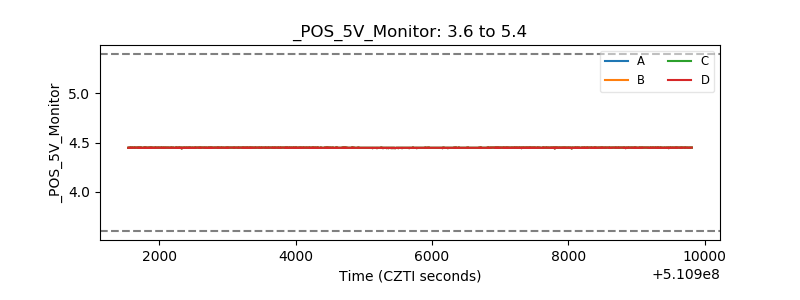 |
| _ROLL_ROT | 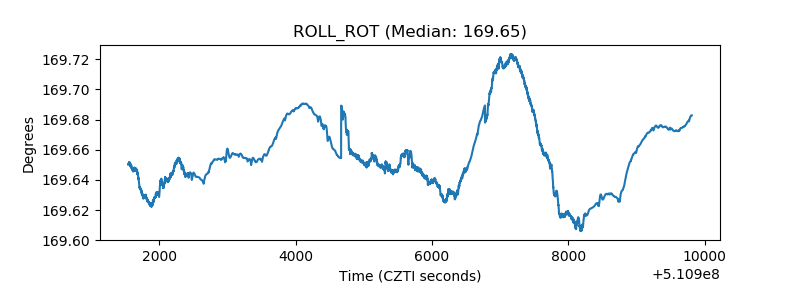 |
| _Roll_DEC | 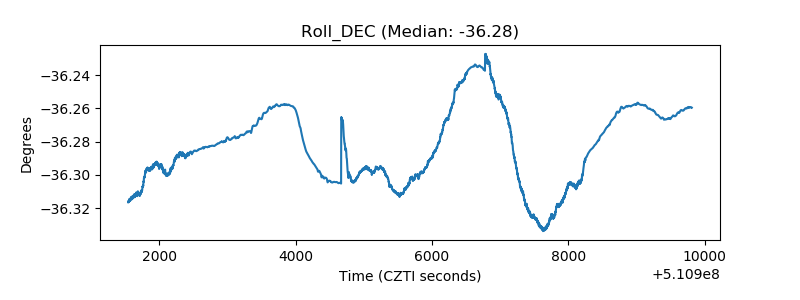 |
| _Roll_RA | 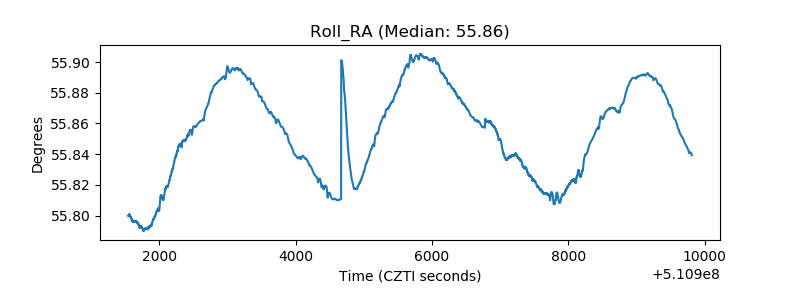 |
| Veto Counter | 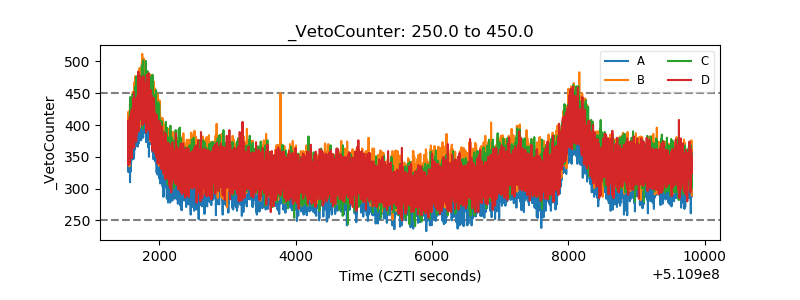 |