| Param | Original file | Final file |
|---|---|---|
| Filename | modeM0/AS1A14_060T01_9000006556_56544cztM0_level2.fits | modeM0/AS1A14_060T01_9000006556_56544cztM0_level2_quad_clean.evt |
| Size (bytes) | 1,162,802,880 | 217,586,880 |
| Size | 1.1 GB | 207.5 MB |
| Events in quadrant A | 7,563,285 | 1,471,103 |
| Events in quadrant B | 14,626,006 | 1,372,338 |
| Events in quadrant C | 10,563,360 | 1,347,741 |
| Events in quadrant D | 9,058,595 | 1,299,236 |
| Mode M0 | |||
|---|---|---|---|
| Quadrant | BADHDUFLAG | Total packets | Discarded packets |
| A | 0 | 34148 | 1 |
| B | 0 | 54247 | 3 |
| C | 0 | 42816 | 1 |
| D | 0 | 38104 | 1 |
| Mode M9 | |||
|---|---|---|---|
| Quadrant | BADHDUFLAG | Total packets | Discarded packets |
| A | 0 | 3 | 0 |
| B | 0 | 3 | 0 |
| C | 0 | 3 | 0 |
| D | 0 | 3 | 0 |
| Mode SS | |||
|---|---|---|---|
| Quadrant | BADHDUFLAG | Total packets | Discarded packets |
| A | 0 | 320 | 0 |
| B | 0 | 320 | 0 |
| C | 0 | 320 | 0 |
| D | 0 | 320 | 0 |
| Quadrant | Total seconds | Saturated seconds | Saturation percentage |
|---|---|---|---|
| A | 15912 | 194 | 1.219206% |
| B | 15911 | 2397 | 15.065049% |
| C | 15911 | 1077 | 6.768902% |
| D | 15912 | 455 | 2.859477% |
Noise dominated data is calculated using 1-second bins in cleaned event files. If a bin has >2000 counts, and if more than 50% of those come from <1% of pixels, then it is considered to be noise-dominated and hence unusable.
| Quadrant | # 1 sec bins | Bins with >0 counts | Bins with >2000 counts | High rate bins dominated by noise | Noise dominated (total time) | Noise dominated (detector-on time) | Marked lightcurve |
|---|---|---|---|---|---|---|---|
| A | 16142 | 15915 | 35 | 35 | 0.22% | 0.22% | 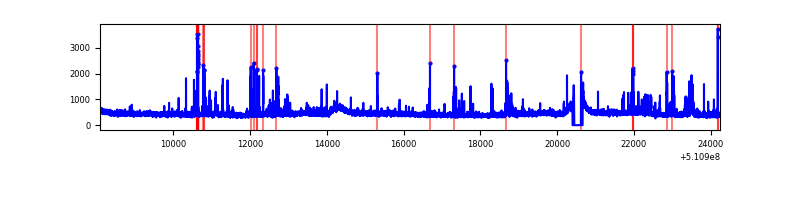 |
| B | 16141 | 15914 | 1556 | 1556 | 9.64% | 9.78% | 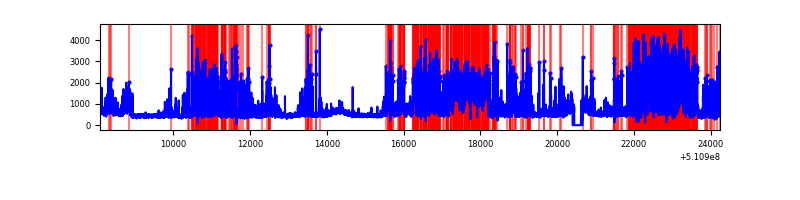 |
| C | 16141 | 15914 | 891 | 891 | 5.52% | 5.60% | 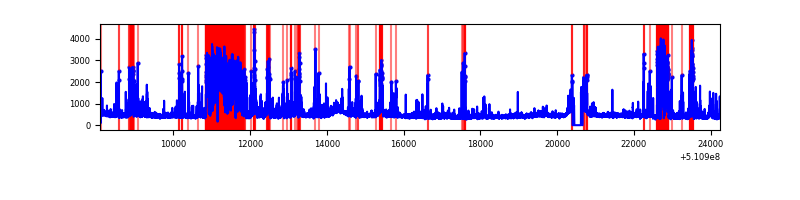 |
| D | 16142 | 15915 | 364 | 364 | 2.25% | 2.29% | 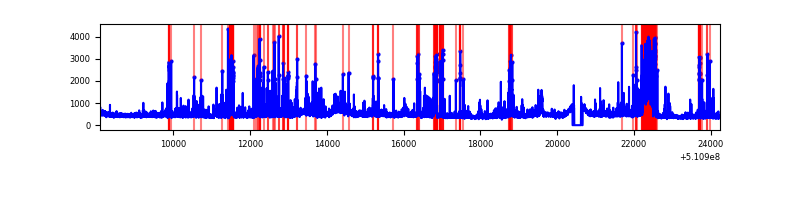 |
Top three noisy pixels from each quadrant. If the there are fewer than three noisy pixels in the level2.evt file, extra rows are filled as -1
| Pixel properties | Quadrant properties | ||||||
|---|---|---|---|---|---|---|---|
| Quadrant | DetID | PixID | Counts | Sigma | Mean | Median | Sigma |
| A | 4 | 249 | 223990 | 516.46 | 1739 | 1697 | 430.4 |
| A | 8 | 206 | 141025 | 323.7 | 1739 | 1697 | 430.4 |
| A | 10 | 251 | 98042 | 223.84 | 1739 | 1697 | 430.4 |
| B | 4 | 206 | 5176226 | 14946.33 | 1627 | 1568 | 346.2 |
| B | 5 | 185 | 1940146 | 5599.33 | 1627 | 1568 | 346.2 |
| B | 4 | 171 | 294508 | 846.12 | 1627 | 1568 | 346.2 |
| C | 15 | 230 | 2704154 | 5986.79 | 1650 | 1634 | 451.4 |
| C | 12 | 252 | 506296 | 1117.96 | 1650 | 1634 | 451.4 |
| C | 13 | 3 | 479693 | 1059.02 | 1650 | 1634 | 451.4 |
| D | 2 | 249 | 987084 | 2079.42 | 1670 | 1593 | 473.9 |
| D | 8 | 240 | 373376 | 784.48 | 1670 | 1593 | 473.9 |
| D | 8 | 129 | 296558 | 622.39 | 1670 | 1593 | 473.9 |
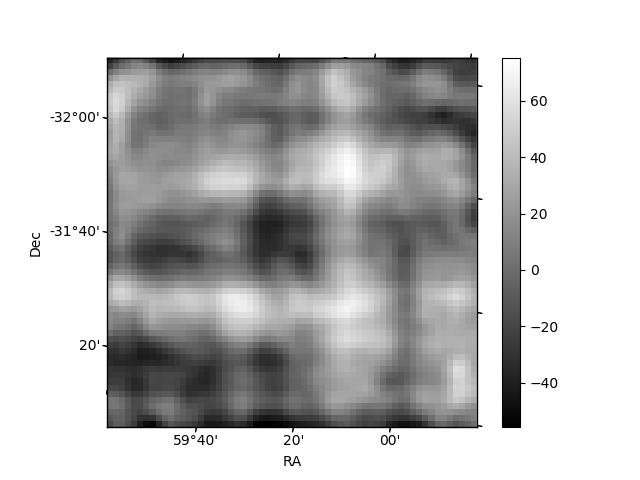
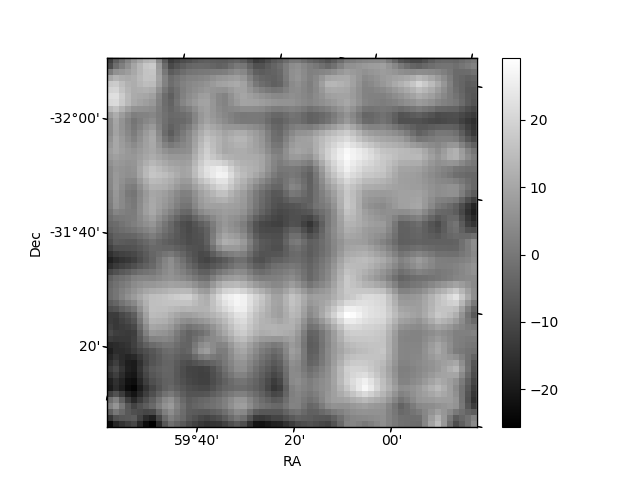
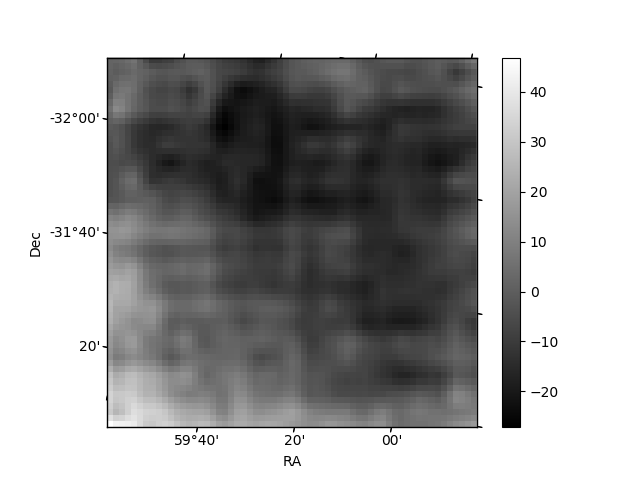
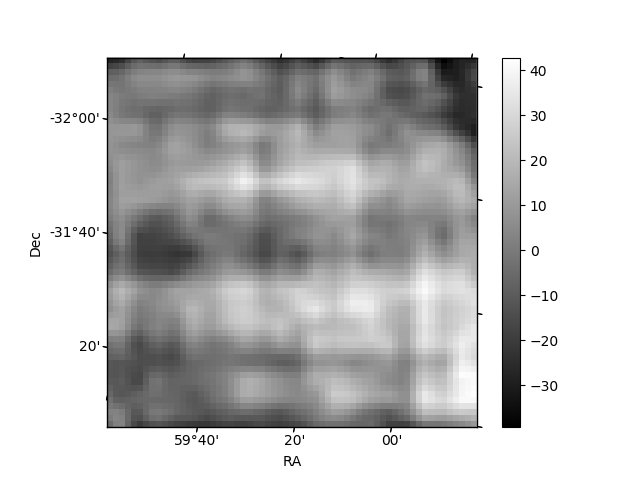
Histogram calculated using DETX and DETY for each event in the final _common_clean file
| Quadrant A | 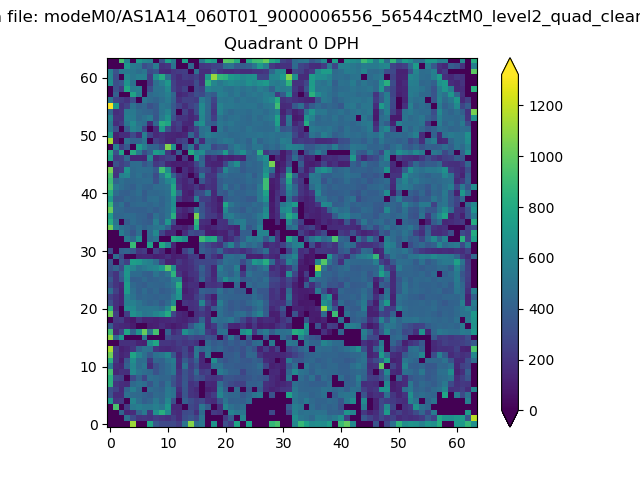 |
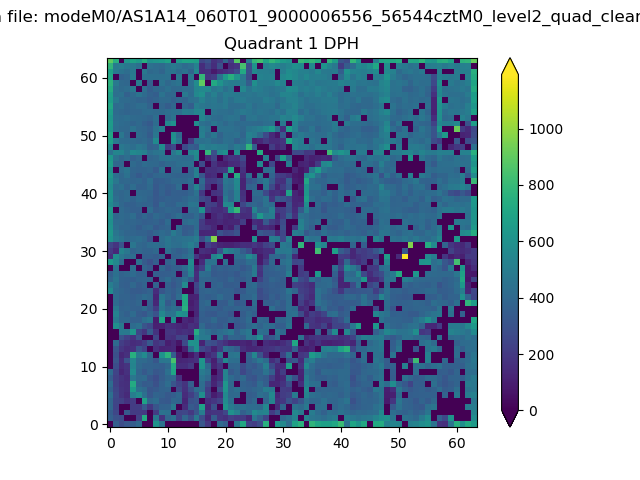 |
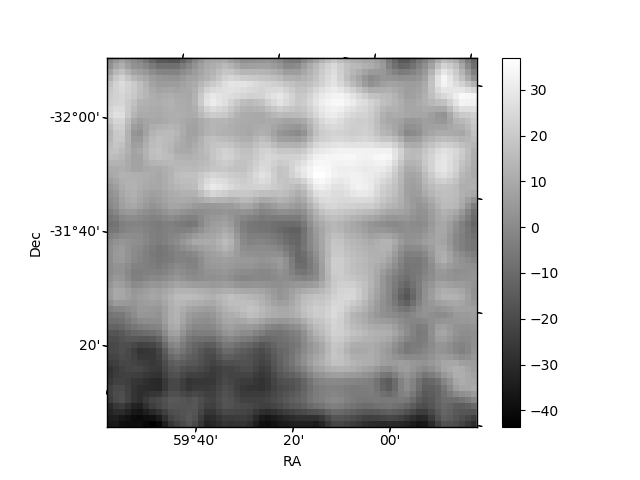
Quadrant B |
|---|---|---|---|
| Quadrant D | 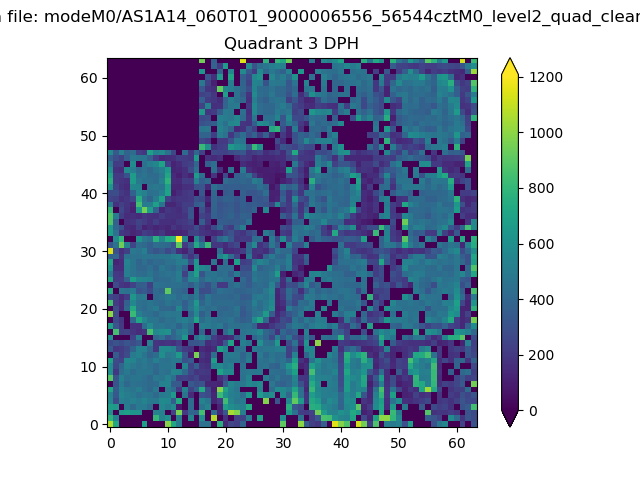 |
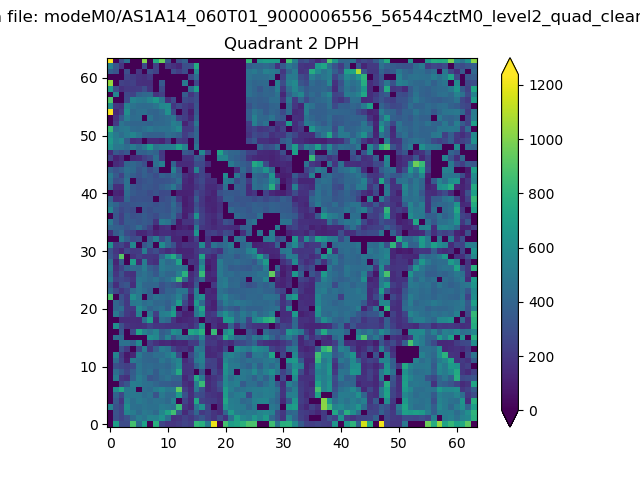 |
Quadrant C |
| Plot type | Count rate plots | Images |
|---|---|---|
| Comparison with Poisson distribution Blue bars denote a histogram of data divided into 1 sec bins. Red curve is a Poisson curve with rate = median count rate of data. |
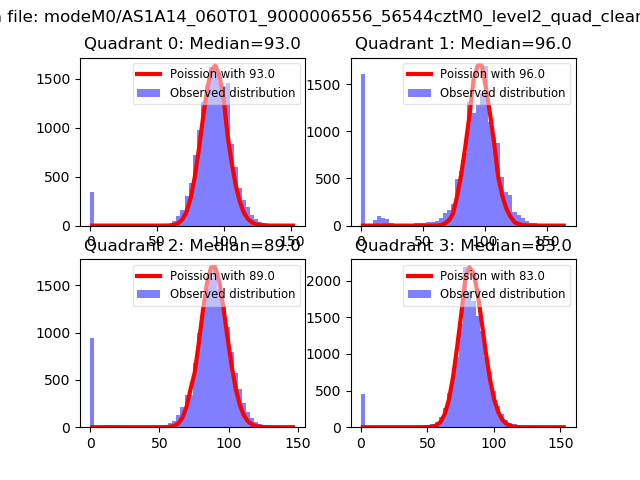 |
 |
| Quadrant-wise count rates Data is divided into 100 sec bins |
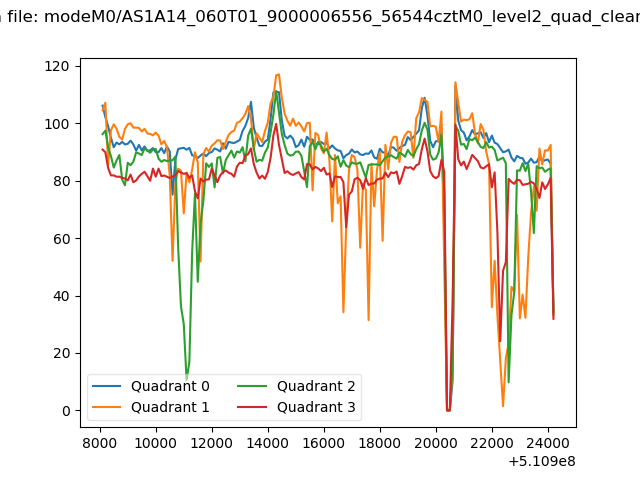 |
|
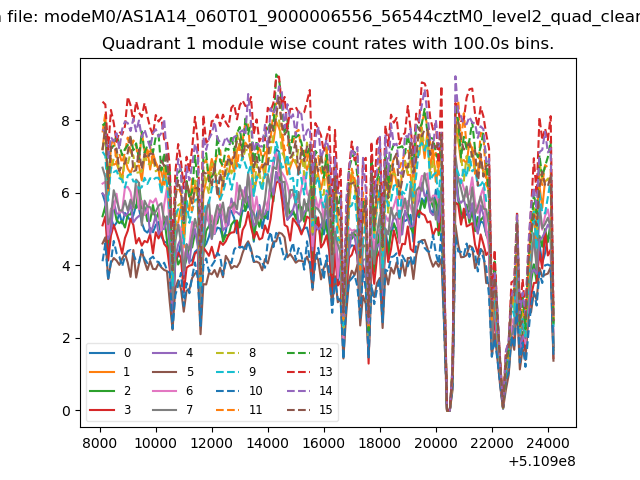
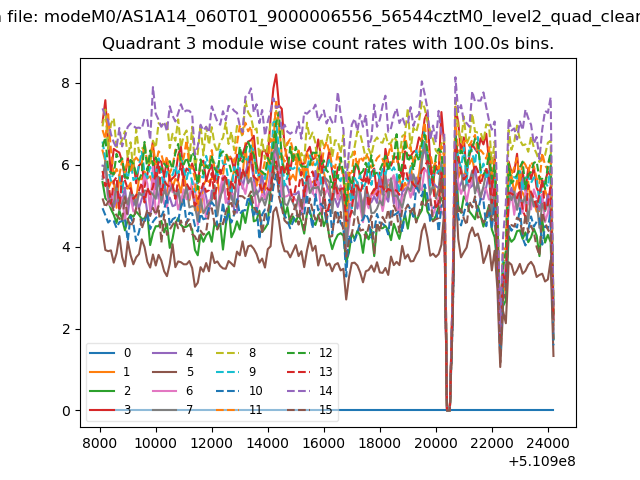
| Module-wise count rates for Quadrant A Data is divided into 100 sec bins |
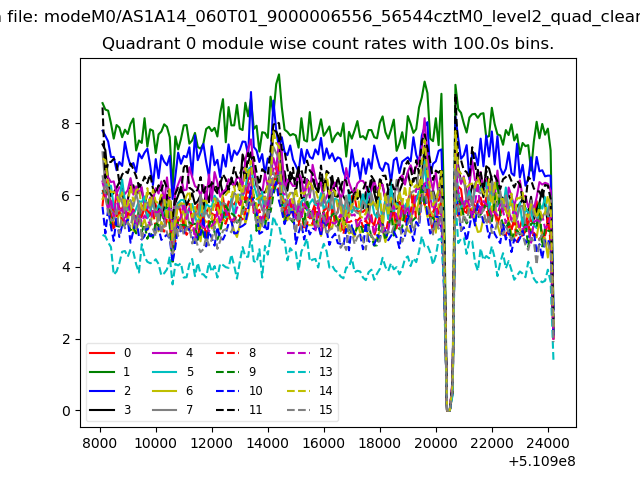 |
 |
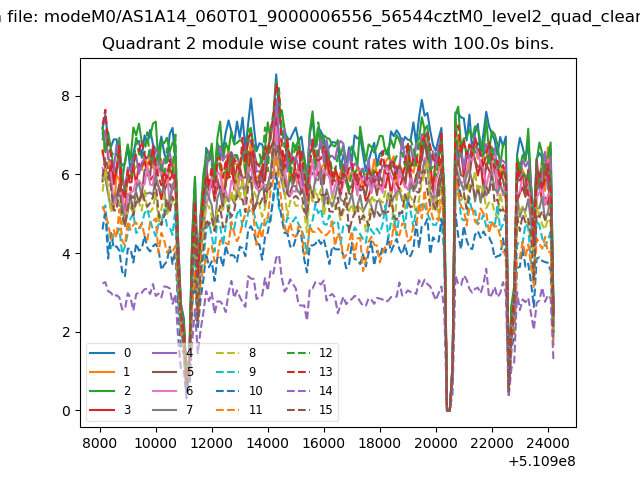
| Module-wise count rates for Quadrant B Data is divided into 100 sec bins |
 |
 |
| Module-wise count rates for Quadrant C Data is divided into 100 sec bins |
 |
 |
| Module-wise count rates for Quadrant D Data is divided into 100 sec bins |
 |
 |
| Parameter | Plot |
|---|---|
| CZT HV Monitor | 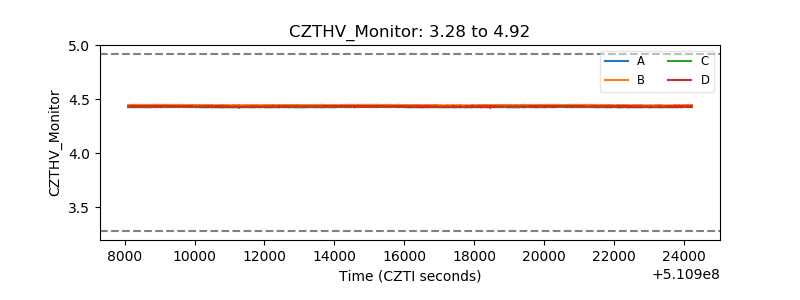 |
| D_VDD | 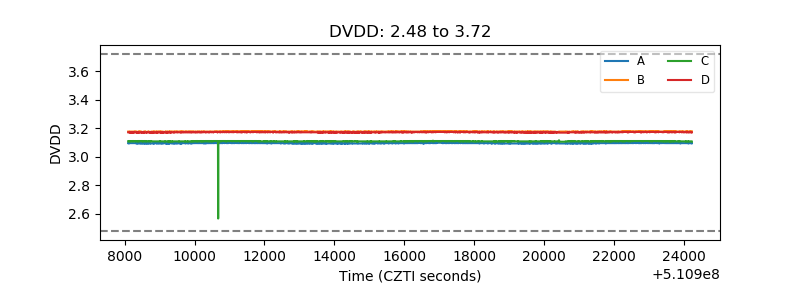 |
| Temperature 1 | 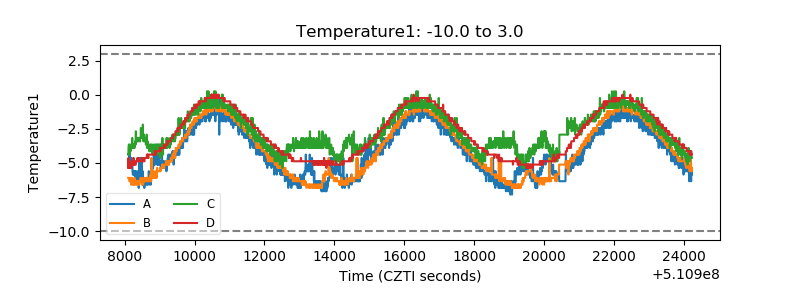 |
| Veto HV Monitor | 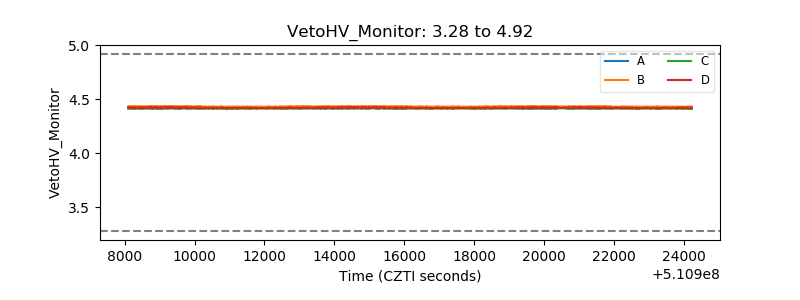 |
| Veto LLD | 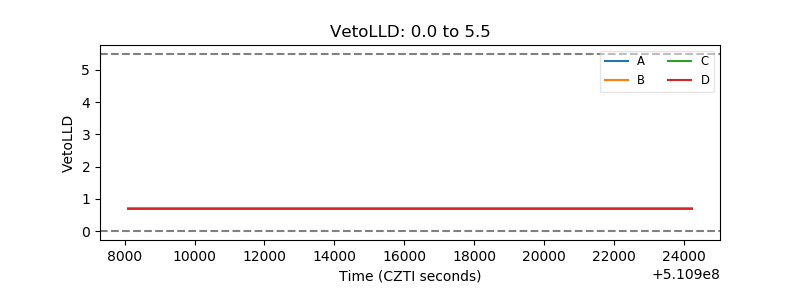 |
| Alpha Counter | 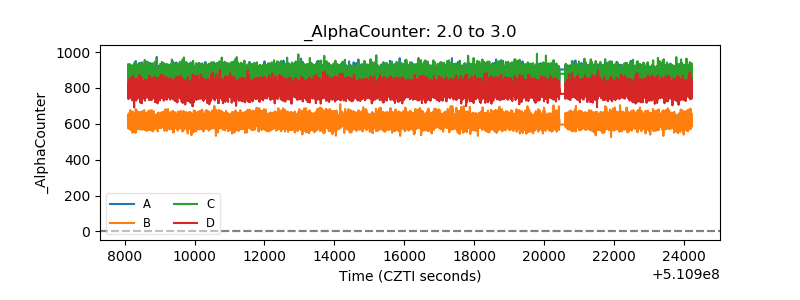 |
| _CPM_Rate | 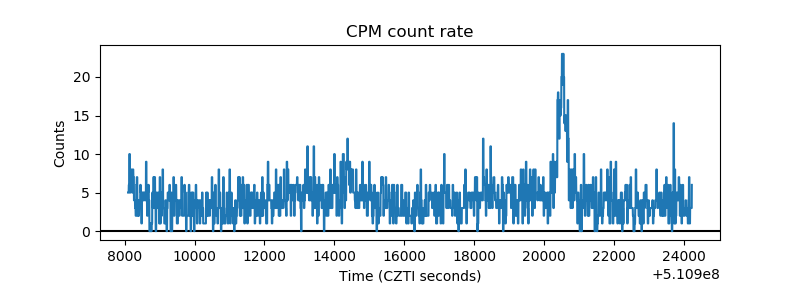 |
| CZT Counter | 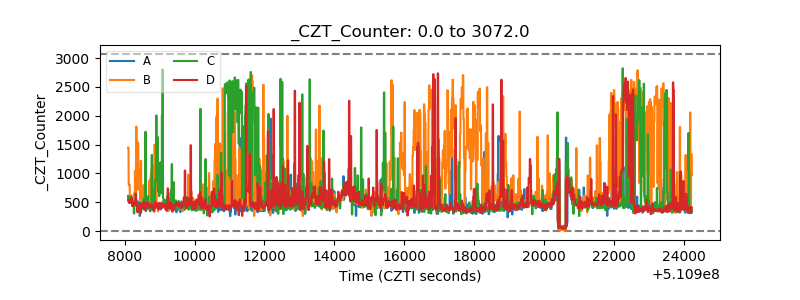 |
| +2.5 Volts monitor | 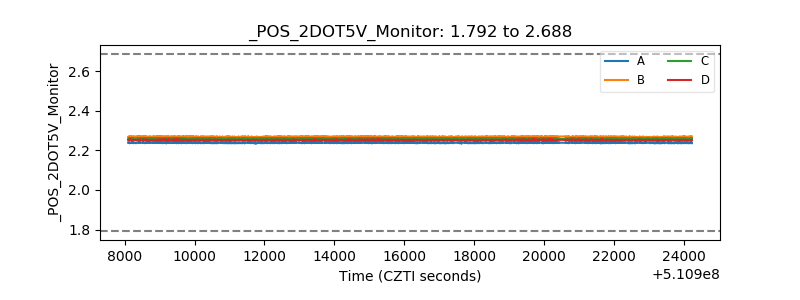 |
| +5 Volts monitor | 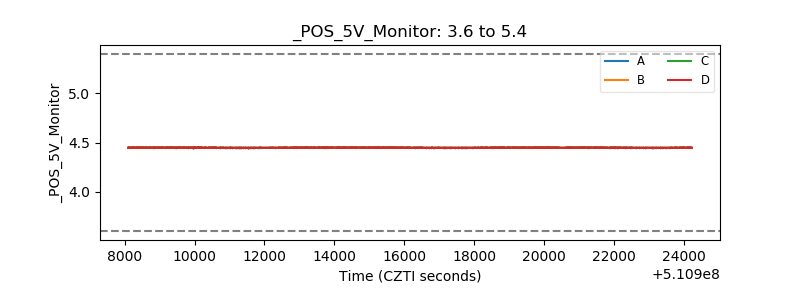 |
| _ROLL_ROT | 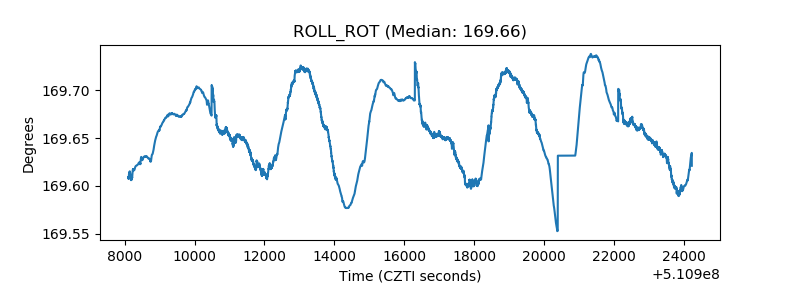 |
| _Roll_DEC | 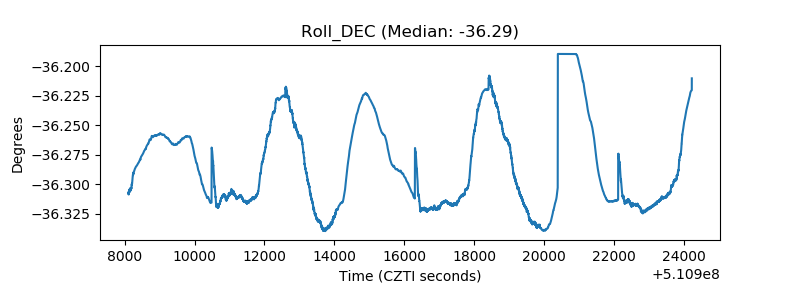 |
| _Roll_RA | 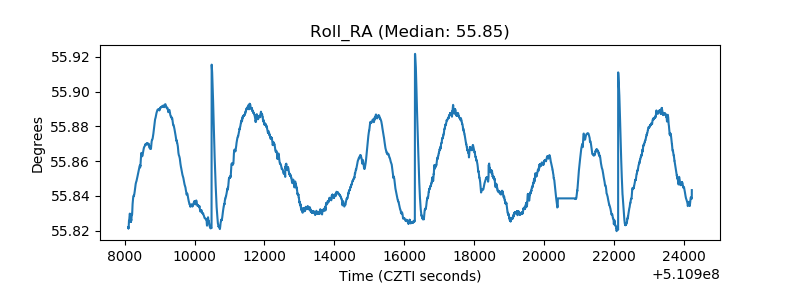 |
| Veto Counter | 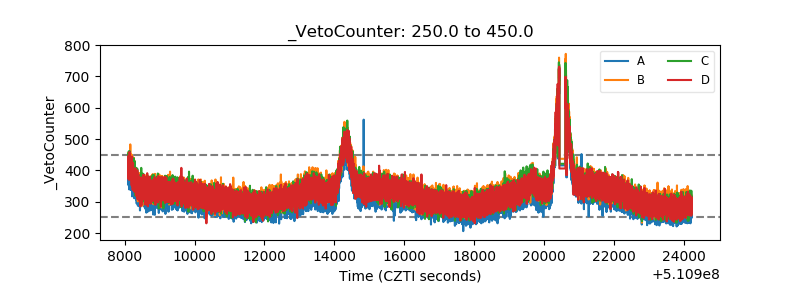 |