| Param | Original file | Final file |
|---|---|---|
| Filename | modeM0/AS1A14_060T01_9000006556_56545cztM0_level2.fits | modeM0/AS1A14_060T01_9000006556_56545cztM0_level2_quad_clean.evt |
| Size (bytes) | 782,115,840 | 143,320,320 |
| Size | 745.9 MB | 136.7 MB |
| Events in quadrant A | 6,000,278 | 962,464 |
| Events in quadrant B | 10,500,816 | 866,273 |
| Events in quadrant C | 5,667,860 | 923,328 |
| Events in quadrant D | 5,977,689 | 867,428 |
| Mode M0 | |||
|---|---|---|---|
| Quadrant | BADHDUFLAG | Total packets | Discarded packets |
| A | 0 | 25069 | 2 |
| B | 0 | 38428 | 2 |
| C | 0 | 24326 | 2 |
| D | 0 | 24998 | 2 |
| Mode M9 | |||
|---|---|---|---|
| Quadrant | BADHDUFLAG | Total packets | Discarded packets |
| A | 0 | 12 | 0 |
| B | 0 | 12 | 0 |
| C | 0 | 12 | 0 |
| D | 0 | 12 | 0 |
| Mode SS | |||
|---|---|---|---|
| Quadrant | BADHDUFLAG | Total packets | Discarded packets |
| A | 0 | 214 | 0 |
| B | 0 | 214 | 0 |
| C | 0 | 214 | 0 |
| D | 0 | 214 | 0 |
| Quadrant | Total seconds | Saturated seconds | Saturation percentage |
|---|---|---|---|
| A | 10380 | 228 | 2.196532% |
| B | 10381 | 2185 | 21.048069% |
| C | 10381 | 236 | 2.273384% |
| D | 10381 | 258 | 2.485310% |
Noise dominated data is calculated using 1-second bins in cleaned event files. If a bin has >2000 counts, and if more than 50% of those come from <1% of pixels, then it is considered to be noise-dominated and hence unusable.
| Quadrant | # 1 sec bins | Bins with >0 counts | Bins with >2000 counts | High rate bins dominated by noise | Noise dominated (total time) | Noise dominated (detector-on time) | Marked lightcurve |
|---|---|---|---|---|---|---|---|
| A | 11700 | 10383 | 147 | 147 | 1.26% | 1.42% | 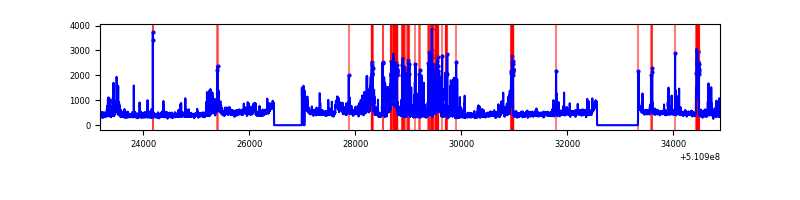 |
| B | 11701 | 10384 | 1222 | 1222 | 10.44% | 11.77% | 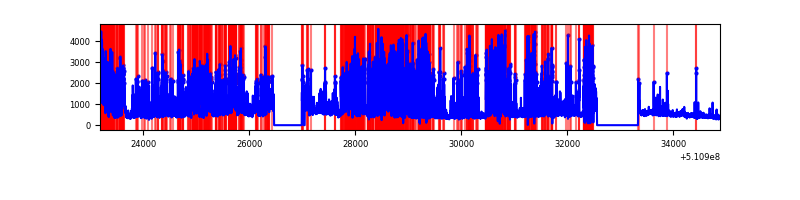 |
| C | 11701 | 10384 | 163 | 163 | 1.39% | 1.57% | 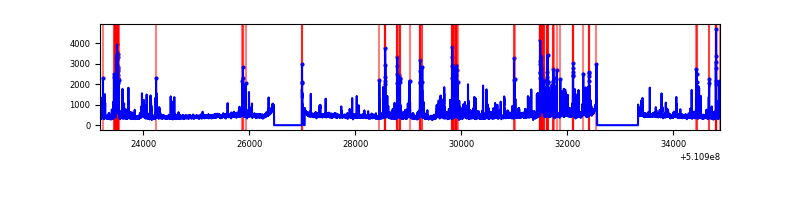 |
| D | 11701 | 10384 | 184 | 184 | 1.57% | 1.77% | 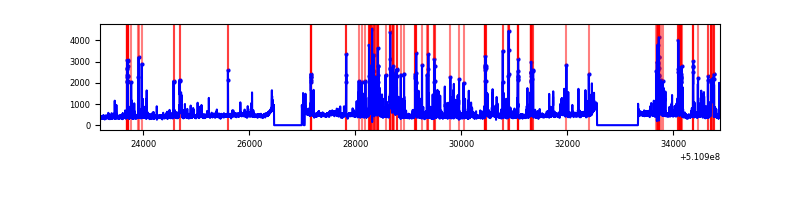 |
Top three noisy pixels from each quadrant. If the there are fewer than three noisy pixels in the level2.evt file, extra rows are filled as -1
| Pixel properties | Quadrant properties | ||||||
|---|---|---|---|---|---|---|---|
| Quadrant | DetID | PixID | Counts | Sigma | Mean | Median | Sigma |
| A | 4 | 249 | 467233 | 1666.14 | 1133 | 1105 | 279.8 |
| A | 7 | 64 | 463510 | 1652.83 | 1133 | 1105 | 279.8 |
| A | 4 | 95 | 269570 | 959.61 | 1133 | 1105 | 279.8 |
| B | 4 | 206 | 5254943 | 23862.27 | 1030 | 992 | 220.2 |
| B | 5 | 185 | 496036 | 2248.38 | 1030 | 992 | 220.2 |
| B | 7 | 252 | 149689 | 675.35 | 1030 | 992 | 220.2 |
| C | 15 | 230 | 428118 | 1427.56 | 1094 | 1085 | 299.1 |
| C | 6 | 223 | 388708 | 1295.81 | 1094 | 1085 | 299.1 |
| C | 14 | 254 | 142734 | 473.53 | 1094 | 1085 | 299.1 |
| D | 2 | 249 | 544637 | 1755.29 | 1090 | 1040 | 309.7 |
| D | 2 | 31 | 202288 | 649.84 | 1090 | 1040 | 309.7 |
| D | 8 | 240 | 179893 | 577.52 | 1090 | 1040 | 309.7 |
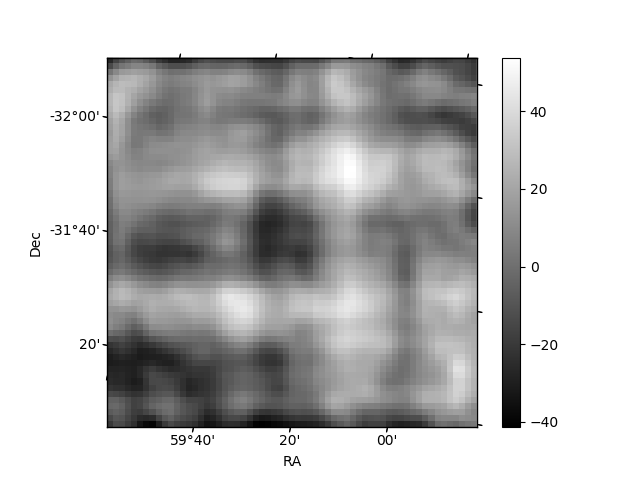
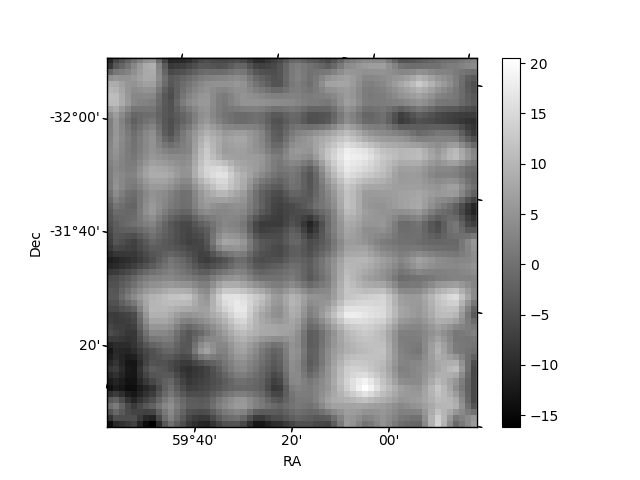
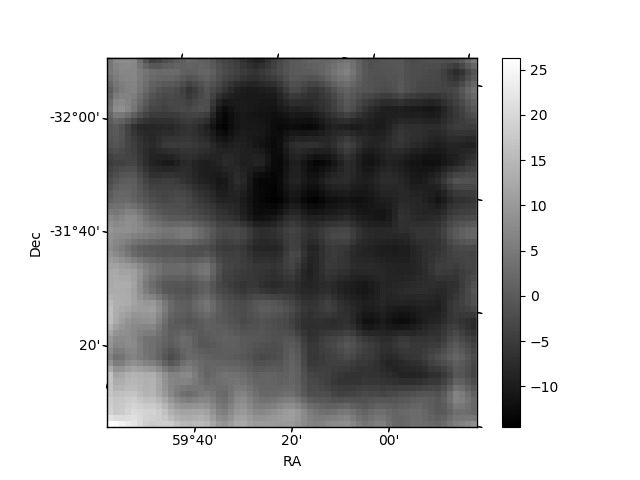
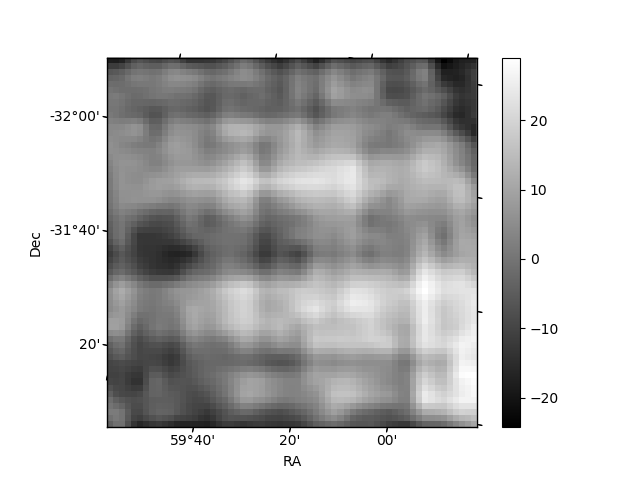
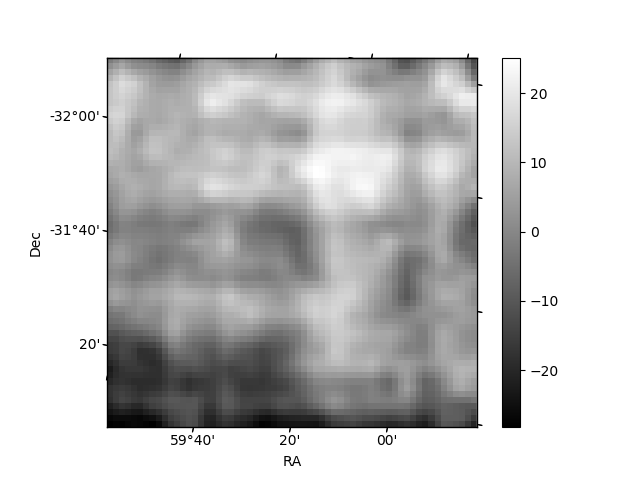
Histogram calculated using DETX and DETY for each event in the final _common_clean file
| Quadrant A | 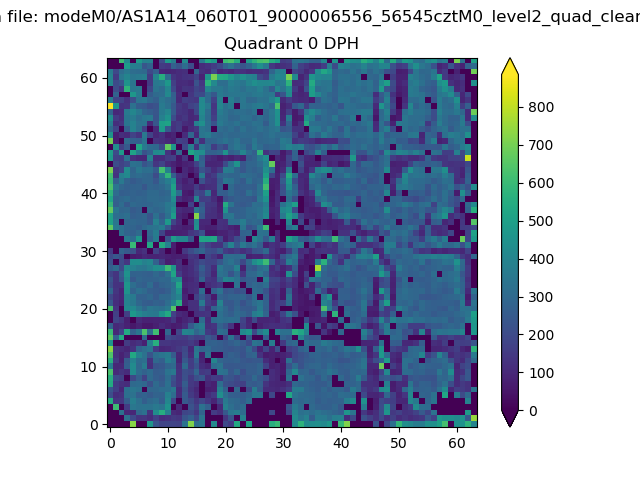 |
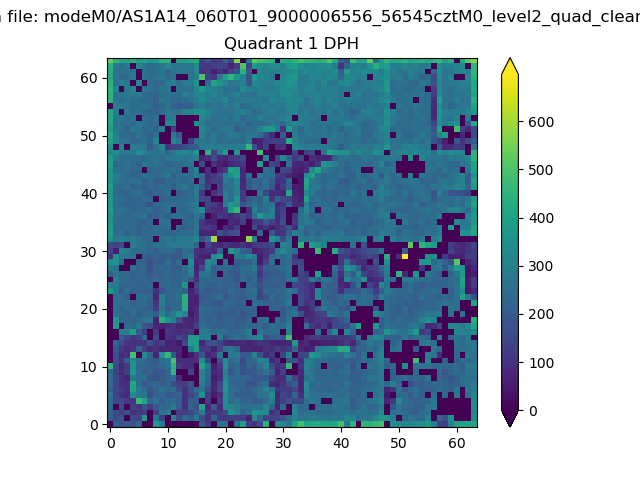 |
Quadrant B |
|---|---|---|---|
| Quadrant D | 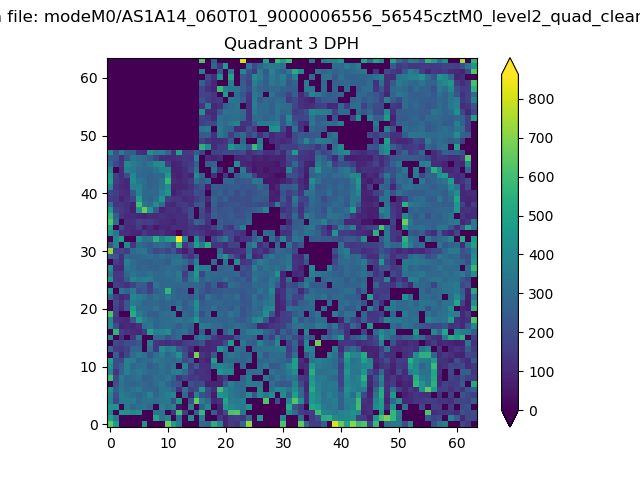 |
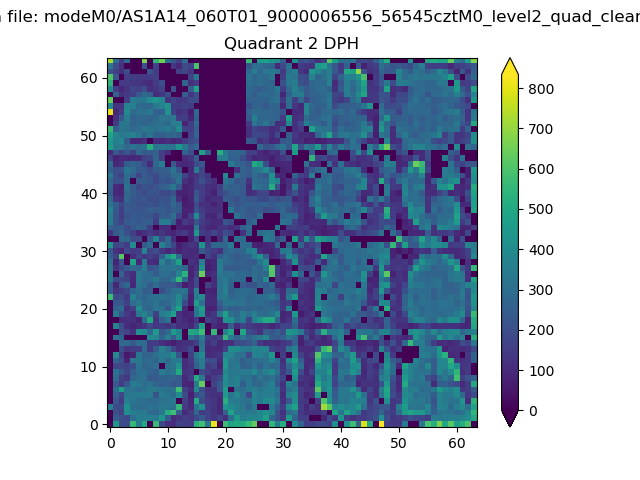 |
Quadrant C |
| Plot type | Count rate plots | Images |
|---|---|---|
| Comparison with Poisson distribution Blue bars denote a histogram of data divided into 1 sec bins. Red curve is a Poisson curve with rate = median count rate of data. |
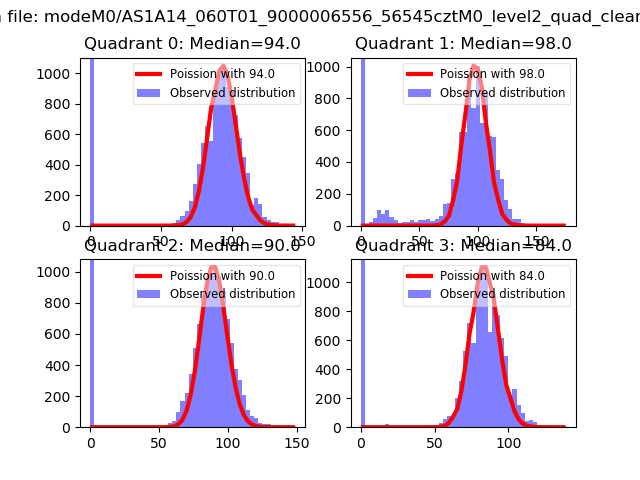 |
 |
| Quadrant-wise count rates Data is divided into 100 sec bins |
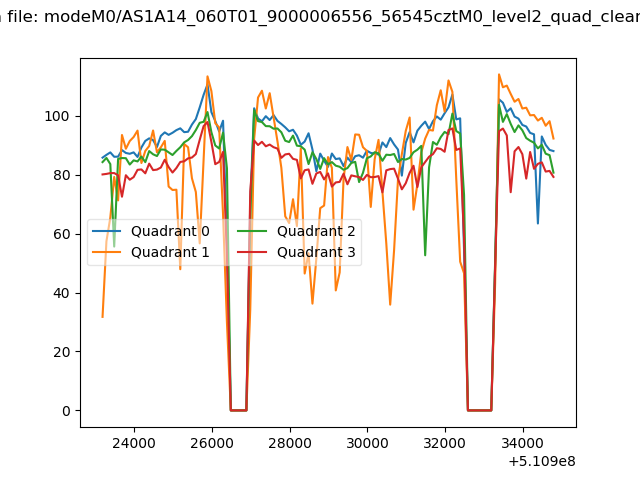 |
|
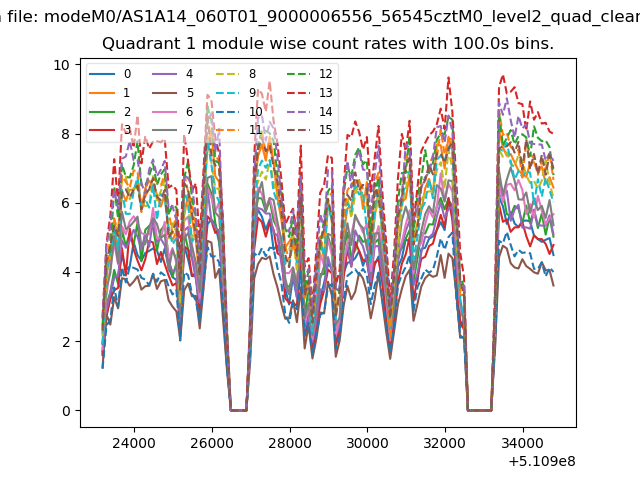
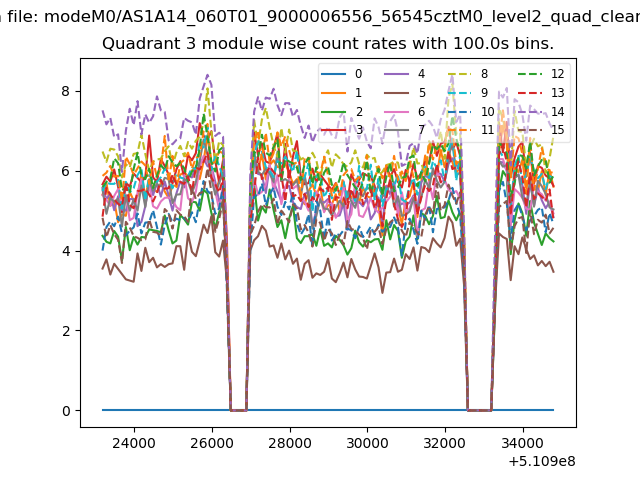
| Module-wise count rates for Quadrant A Data is divided into 100 sec bins |
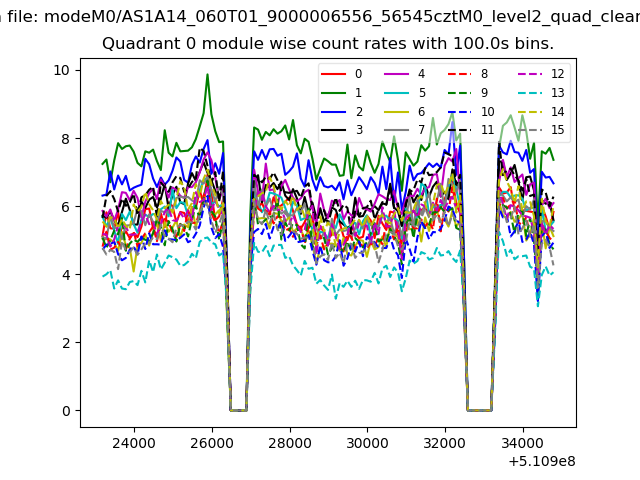 |
 |
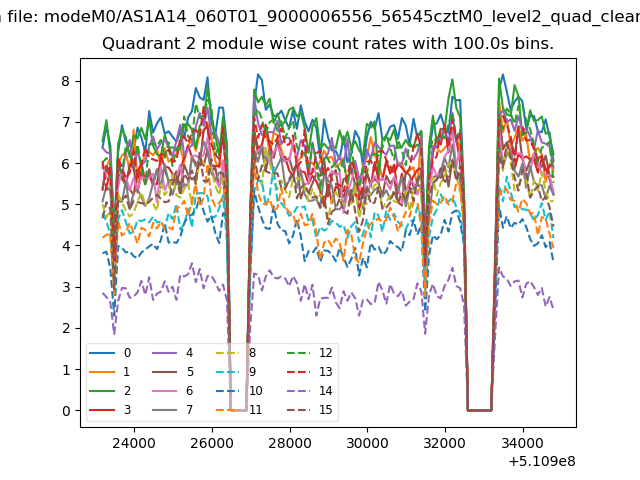
| Module-wise count rates for Quadrant B Data is divided into 100 sec bins |
 |
 |
| Module-wise count rates for Quadrant C Data is divided into 100 sec bins |
 |
 |
| Module-wise count rates for Quadrant D Data is divided into 100 sec bins |
 |
 |
| Parameter | Plot |
|---|---|
| CZT HV Monitor | 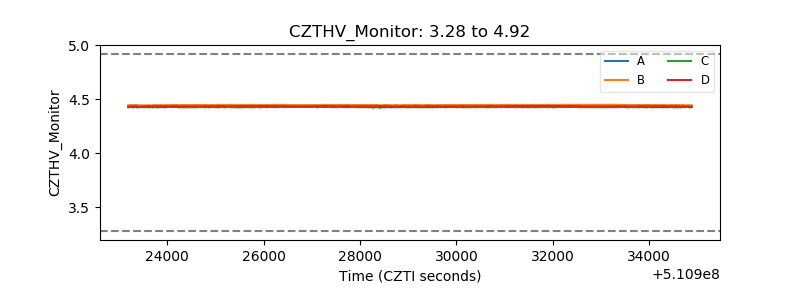 |
| D_VDD | 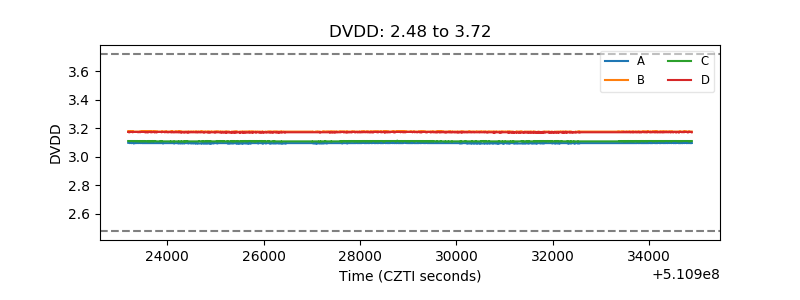 |
| Temperature 1 | 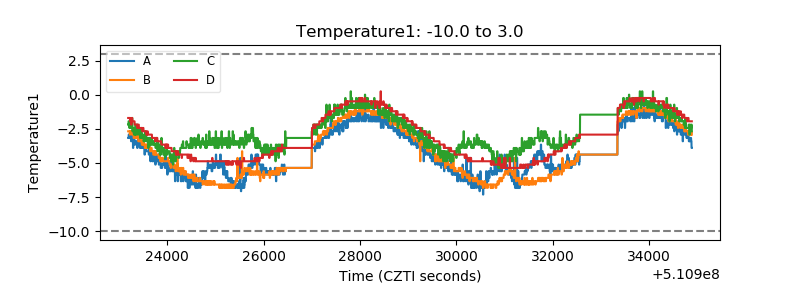 |
| Veto HV Monitor | 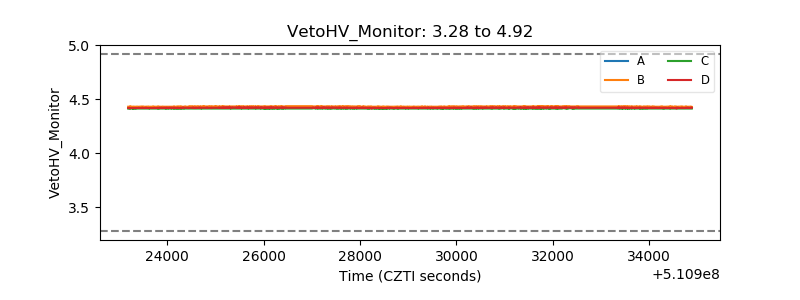 |
| Veto LLD | 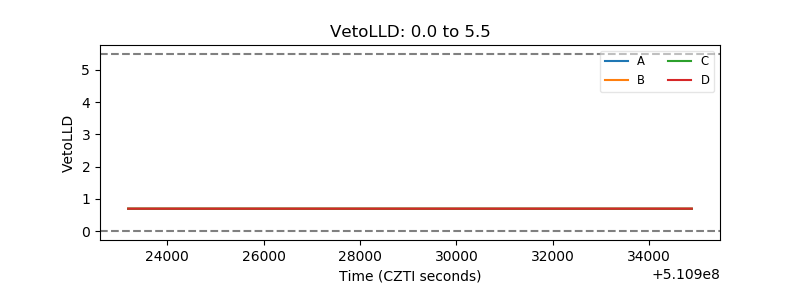 |
| Alpha Counter | 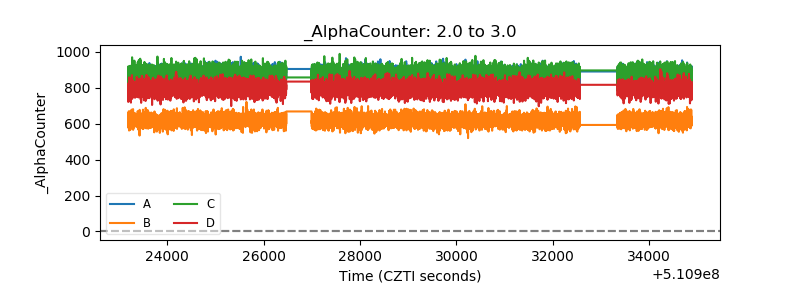 |
| _CPM_Rate | 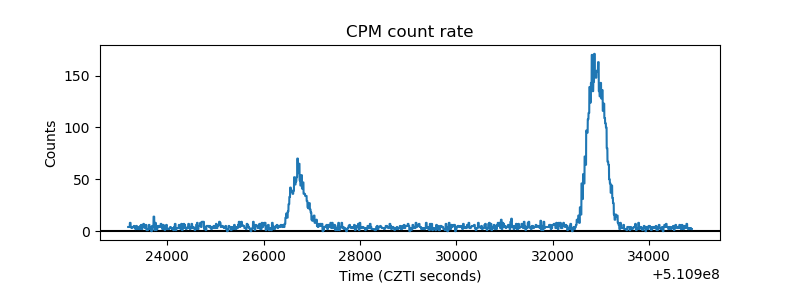 |
| CZT Counter | 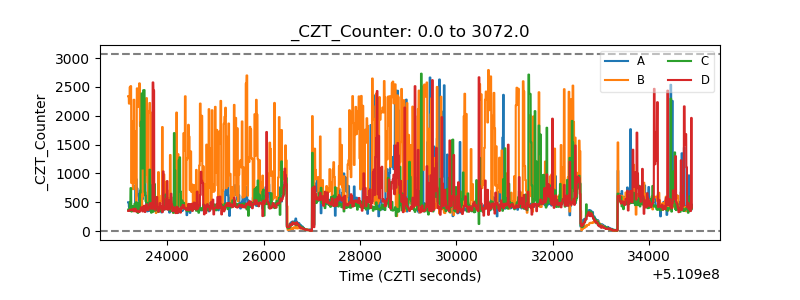 |
| +2.5 Volts monitor | 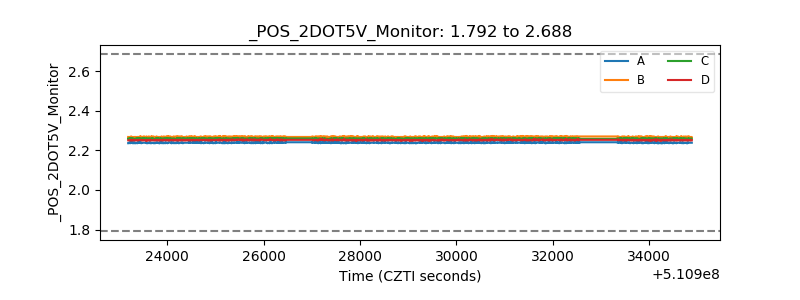 |
| +5 Volts monitor | 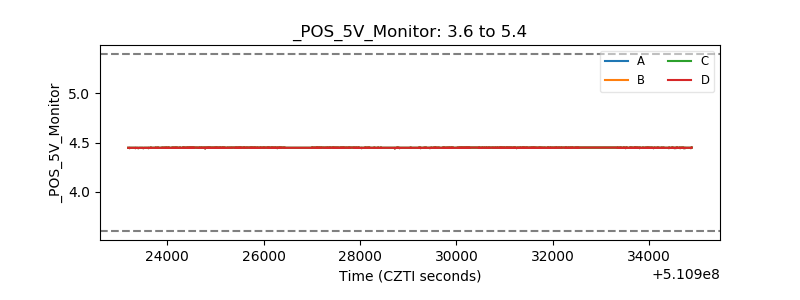 |
| _ROLL_ROT | 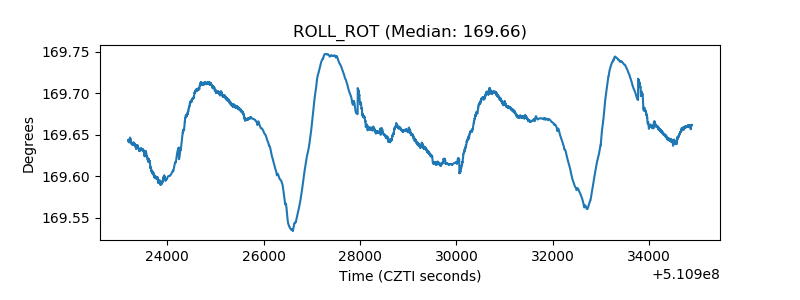 |
| _Roll_DEC | 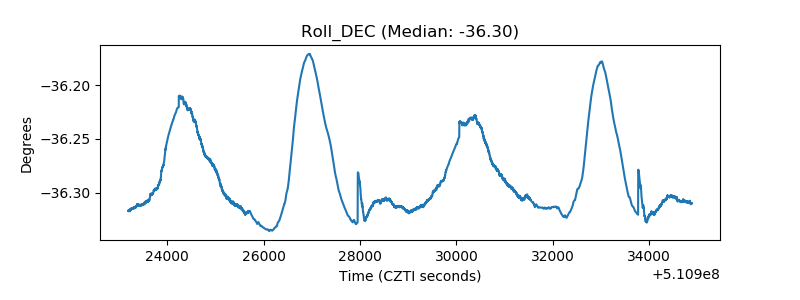 |
| _Roll_RA | 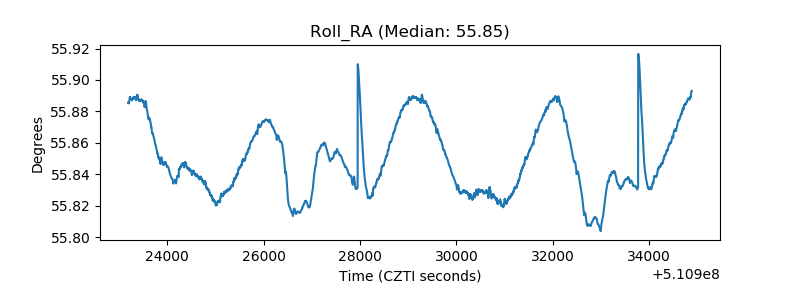 |
| Veto Counter | 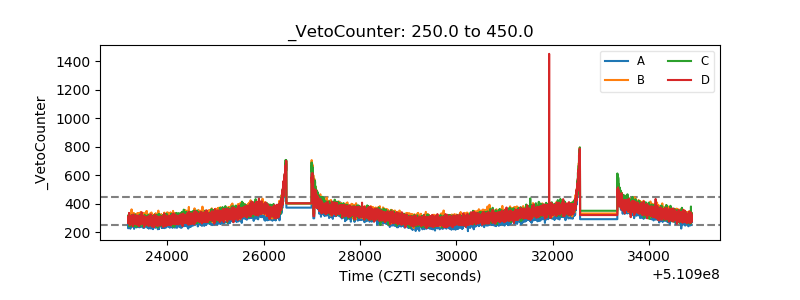 |