| Param | Original file | Final file |
|---|---|---|
| Filename | modeM0/AS1A14_060T01_9000006556_56546cztM0_level2.fits | modeM0/AS1A14_060T01_9000006556_56546cztM0_level2_quad_clean.evt |
| Size (bytes) | 501,618,240 | 94,239,360 |
| Size | 478.4 MB | 89.9 MB |
| Events in quadrant A | 4,054,592 | 623,430 |
| Events in quadrant B | 4,498,374 | 655,887 |
| Events in quadrant C | 4,938,774 | 573,164 |
| Events in quadrant D | 4,563,234 | 540,444 |
| Mode M0 | |||
|---|---|---|---|
| Quadrant | BADHDUFLAG | Total packets | Discarded packets |
| A | 0 | 16654 | 1 |
| B | 0 | 18076 | 1 |
| C | 0 | 19377 | 1 |
| D | 0 | 18337 | 1 |
| Mode M9 | |||
|---|---|---|---|
| Quadrant | BADHDUFLAG | Total packets | Discarded packets |
| A | 0 | 10 | 0 |
| B | 0 | 10 | 0 |
| C | 0 | 10 | 0 |
| D | 0 | 10 | 0 |
| Mode SS | |||
|---|---|---|---|
| Quadrant | BADHDUFLAG | Total packets | Discarded packets |
| A | 0 | 132 | 0 |
| B | 0 | 132 | 0 |
| C | 0 | 132 | 0 |
| D | 0 | 132 | 0 |
| Quadrant | Total seconds | Saturated seconds | Saturation percentage |
|---|---|---|---|
| A | 6606 | 146 | 2.210112% |
| B | 6607 | 311 | 4.707129% |
| C | 6607 | 496 | 7.507189% |
| D | 6607 | 416 | 6.296352% |
Noise dominated data is calculated using 1-second bins in cleaned event files. If a bin has >2000 counts, and if more than 50% of those come from <1% of pixels, then it is considered to be noise-dominated and hence unusable.
| Quadrant | # 1 sec bins | Bins with >0 counts | Bins with >2000 counts | High rate bins dominated by noise | Noise dominated (total time) | Noise dominated (detector-on time) | Marked lightcurve |
|---|---|---|---|---|---|---|---|
| A | 7551 | 6607 | 107 | 107 | 1.42% | 1.62% | 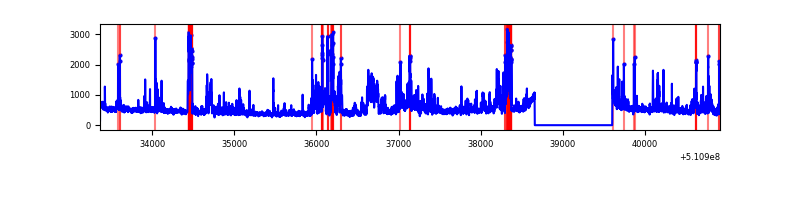 |
| B | 7552 | 6608 | 146 | 146 | 1.93% | 2.21% | 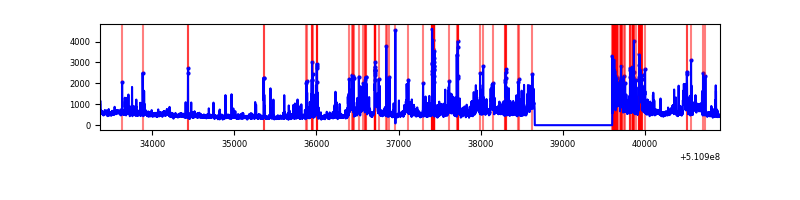 |
| C | 7552 | 6608 | 489 | 489 | 6.48% | 7.40% | 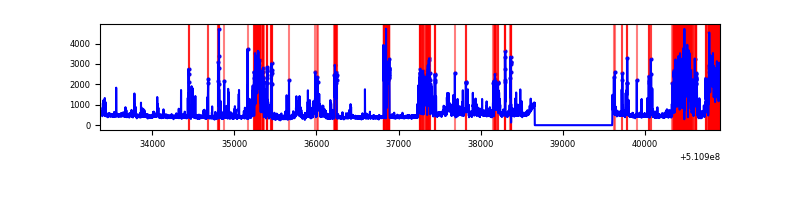 |
| D | 7552 | 6608 | 331 | 331 | 4.38% | 5.01% | 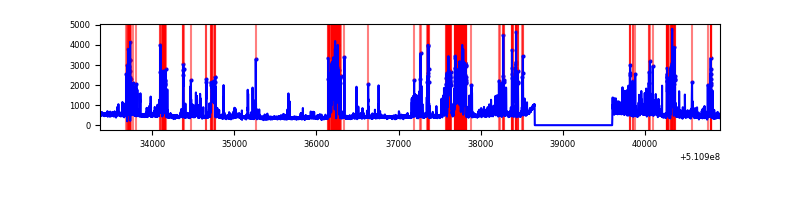 |
Top three noisy pixels from each quadrant. If the there are fewer than three noisy pixels in the level2.evt file, extra rows are filled as -1
| Pixel properties | Quadrant properties | ||||||
|---|---|---|---|---|---|---|---|
| Quadrant | DetID | PixID | Counts | Sigma | Mean | Median | Sigma |
| A | 4 | 95 | 484226 | 2709.81 | 717 | 699 | 178.4 |
| A | 4 | 249 | 276509 | 1545.71 | 717 | 699 | 178.4 |
| A | 0 | 8 | 180649 | 1008.49 | 717 | 699 | 178.4 |
| B | 5 | 185 | 880544 | 5813.14 | 705 | 679 | 151.4 |
| B | 0 | 213 | 181450 | 1194.33 | 705 | 679 | 151.4 |
| B | 4 | 206 | 139345 | 916.15 | 705 | 679 | 151.4 |
| C | 15 | 230 | 1012572 | 5416.35 | 679 | 674 | 186.8 |
| C | 13 | 3 | 788991 | 4219.6 | 679 | 674 | 186.8 |
| C | 12 | 252 | 191792 | 1022.99 | 679 | 674 | 186.8 |
| D | 2 | 31 | 772136 | 3976.82 | 678 | 648 | 194.0 |
| D | 2 | 120 | 423698 | 2180.71 | 678 | 648 | 194.0 |
| D | 2 | 249 | 411168 | 2116.13 | 678 | 648 | 194.0 |
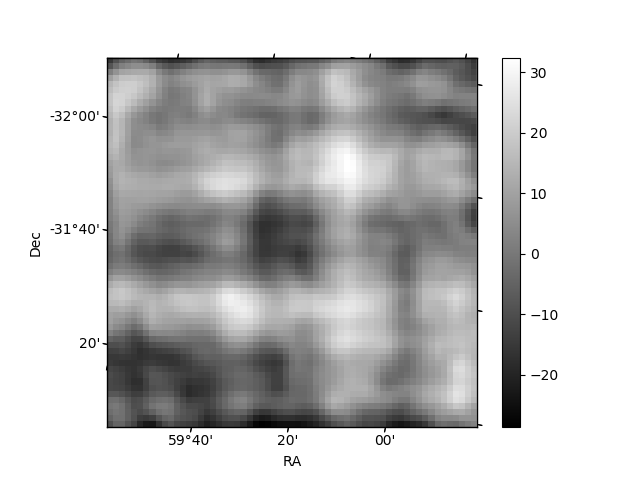
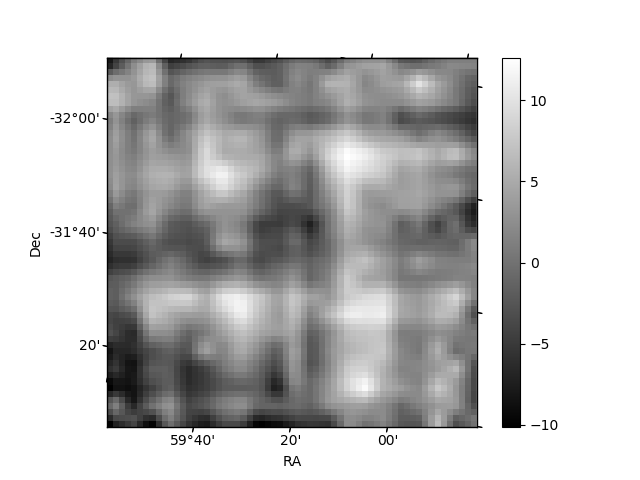
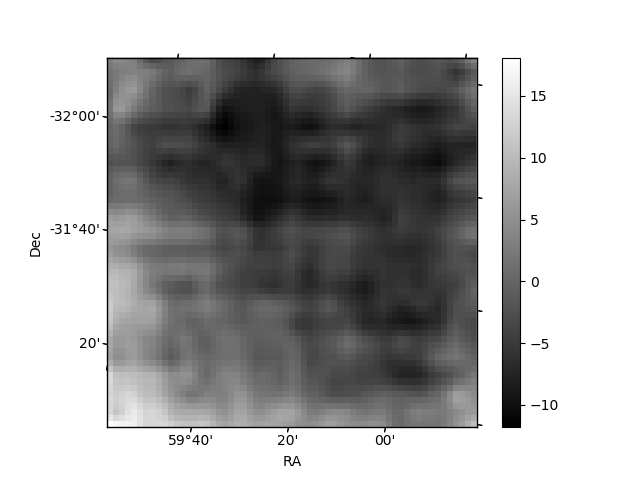
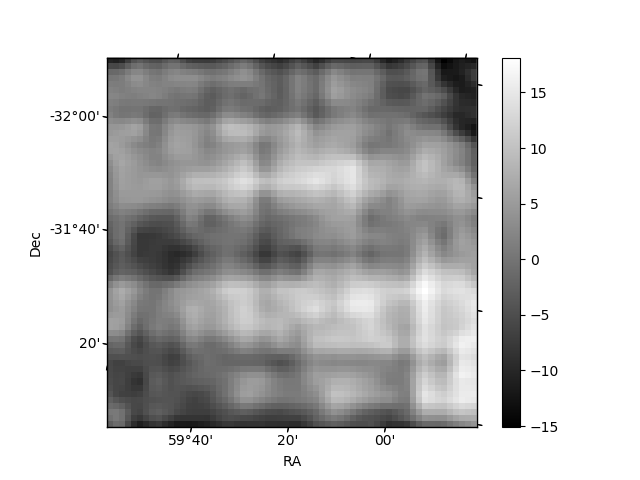
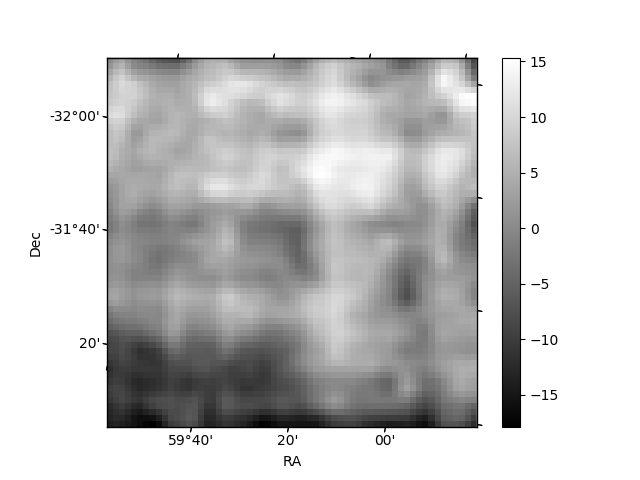
Histogram calculated using DETX and DETY for each event in the final _common_clean file
| Quadrant A | 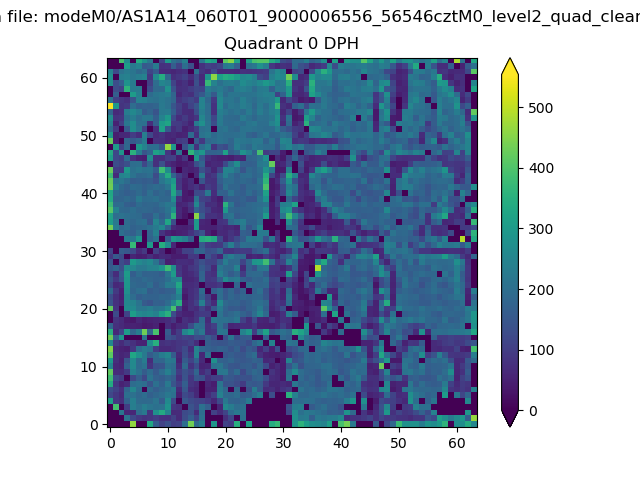 |
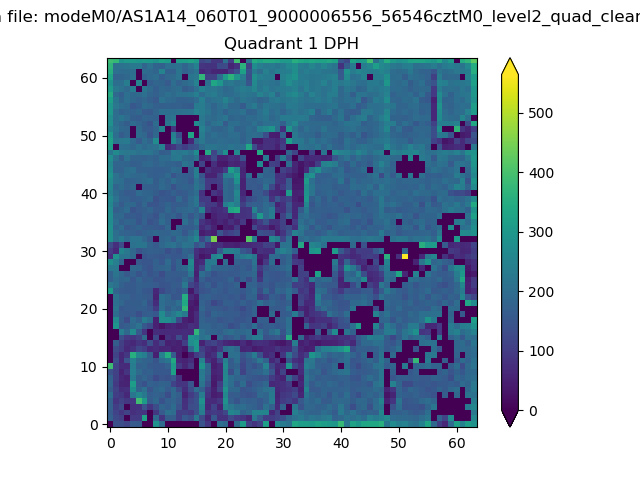 |
Quadrant B |
|---|---|---|---|
| Quadrant D | 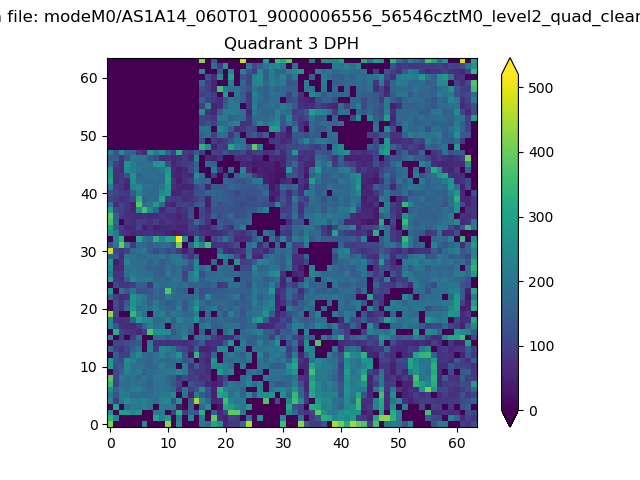 |
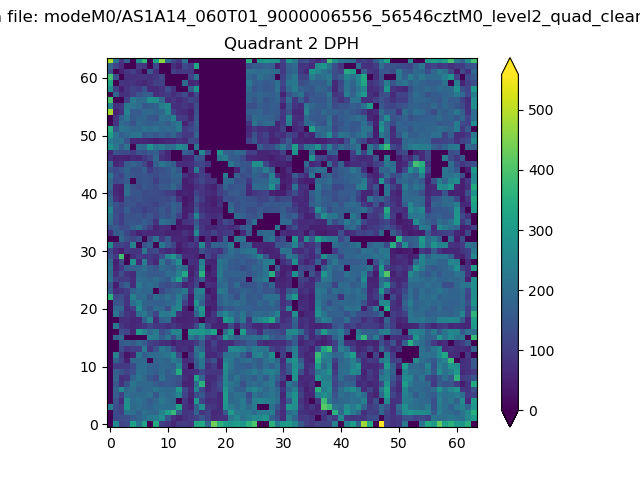 |
Quadrant C |
| Plot type | Count rate plots | Images |
|---|---|---|
| Comparison with Poisson distribution Blue bars denote a histogram of data divided into 1 sec bins. Red curve is a Poisson curve with rate = median count rate of data. |
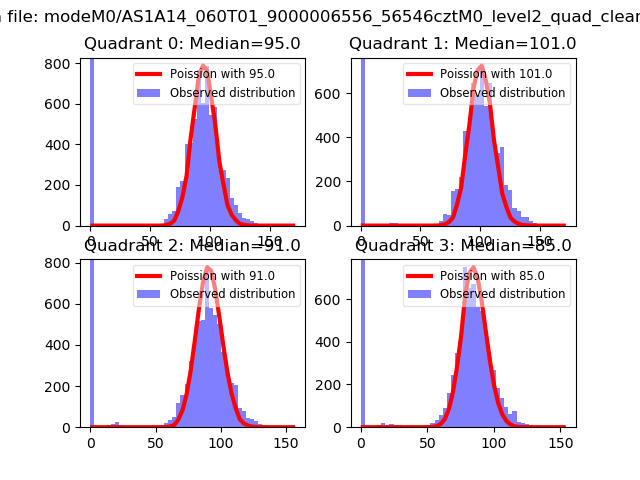 |
 |
| Quadrant-wise count rates Data is divided into 100 sec bins |
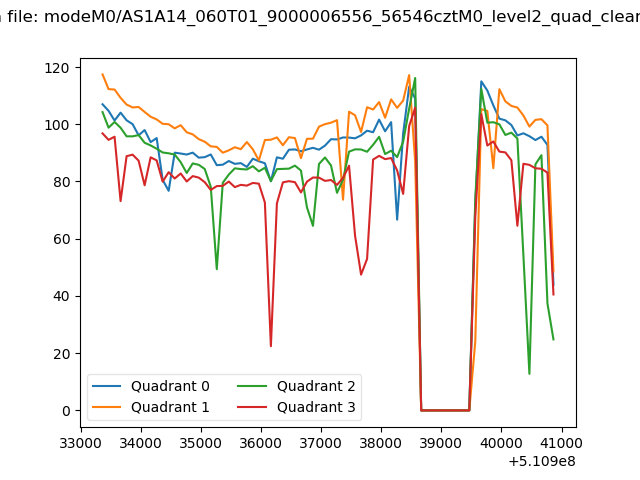 |
|
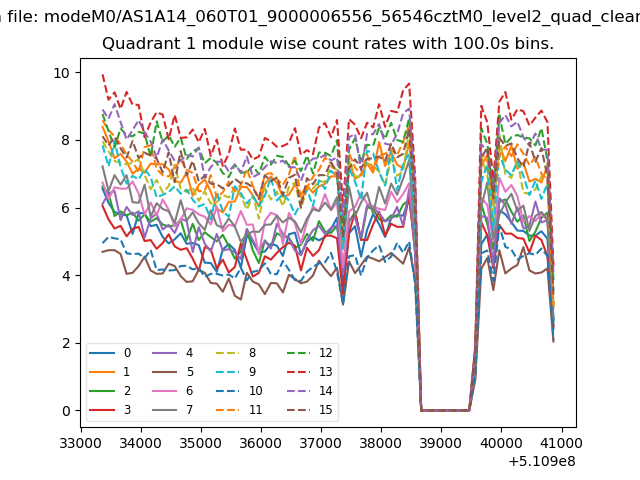
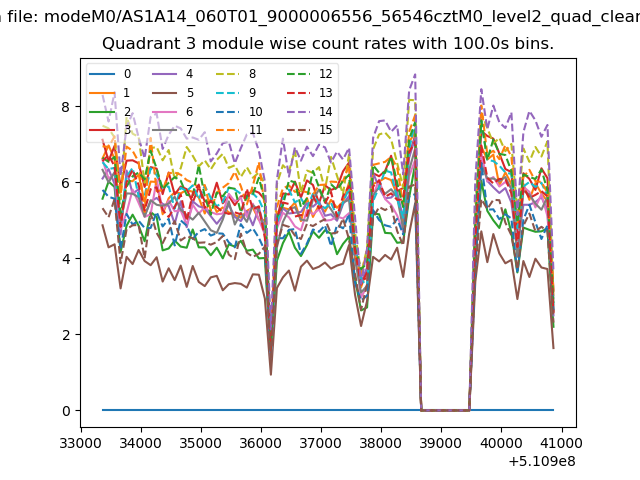
| Module-wise count rates for Quadrant A Data is divided into 100 sec bins |
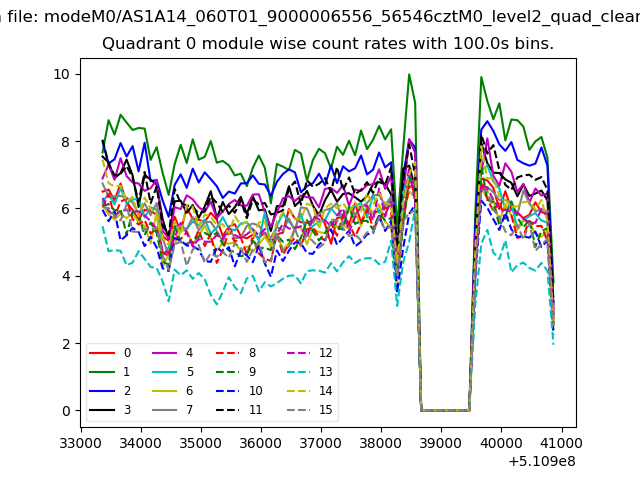 |
 |
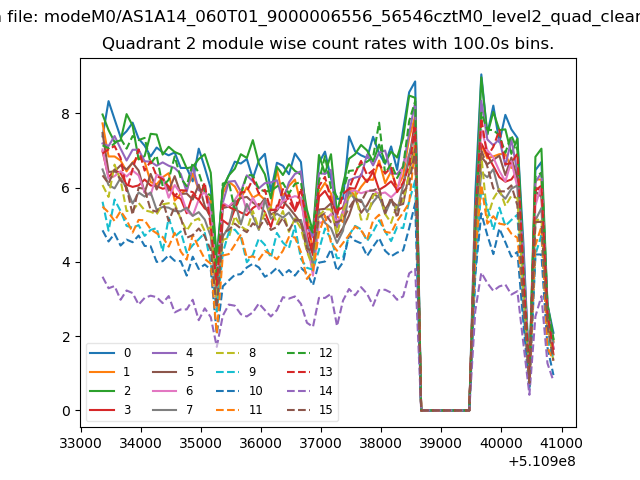
| Module-wise count rates for Quadrant B Data is divided into 100 sec bins |
 |
 |
| Module-wise count rates for Quadrant C Data is divided into 100 sec bins |
 |
 |
| Module-wise count rates for Quadrant D Data is divided into 100 sec bins |
 |
 |
| Parameter | Plot |
|---|---|
| CZT HV Monitor |  |
| D_VDD | 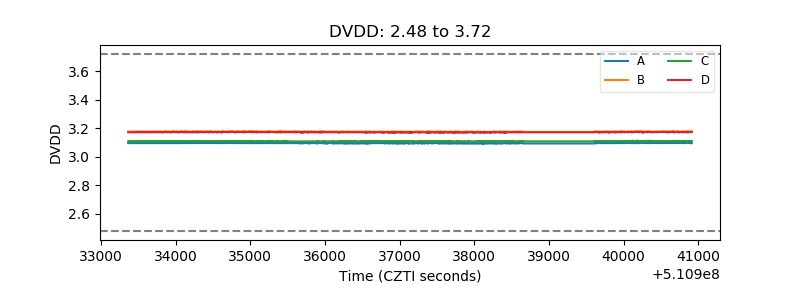 |
| Temperature 1 | 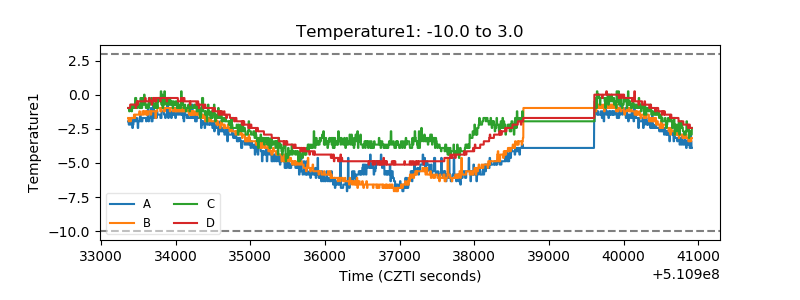 |
| Veto HV Monitor | 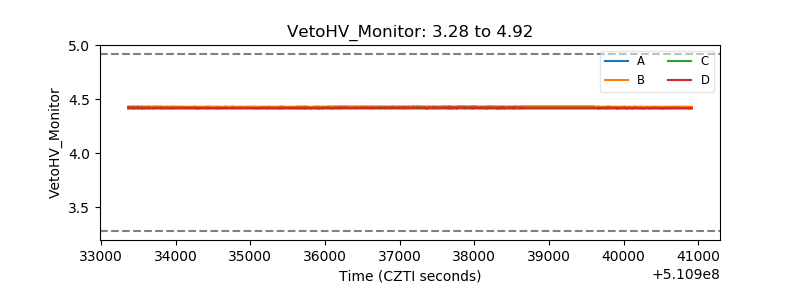 |
| Veto LLD | 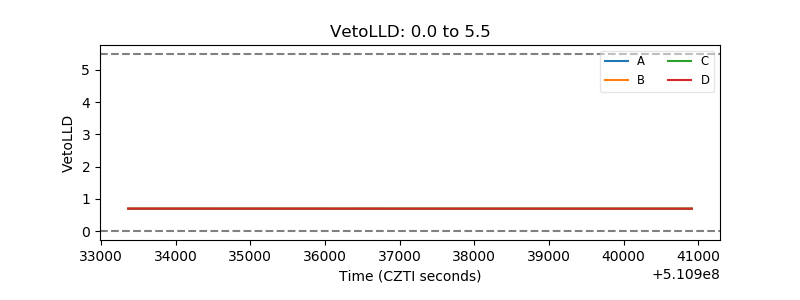 |
| Alpha Counter | 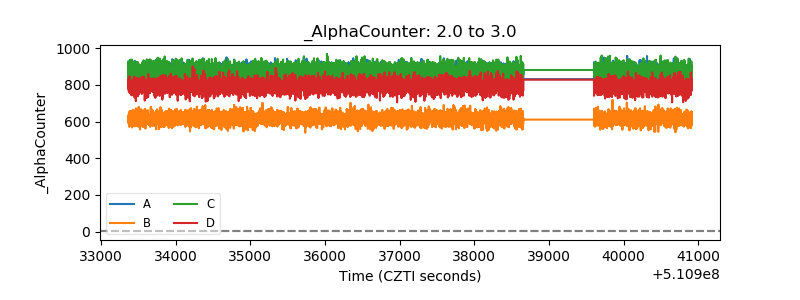 |
| _CPM_Rate | 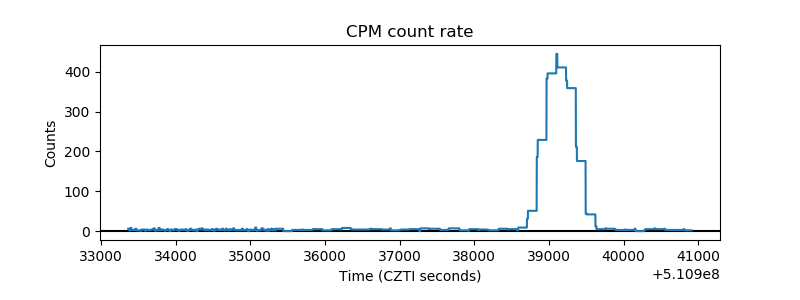 |
| CZT Counter | 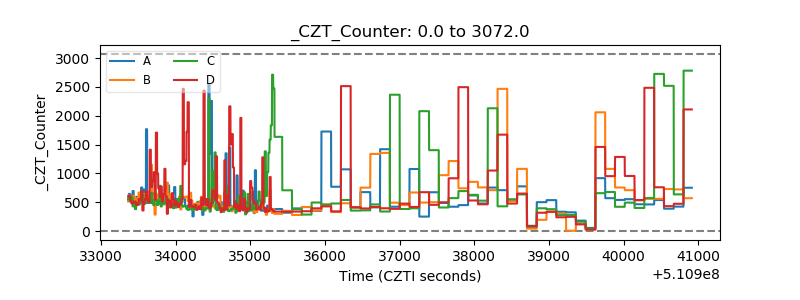 |
| +2.5 Volts monitor | 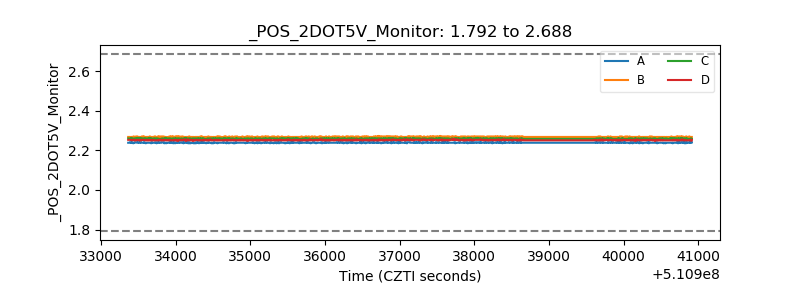 |
| +5 Volts monitor | 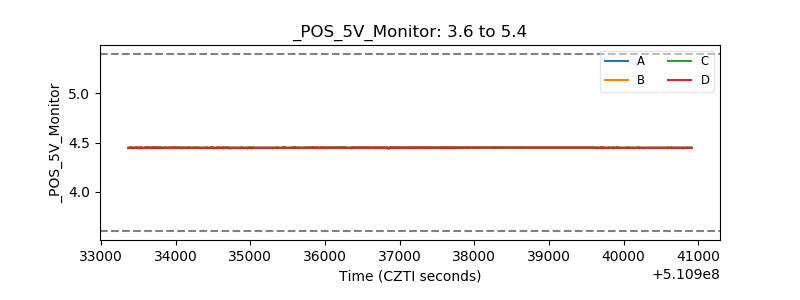 |
| _ROLL_ROT | 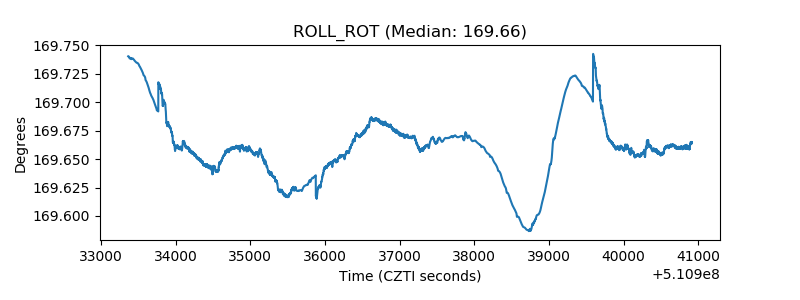 |
| _Roll_DEC | 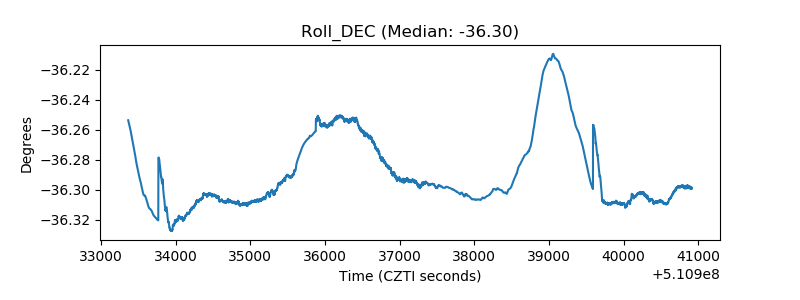 |
| _Roll_RA | 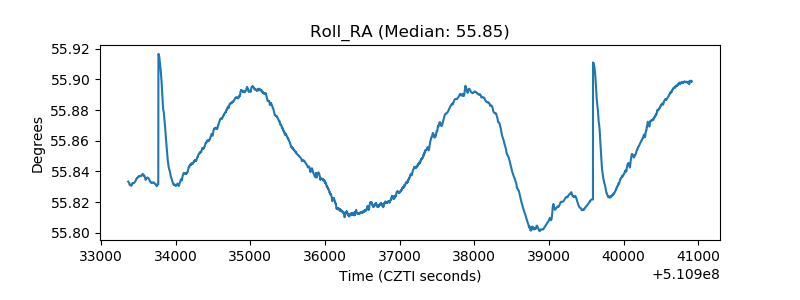 |
| Veto Counter | 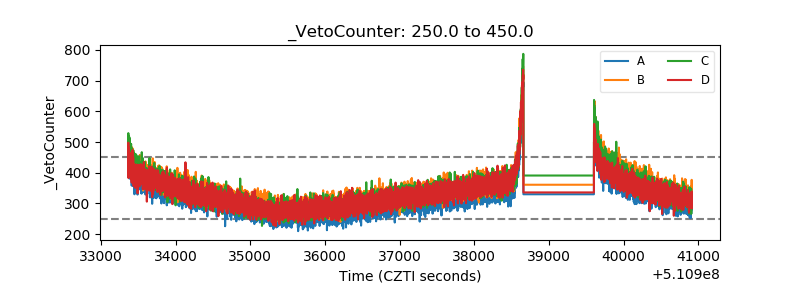 |