| Param | Original file | Final file |
|---|---|---|
| Filename | modeM0/AS1A14_060T01_9000006556_56548cztM0_level2.fits | modeM0/AS1A14_060T01_9000006556_56548cztM0_level2_quad_clean.evt |
| Size (bytes) | 438,428,160 | 92,730,240 |
| Size | 418.1 MB | 88.4 MB |
| Events in quadrant A | 3,332,497 | 616,103 |
| Events in quadrant B | 3,766,314 | 651,350 |
| Events in quadrant C | 5,084,083 | 547,936 |
| Events in quadrant D | 3,548,698 | 546,048 |
| Mode M0 | |||
|---|---|---|---|
| Quadrant | BADHDUFLAG | Total packets | Discarded packets |
| A | 0 | 14329 | 1 |
| B | 0 | 15700 | 1 |
| C | 0 | 19677 | 1 |
| D | 0 | 15069 | 1 |
| Mode M9 | |||
|---|---|---|---|
| Quadrant | BADHDUFLAG | Total packets | Discarded packets |
| A | 0 | 10 | 0 |
| B | 0 | 10 | 0 |
| C | 0 | 10 | 0 |
| D | 0 | 10 | 0 |
| Mode SS | |||
|---|---|---|---|
| Quadrant | BADHDUFLAG | Total packets | Discarded packets |
| A | 0 | 130 | 0 |
| B | 0 | 130 | 0 |
| C | 0 | 130 | 0 |
| D | 0 | 130 | 0 |
| Quadrant | Total seconds | Saturated seconds | Saturation percentage |
|---|---|---|---|
| A | 6397 | 41 | 0.640925% |
| B | 6397 | 190 | 2.970142% |
| C | 6397 | 578 | 9.035485% |
| D | 6396 | 121 | 1.891807% |
Noise dominated data is calculated using 1-second bins in cleaned event files. If a bin has >2000 counts, and if more than 50% of those come from <1% of pixels, then it is considered to be noise-dominated and hence unusable.
| Quadrant | # 1 sec bins | Bins with >0 counts | Bins with >2000 counts | High rate bins dominated by noise | Noise dominated (total time) | Noise dominated (detector-on time) | Marked lightcurve |
|---|---|---|---|---|---|---|---|
| A | 7473 | 6399 | 27 | 27 | 0.36% | 0.42% | 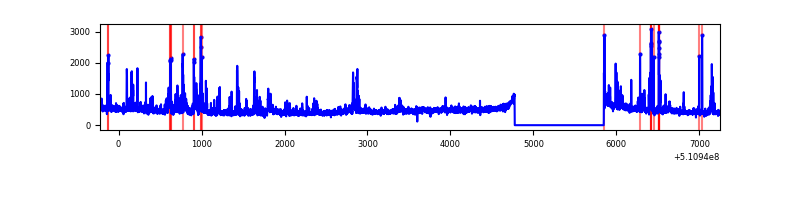 |
| B | 7473 | 6399 | 70 | 70 | 0.94% | 1.09% | 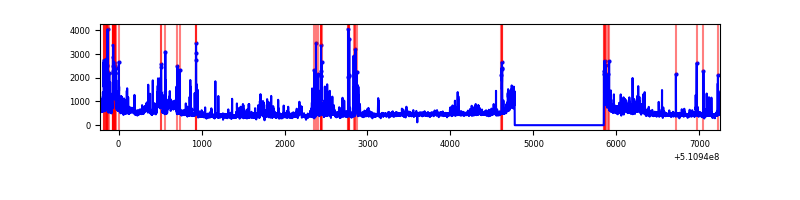 |
| C | 7473 | 6399 | 616 | 616 | 8.24% | 9.63% | 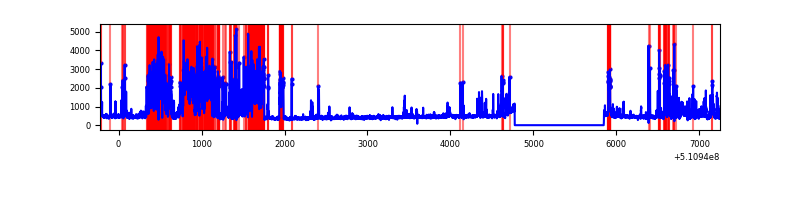 |
| D | 7472 | 6398 | 92 | 92 | 1.23% | 1.44% | 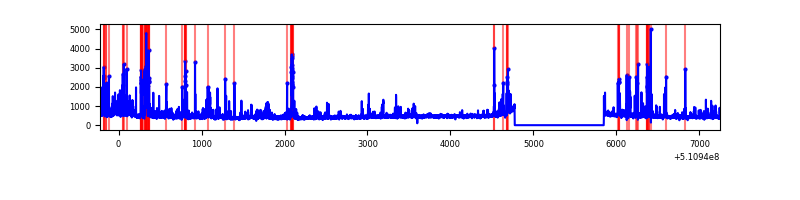 |
Top three noisy pixels from each quadrant. If the there are fewer than three noisy pixels in the level2.evt file, extra rows are filled as -1
| Pixel properties | Quadrant properties | ||||||
|---|---|---|---|---|---|---|---|
| Quadrant | DetID | PixID | Counts | Sigma | Mean | Median | Sigma |
| A | 4 | 95 | 110944 | 636.61 | 694 | 677 | 173.2 |
| A | 3 | 22 | 101387 | 581.44 | 694 | 677 | 173.2 |
| A | 10 | 251 | 79724 | 456.37 | 694 | 677 | 173.2 |
| B | 4 | 206 | 241528 | 1669.16 | 684 | 663 | 144.3 |
| B | 5 | 185 | 182836 | 1262.43 | 684 | 663 | 144.3 |
| B | 0 | 183 | 149424 | 1030.89 | 684 | 663 | 144.3 |
| C | 13 | 3 | 1249411 | 6945.11 | 649 | 642 | 179.8 |
| C | 15 | 230 | 796392 | 4425.62 | 649 | 642 | 179.8 |
| C | 12 | 250 | 239994 | 1331.17 | 649 | 642 | 179.8 |
| D | 2 | 120 | 238550 | 1263.01 | 661 | 633 | 188.4 |
| D | 2 | 249 | 152467 | 806.03 | 661 | 633 | 188.4 |
| D | 3 | 12 | 141099 | 745.68 | 661 | 633 | 188.4 |
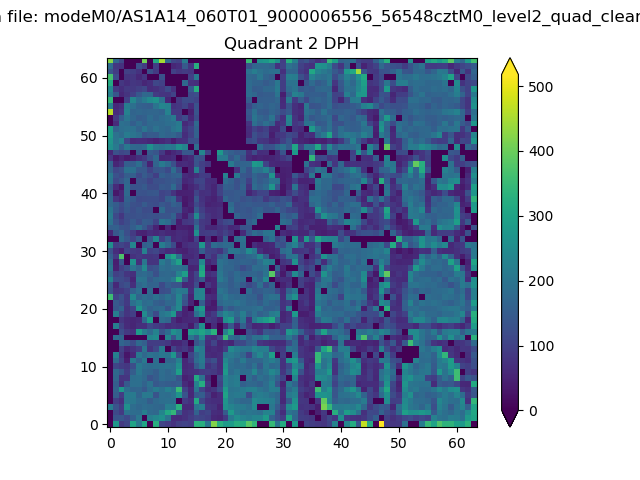
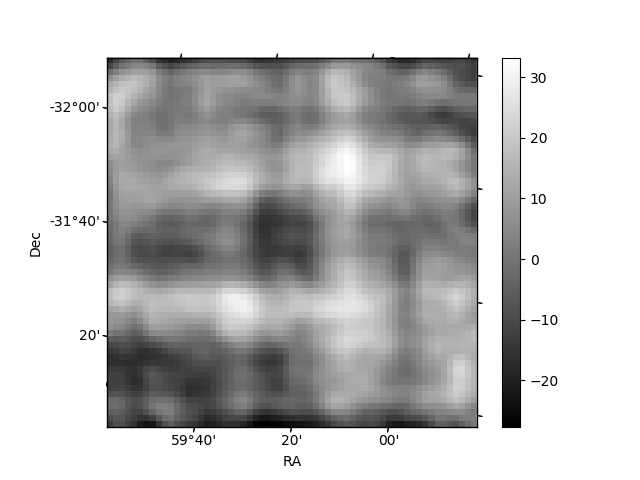
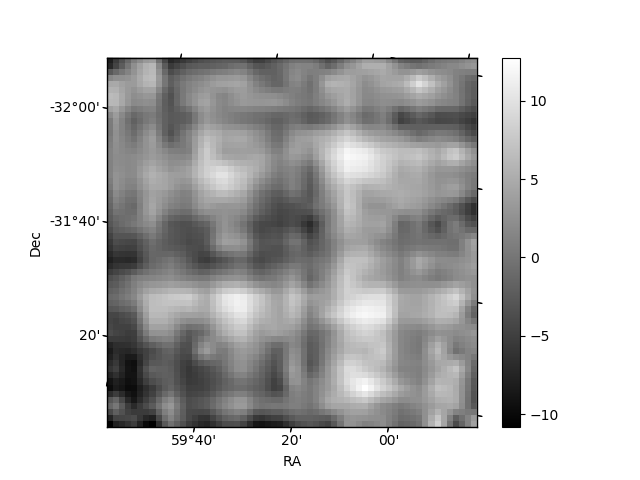
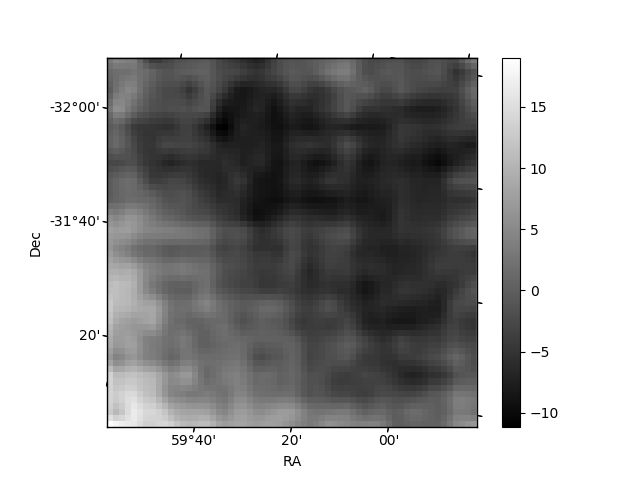
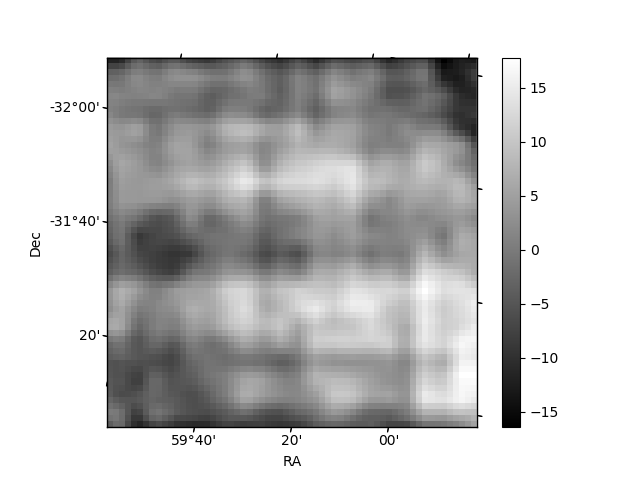
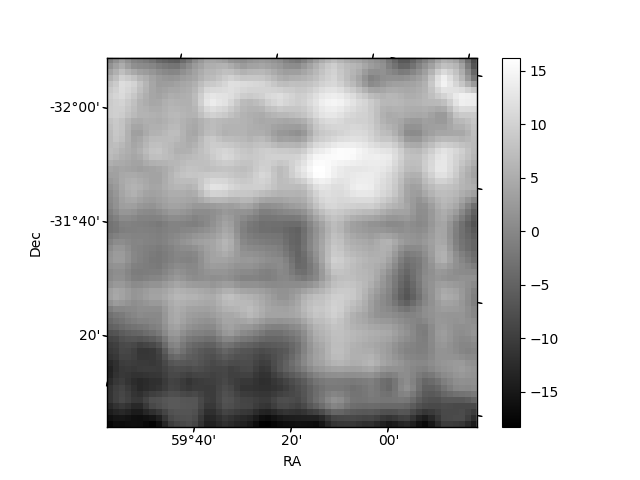
Histogram calculated using DETX and DETY for each event in the final _common_clean file
| Quadrant A | 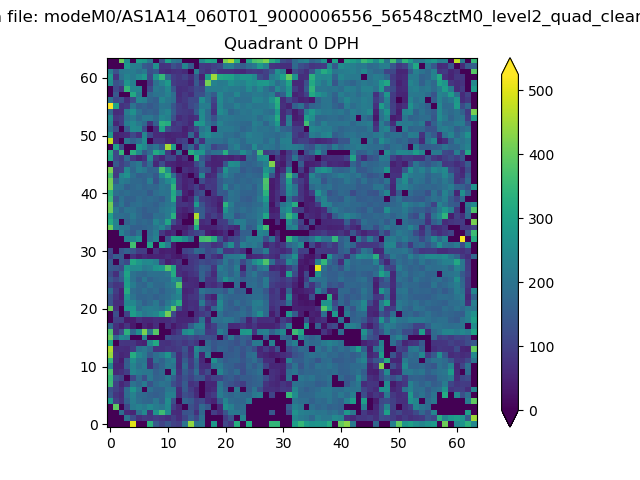 |
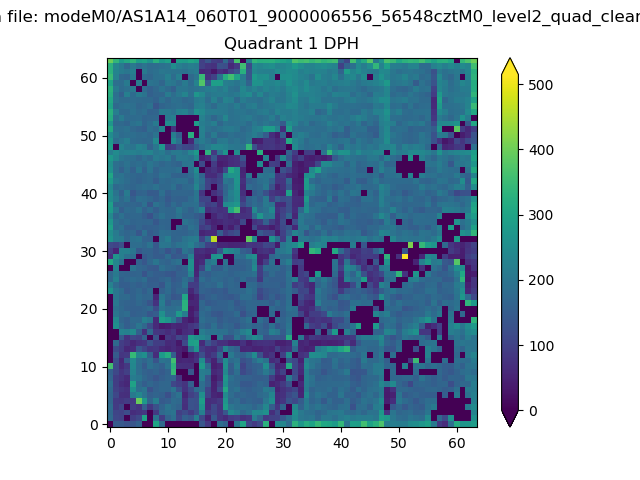 |
Quadrant B |
|---|---|---|---|
| Quadrant D | 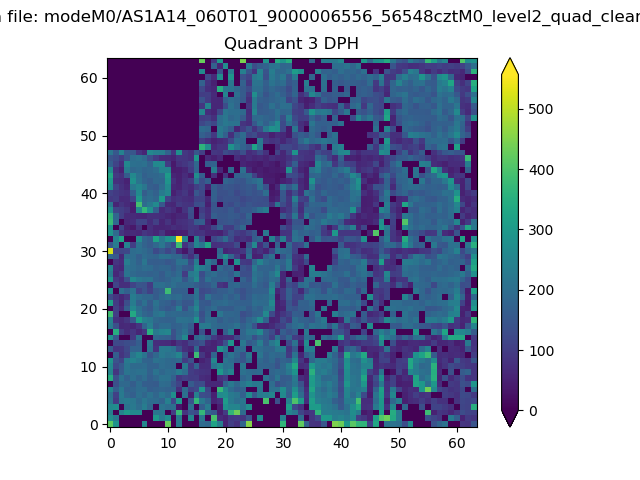 |
 |
Quadrant C |
| Plot type | Count rate plots | Images |
|---|---|---|
| Comparison with Poisson distribution Blue bars denote a histogram of data divided into 1 sec bins. Red curve is a Poisson curve with rate = median count rate of data. |
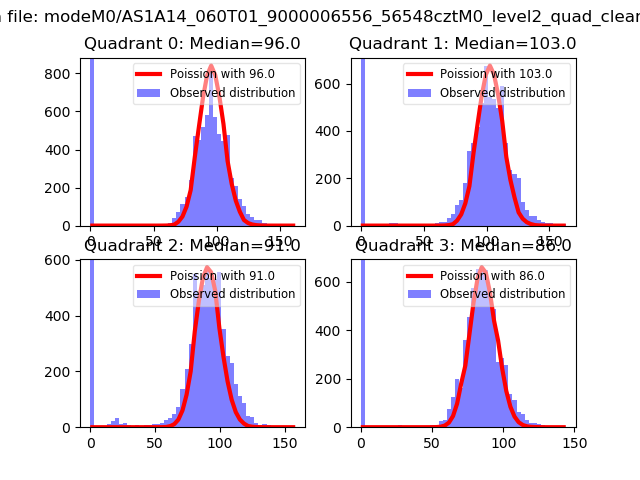 |
 |
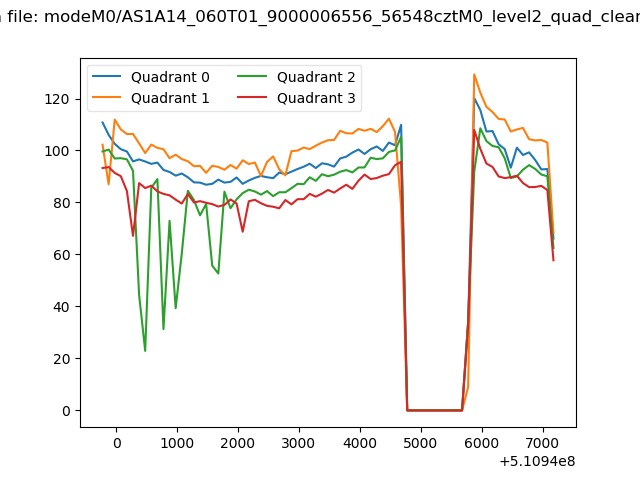
| Quadrant-wise count rates Data is divided into 100 sec bins |
 |
|
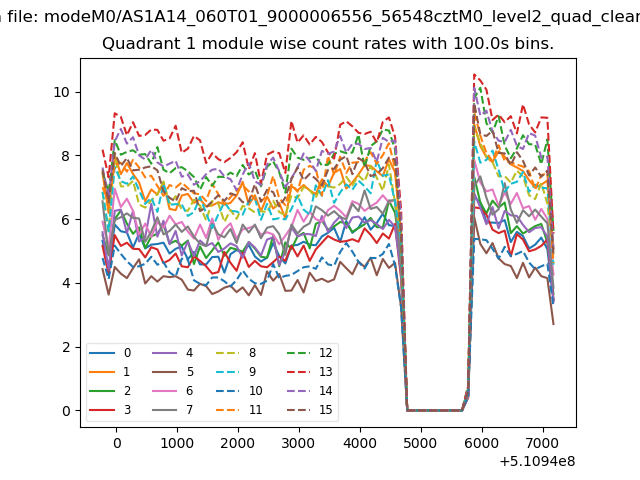
| Module-wise count rates for Quadrant A Data is divided into 100 sec bins |
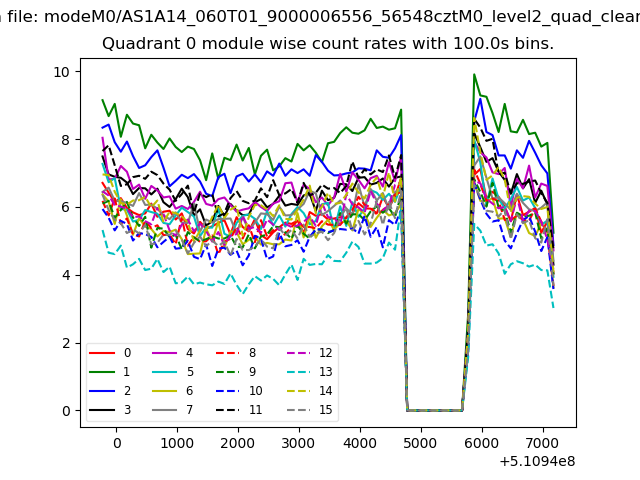 |
 |
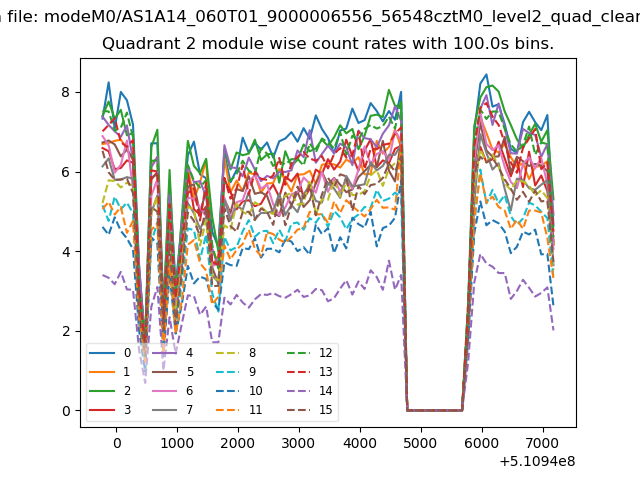
| Module-wise count rates for Quadrant B Data is divided into 100 sec bins |
 |
 |
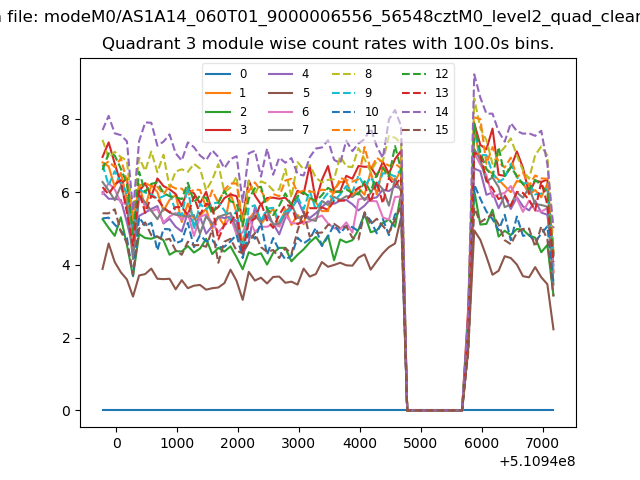
| Module-wise count rates for Quadrant C Data is divided into 100 sec bins |
 |
 |
| Module-wise count rates for Quadrant D Data is divided into 100 sec bins |
 |
 |
| Parameter | Plot |
|---|---|
| CZT HV Monitor | 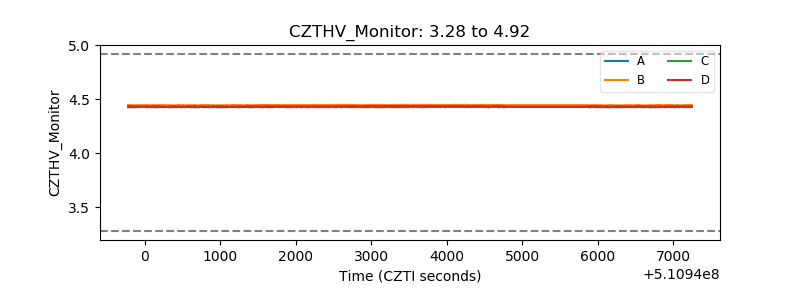 |
| D_VDD | 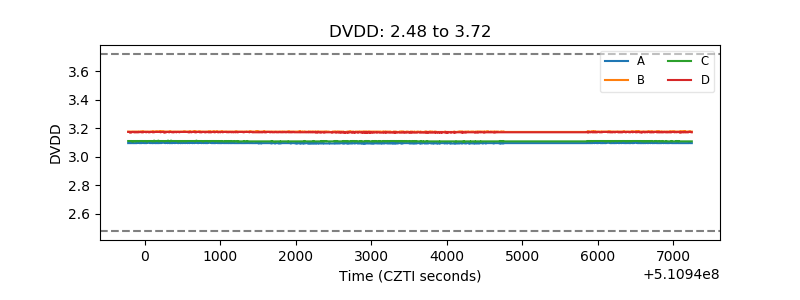 |
| Temperature 1 | 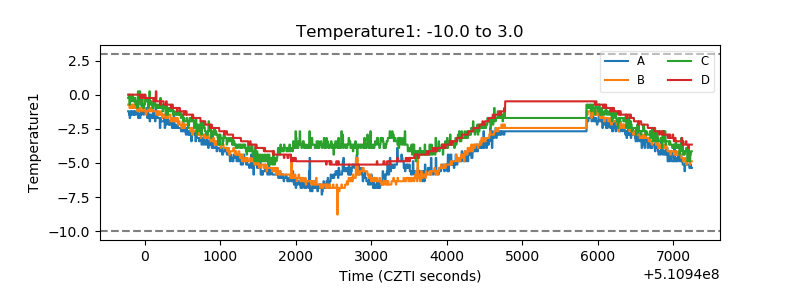 |
| Veto HV Monitor | 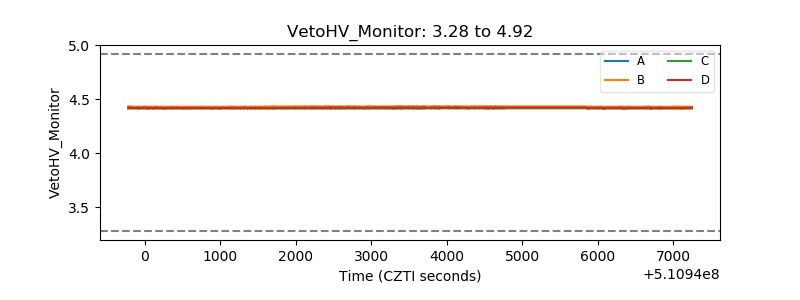 |
| Veto LLD | 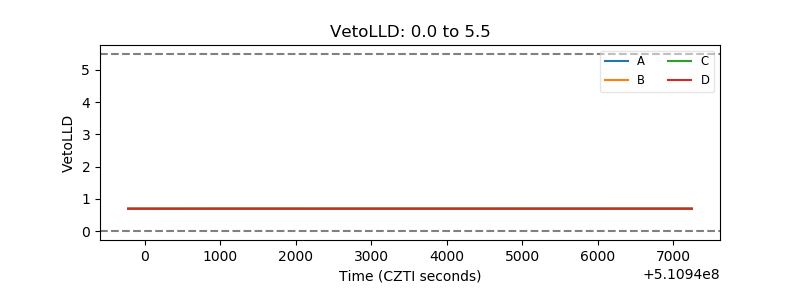 |
| Alpha Counter | 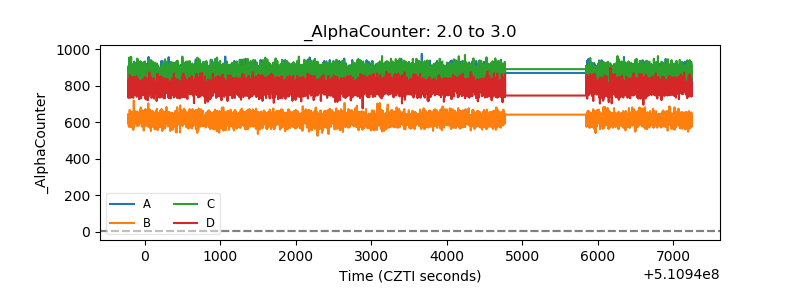 |
| _CPM_Rate | 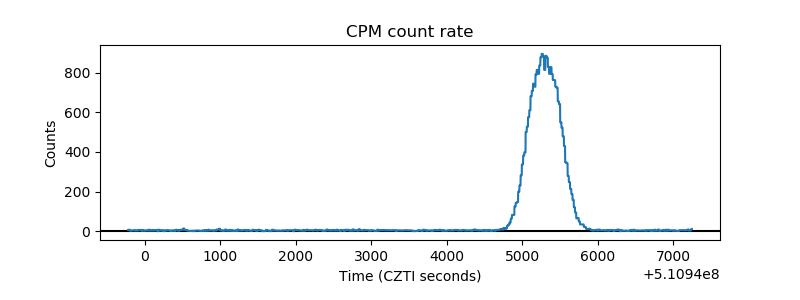 |
| CZT Counter | 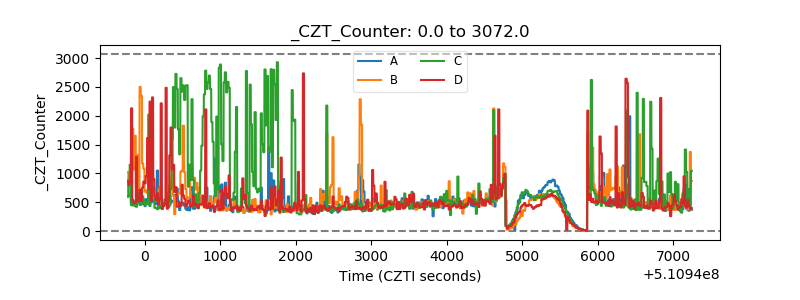 |
| +2.5 Volts monitor | 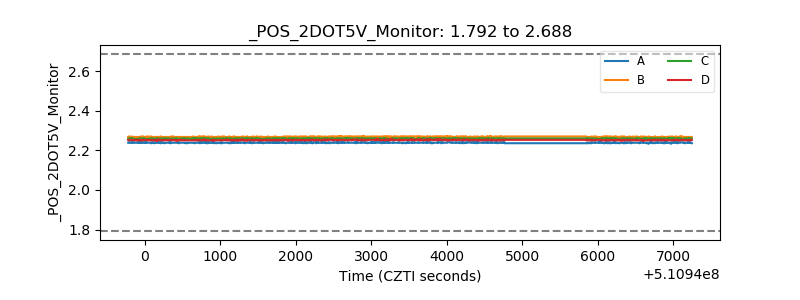 |
| +5 Volts monitor | 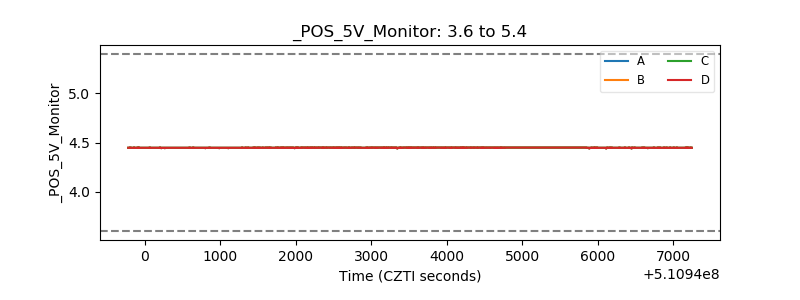 |
| _ROLL_ROT | 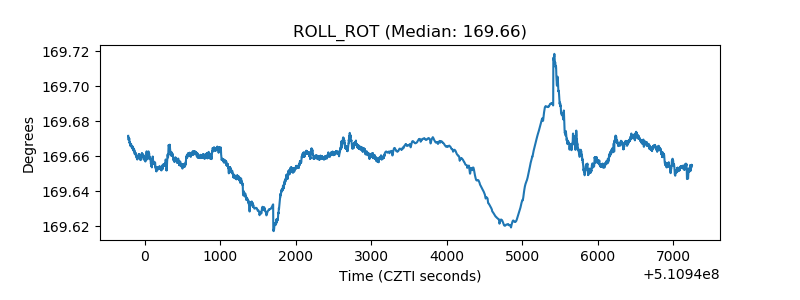 |
| _Roll_DEC | 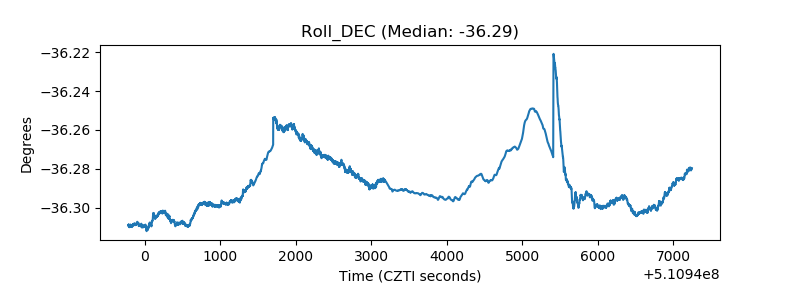 |
| _Roll_RA | 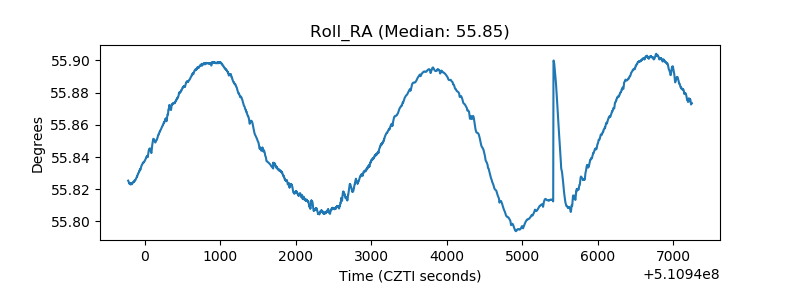 |
| Veto Counter | 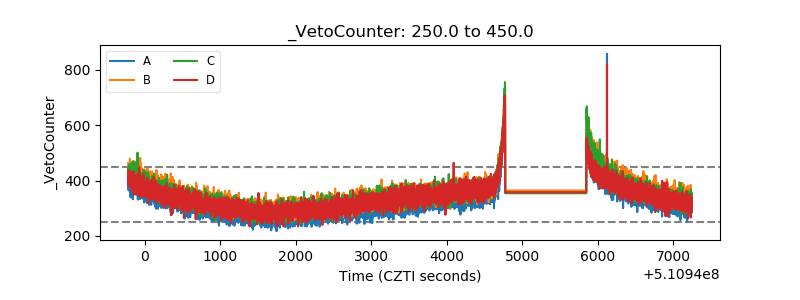 |