| Param | Original file | Final file |
|---|---|---|
| Filename | modeM0/AS1A14_060T01_9000006556_56550cztM0_level2.fits | modeM0/AS1A14_060T01_9000006556_56550cztM0_level2_quad_clean.evt |
| Size (bytes) | 394,660,800 | 95,163,840 |
| Size | 376.4 MB | 90.8 MB |
| Events in quadrant A | 3,257,503 | 625,995 |
| Events in quadrant B | 3,964,555 | 664,922 |
| Events in quadrant C | 3,347,975 | 600,914 |
| Events in quadrant D | 3,551,031 | 552,036 |
| Mode M0 | |||
|---|---|---|---|
| Quadrant | BADHDUFLAG | Total packets | Discarded packets |
| A | 0 | 14081 | 2 |
| B | 0 | 16009 | 2 |
| C | 0 | 14390 | 2 |
| D | 0 | 14877 | 2 |
| Mode M9 | |||
|---|---|---|---|
| Quadrant | BADHDUFLAG | Total packets | Discarded packets |
| A | 0 | 12 | 0 |
| B | 0 | 12 | 0 |
| C | 0 | 12 | 0 |
| D | 0 | 12 | 0 |
| Mode SS | |||
|---|---|---|---|
| Quadrant | BADHDUFLAG | Total packets | Discarded packets |
| A | 0 | 128 | 0 |
| B | 0 | 128 | 0 |
| C | 0 | 128 | 0 |
| D | 0 | 128 | 0 |
| Quadrant | Total seconds | Saturated seconds | Saturation percentage |
|---|---|---|---|
| A | 6270 | 78 | 1.244019% |
| B | 6271 | 301 | 4.799872% |
| C | 6271 | 104 | 1.658428% |
| D | 6270 | 153 | 2.440191% |
Noise dominated data is calculated using 1-second bins in cleaned event files. If a bin has >2000 counts, and if more than 50% of those come from <1% of pixels, then it is considered to be noise-dominated and hence unusable.
| Quadrant | # 1 sec bins | Bins with >0 counts | Bins with >2000 counts | High rate bins dominated by noise | Noise dominated (total time) | Noise dominated (detector-on time) | Marked lightcurve |
|---|---|---|---|---|---|---|---|
| A | 7470 | 6271 | 69 | 69 | 0.92% | 1.10% | 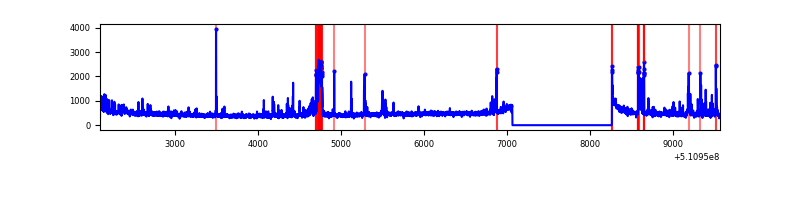 |
| B | 7471 | 6272 | 121 | 121 | 1.62% | 1.93% | 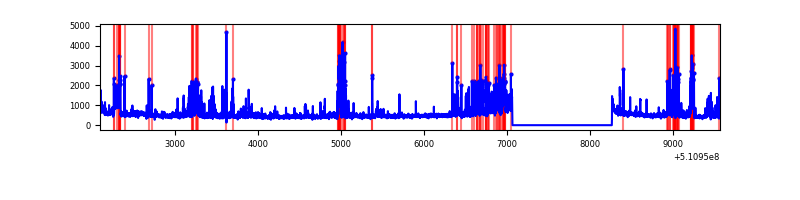 |
| C | 7471 | 6272 | 83 | 83 | 1.11% | 1.32% |  |
| D | 7470 | 6271 | 134 | 134 | 1.79% | 2.14% | 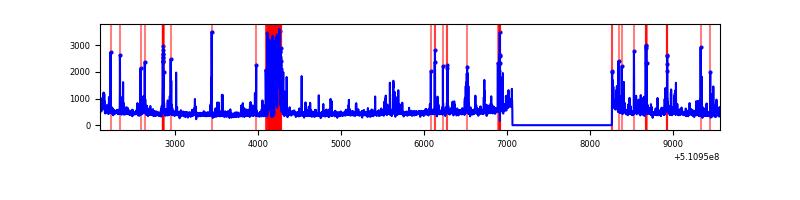 |
Top three noisy pixels from each quadrant. If the there are fewer than three noisy pixels in the level2.evt file, extra rows are filled as -1
| Pixel properties | Quadrant properties | ||||||
|---|---|---|---|---|---|---|---|
| Quadrant | DetID | PixID | Counts | Sigma | Mean | Median | Sigma |
| A | 4 | 95 | 276215 | 1586.8 | 699 | 680 | 173.6 |
| A | 11 | 31 | 85573 | 488.9 | 699 | 680 | 173.6 |
| A | 4 | 249 | 41722 | 236.36 | 699 | 680 | 173.6 |
| B | 4 | 206 | 639513 | 4320.9 | 691 | 668 | 147.8 |
| B | 5 | 185 | 145085 | 976.78 | 691 | 668 | 147.8 |
| B | 10 | 247 | 82368 | 552.59 | 691 | 668 | 147.8 |
| C | 13 | 3 | 328861 | 1749.25 | 679 | 673 | 187.6 |
| C | 9 | 38 | 147376 | 781.93 | 679 | 673 | 187.6 |
| C | 14 | 254 | 105539 | 558.94 | 679 | 673 | 187.6 |
| D | 2 | 120 | 360851 | 1900.34 | 664 | 635 | 189.6 |
| D | 11 | 129 | 99866 | 523.5 | 664 | 635 | 189.6 |
| D | 2 | 249 | 77435 | 405.16 | 664 | 635 | 189.6 |
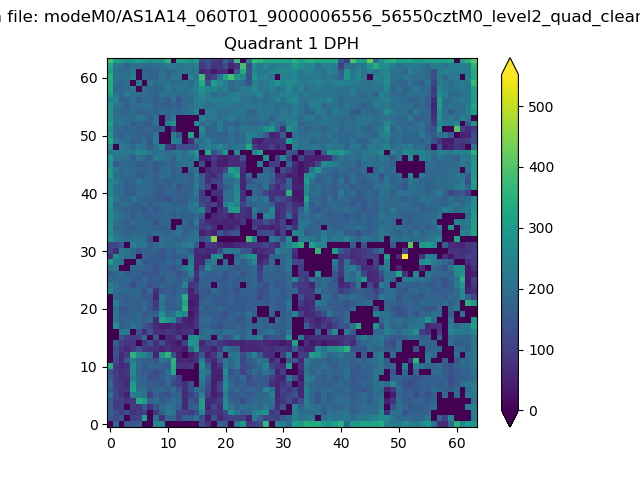
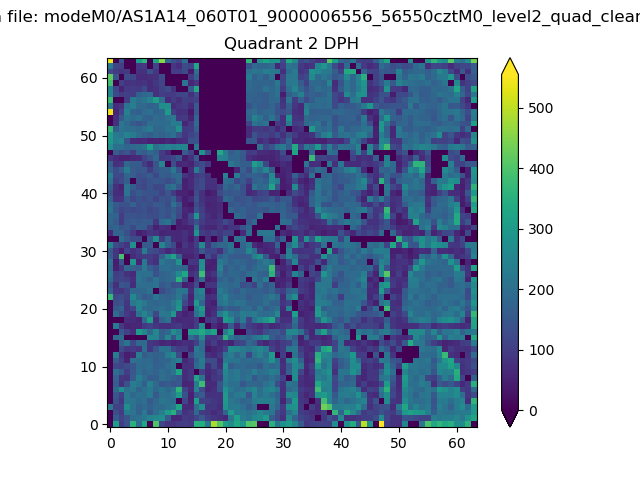
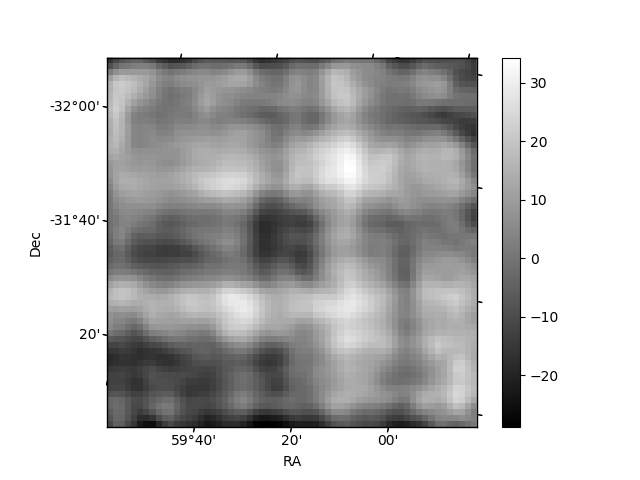
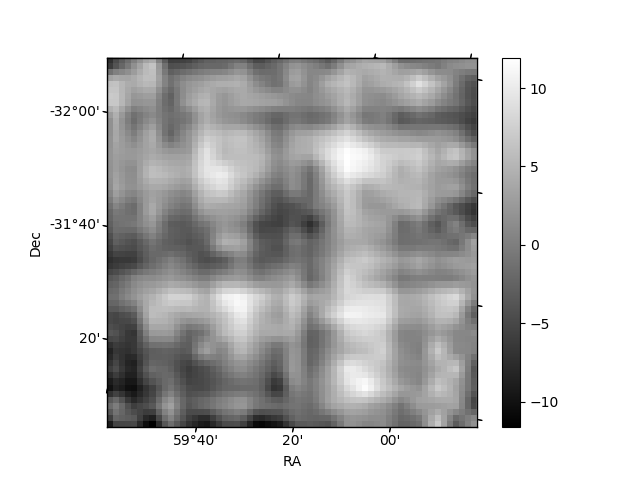
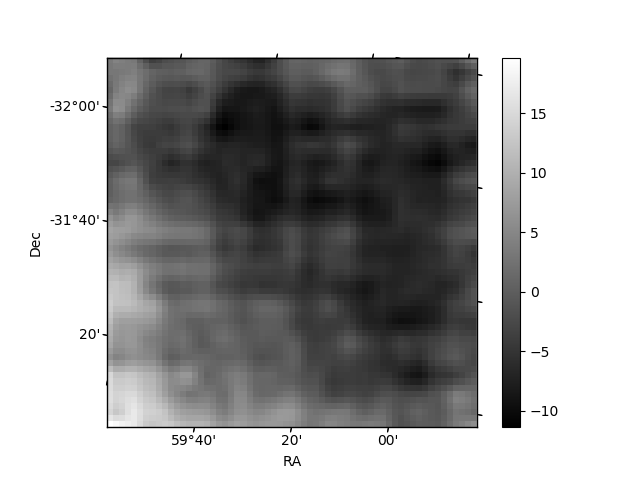
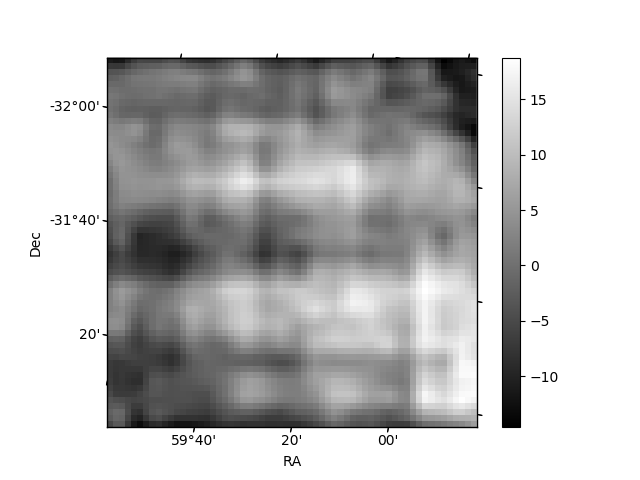
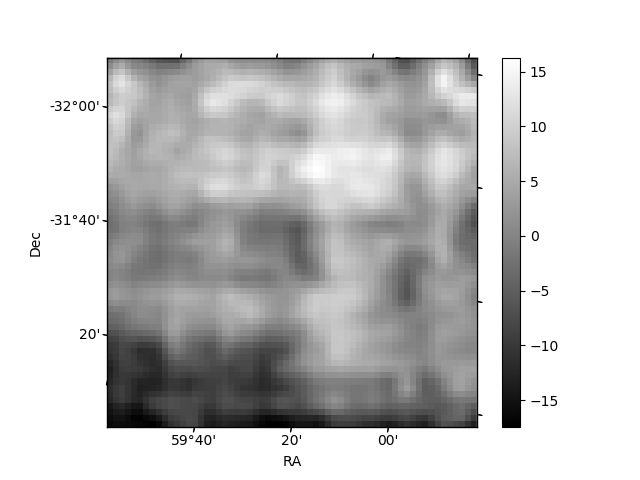
Histogram calculated using DETX and DETY for each event in the final _common_clean file
| Quadrant A | 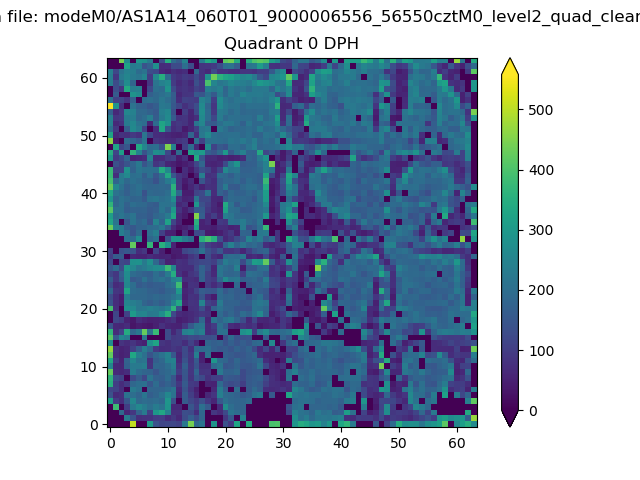 |
 |
Quadrant B |
|---|---|---|---|
| Quadrant D | 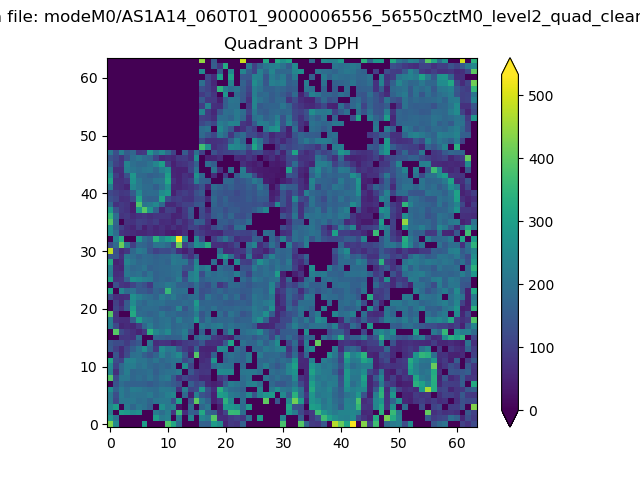 |
 |
Quadrant C |
| Plot type | Count rate plots | Images |
|---|---|---|
| Comparison with Poisson distribution Blue bars denote a histogram of data divided into 1 sec bins. Red curve is a Poisson curve with rate = median count rate of data. |
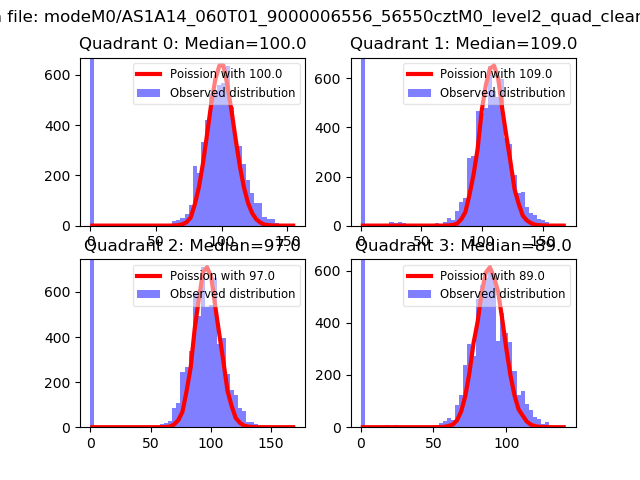 |
 |
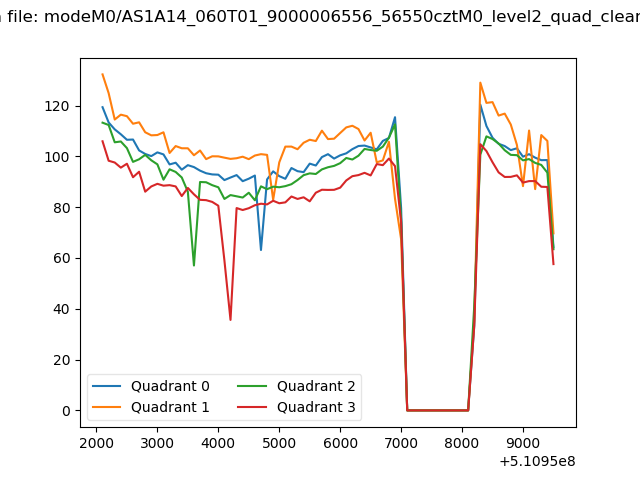
| Quadrant-wise count rates Data is divided into 100 sec bins |
 |
|
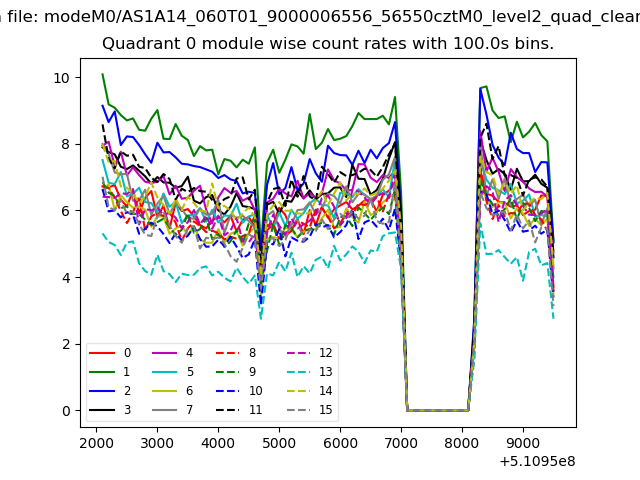
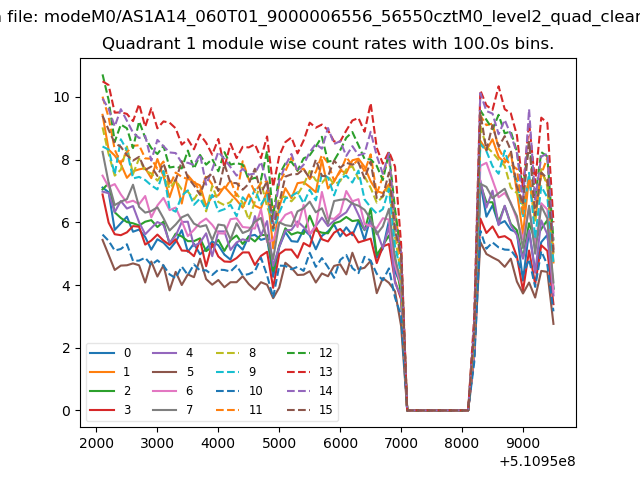
| Module-wise count rates for Quadrant A Data is divided into 100 sec bins |
 |
 |
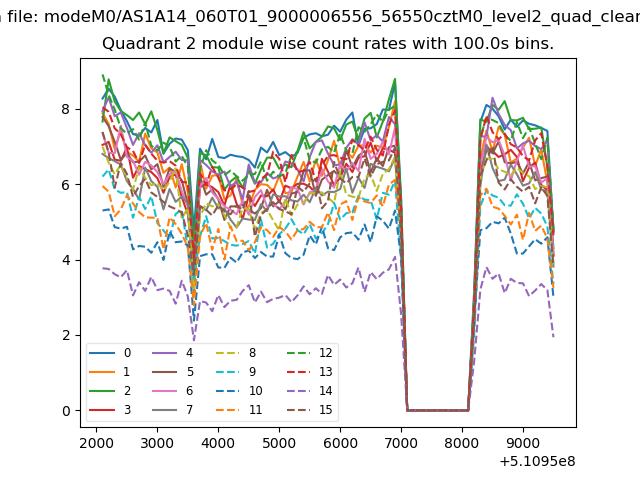
| Module-wise count rates for Quadrant B Data is divided into 100 sec bins |
 |
 |
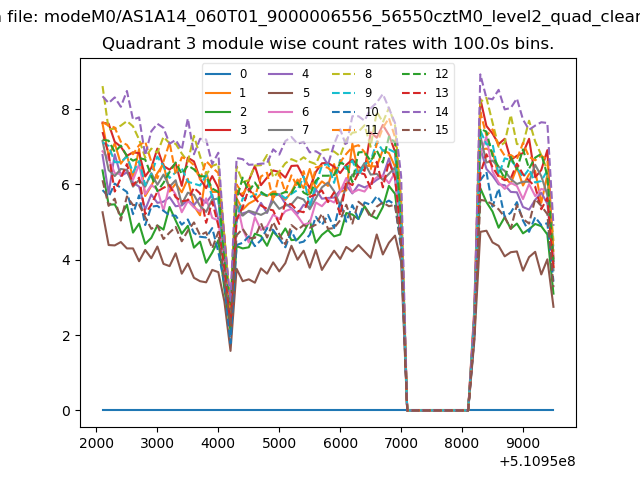
| Module-wise count rates for Quadrant C Data is divided into 100 sec bins |
 |
 |
| Module-wise count rates for Quadrant D Data is divided into 100 sec bins |
 |
 |
| Parameter | Plot |
|---|---|
| CZT HV Monitor | 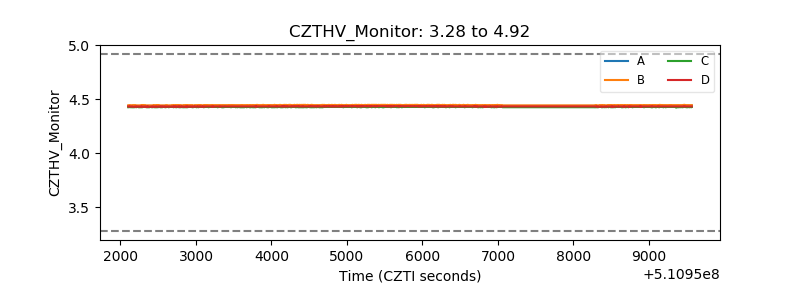 |
| D_VDD | 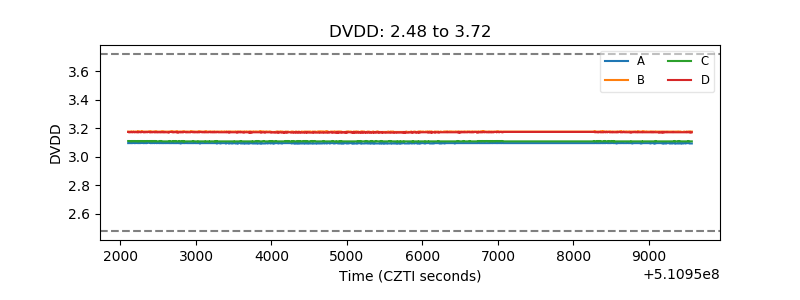 |
| Temperature 1 | 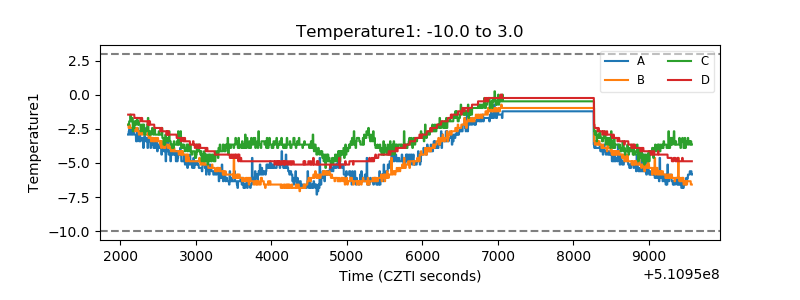 |
| Veto HV Monitor | 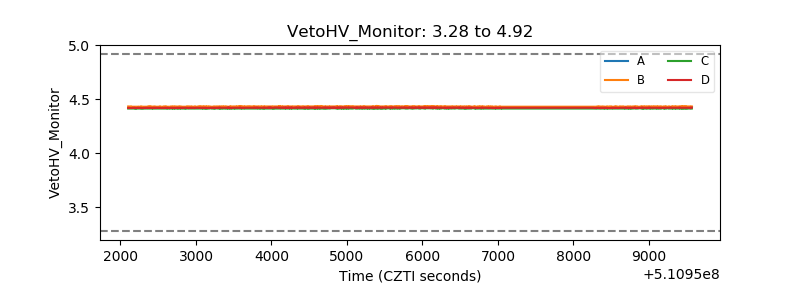 |
| Veto LLD | 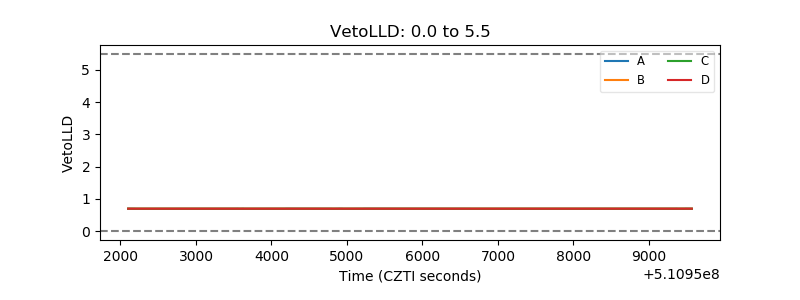 |
| Alpha Counter | 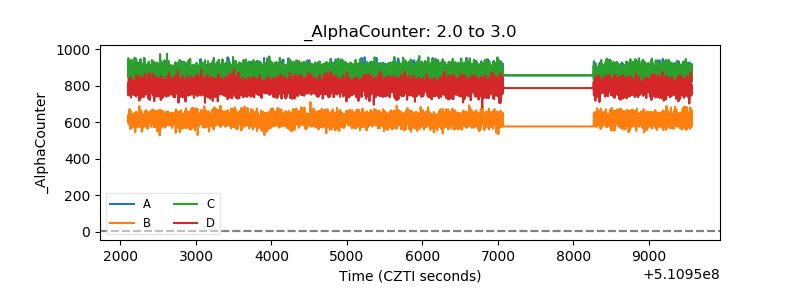 |
| _CPM_Rate | 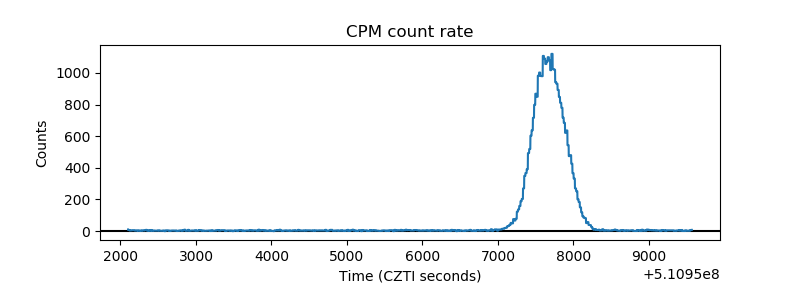 |
| CZT Counter | 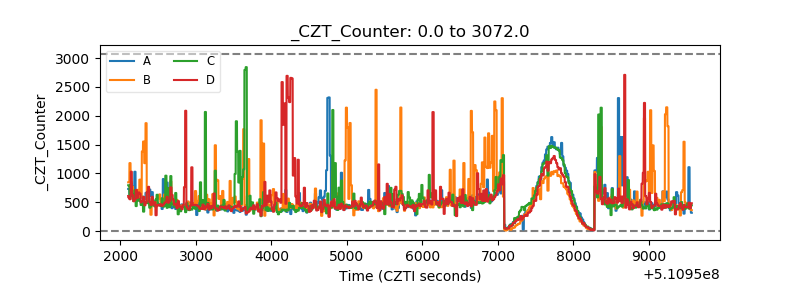 |
| +2.5 Volts monitor | 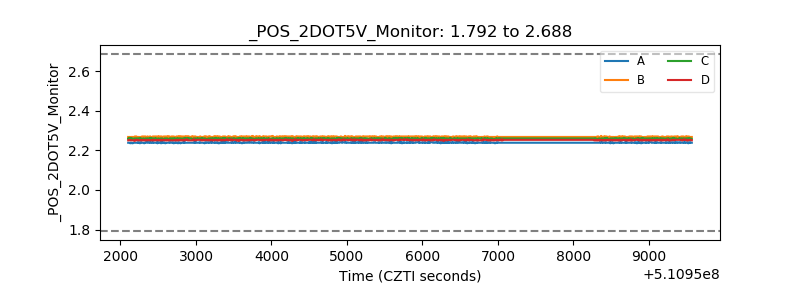 |
| +5 Volts monitor | 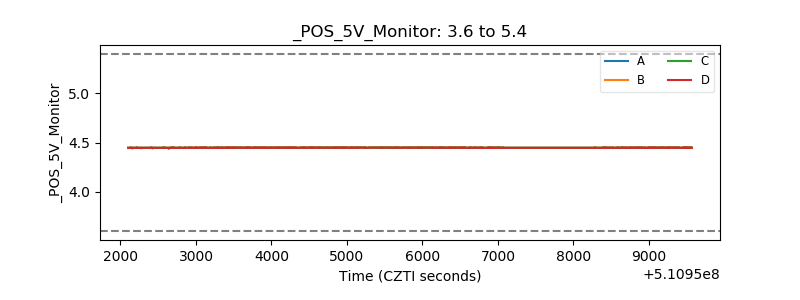 |
| _ROLL_ROT | 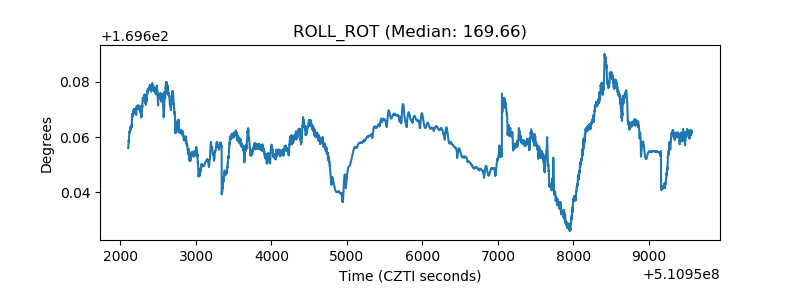 |
| _Roll_DEC | 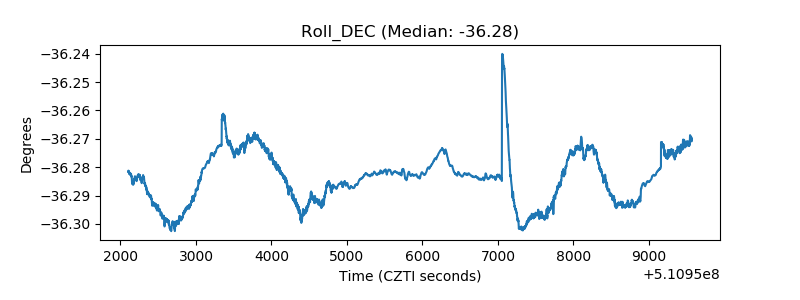 |
| _Roll_RA | 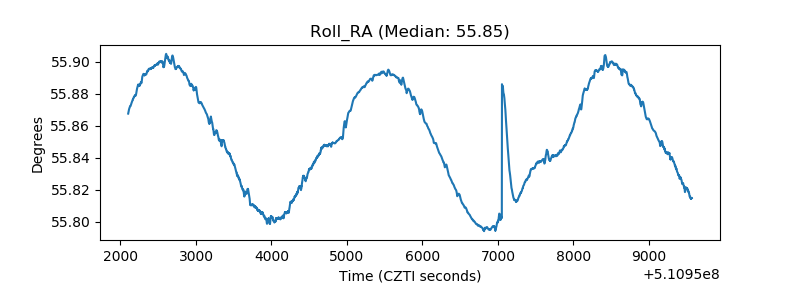 |
| Veto Counter | 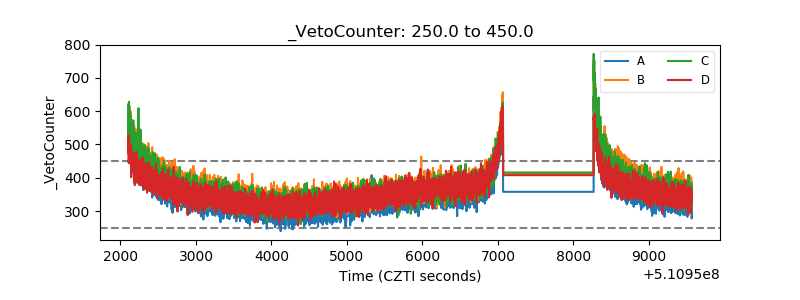 |