| Param | Original file | Final file |
|---|---|---|
| Filename | modeM0/AS1A14_060T01_9000006556_56551cztM0_level2.fits | modeM0/AS1A14_060T01_9000006556_56551cztM0_level2_quad_clean.evt |
| Size (bytes) | 446,345,280 | 92,321,280 |
| Size | 425.7 MB | 88.0 MB |
| Events in quadrant A | 3,428,506 | 622,972 |
| Events in quadrant B | 5,697,345 | 586,980 |
| Events in quadrant C | 3,086,584 | 605,101 |
| Events in quadrant D | 3,819,918 | 541,368 |
| Mode M0 | |||
|---|---|---|---|
| Quadrant | BADHDUFLAG | Total packets | Discarded packets |
| A | 0 | 14594 | 2 |
| B | 0 | 21143 | 2 |
| C | 0 | 13702 | 2 |
| D | 0 | 15709 | 2 |
| Mode M9 | |||
|---|---|---|---|
| Quadrant | BADHDUFLAG | Total packets | Discarded packets |
| A | 0 | 16 | 0 |
| B | 0 | 17 | 0 |
| C | 0 | 17 | 0 |
| D | 0 | 17 | 0 |
| Mode SS | |||
|---|---|---|---|
| Quadrant | BADHDUFLAG | Total packets | Discarded packets |
| A | 0 | 128 | 0 |
| B | 0 | 126 | 0 |
| C | 0 | 126 | 0 |
| D | 0 | 126 | 0 |
| Quadrant | Total seconds | Saturated seconds | Saturation percentage |
|---|---|---|---|
| A | 6297 | 113 | 1.794505% |
| B | 6297 | 1045 | 16.595204% |
| C | 6296 | 56 | 0.889454% |
| D | 6296 | 282 | 4.479034% |
Noise dominated data is calculated using 1-second bins in cleaned event files. If a bin has >2000 counts, and if more than 50% of those come from <1% of pixels, then it is considered to be noise-dominated and hence unusable.
| Quadrant | # 1 sec bins | Bins with >0 counts | Bins with >2000 counts | High rate bins dominated by noise | Noise dominated (total time) | Noise dominated (detector-on time) | Marked lightcurve |
|---|---|---|---|---|---|---|---|
| A | 7492 | 6298 | 77 | 77 | 1.03% | 1.22% | 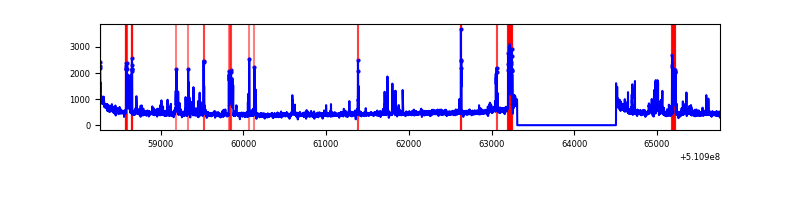 |
| B | 7492 | 6298 | 640 | 640 | 8.54% | 10.16% | 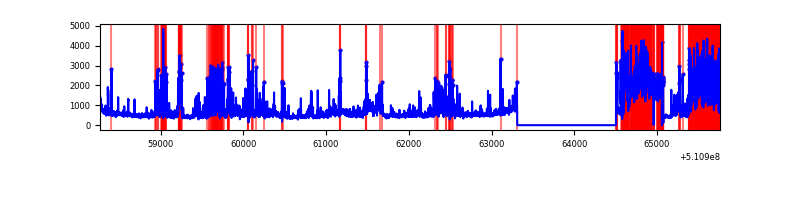 |
| C | 7491 | 6297 | 40 | 40 | 0.53% | 0.64% | 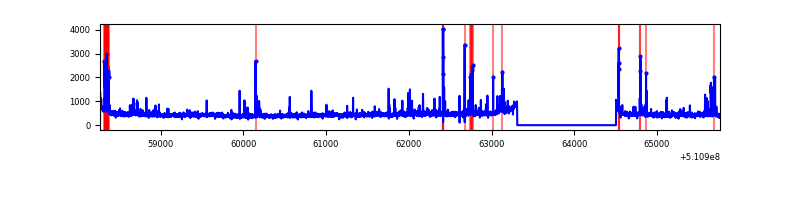 |
| D | 7491 | 6297 | 186 | 186 | 2.48% | 2.95% | 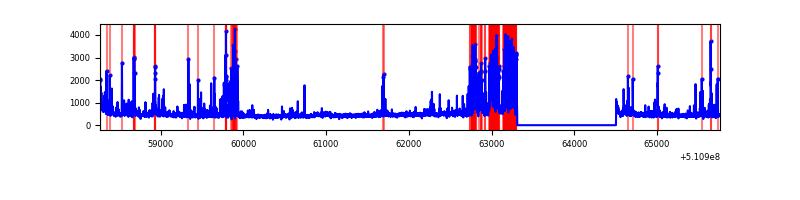 |
Top three noisy pixels from each quadrant. If the there are fewer than three noisy pixels in the level2.evt file, extra rows are filled as -1
| Pixel properties | Quadrant properties | ||||||
|---|---|---|---|---|---|---|---|
| Quadrant | DetID | PixID | Counts | Sigma | Mean | Median | Sigma |
| A | 4 | 95 | 258073 | 1477.98 | 701 | 683 | 174.1 |
| A | 8 | 249 | 105872 | 604.02 | 701 | 683 | 174.1 |
| A | 11 | 31 | 86613 | 493.43 | 701 | 683 | 174.1 |
| B | 5 | 172 | 1998322 | 14517.49 | 648 | 626 | 137.6 |
| B | 4 | 206 | 732388 | 5317.8 | 648 | 626 | 137.6 |
| B | 4 | 171 | 79806 | 575.41 | 648 | 626 | 137.6 |
| C | 9 | 38 | 117515 | 620.76 | 686 | 679 | 188.2 |
| C | 12 | 249 | 94882 | 500.51 | 686 | 679 | 188.2 |
| C | 12 | 252 | 74968 | 394.7 | 686 | 679 | 188.2 |
| D | 2 | 249 | 544319 | 2852.18 | 662 | 631 | 190.6 |
| D | 2 | 207 | 142478 | 744.13 | 662 | 631 | 190.6 |
| D | 11 | 129 | 106840 | 557.17 | 662 | 631 | 190.6 |
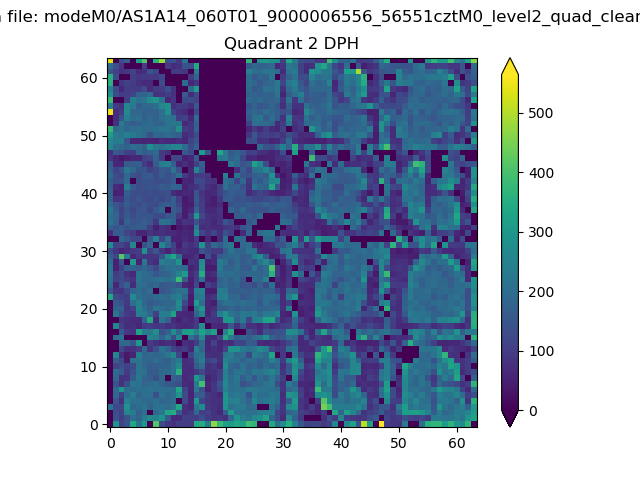
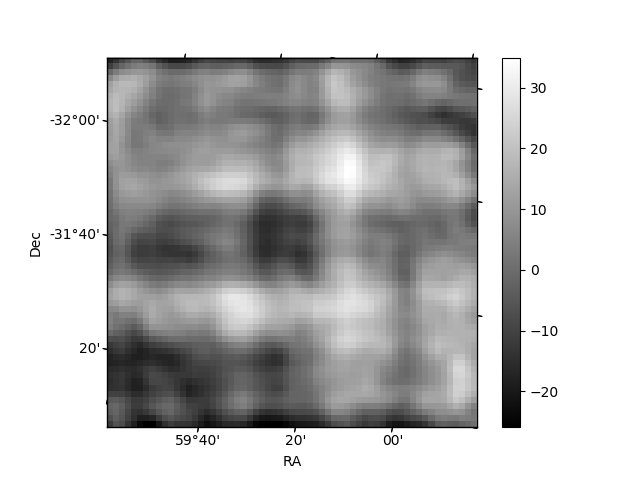
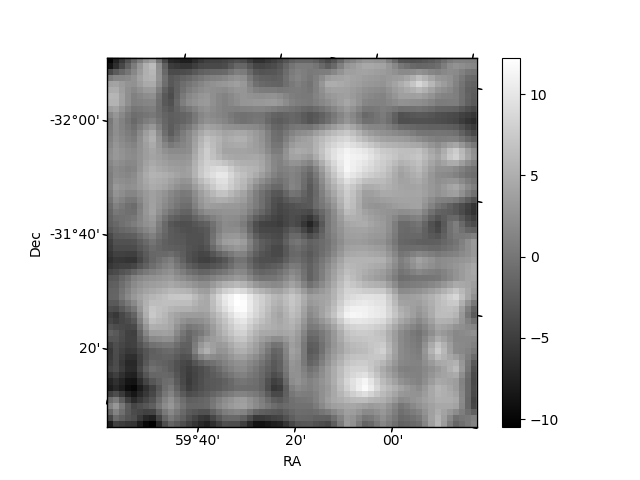
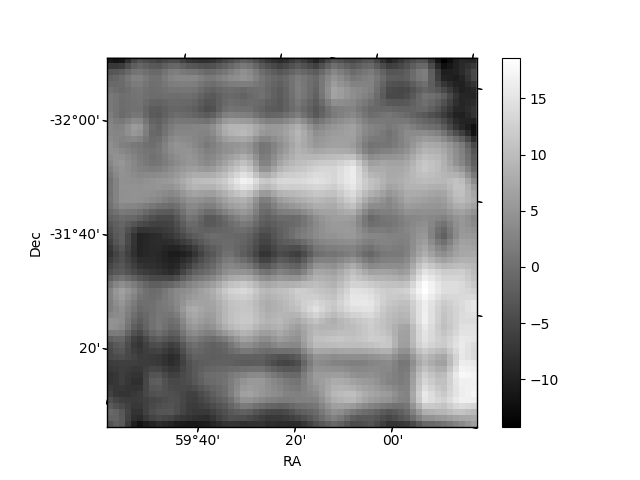
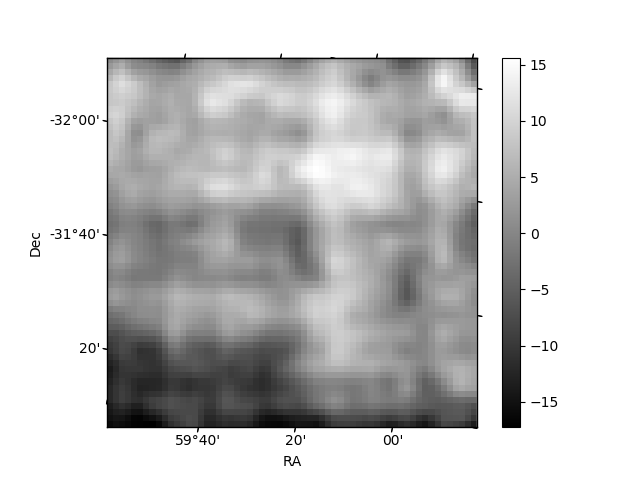
Histogram calculated using DETX and DETY for each event in the final _common_clean file
| Quadrant A | 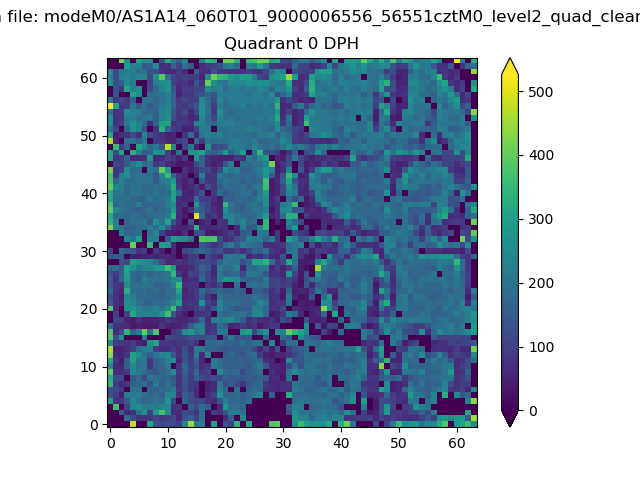 |
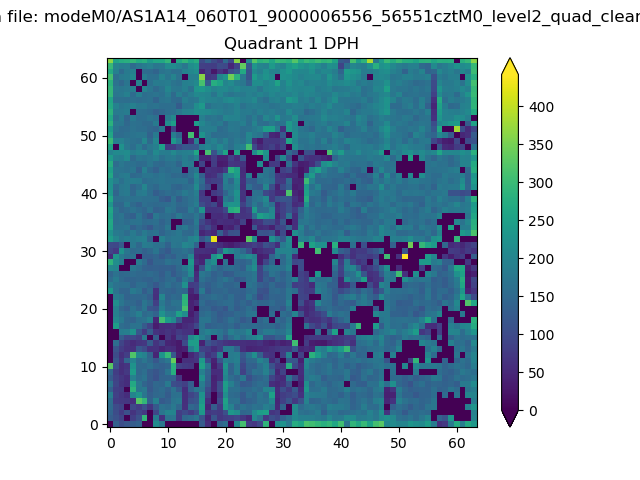 |
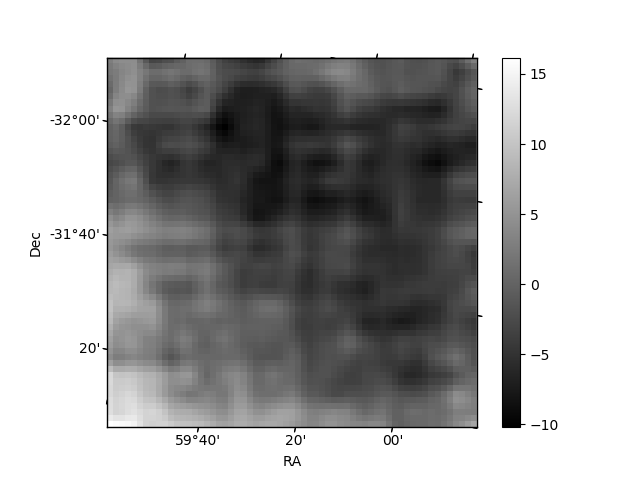
Quadrant B |
|---|---|---|---|
| Quadrant D | 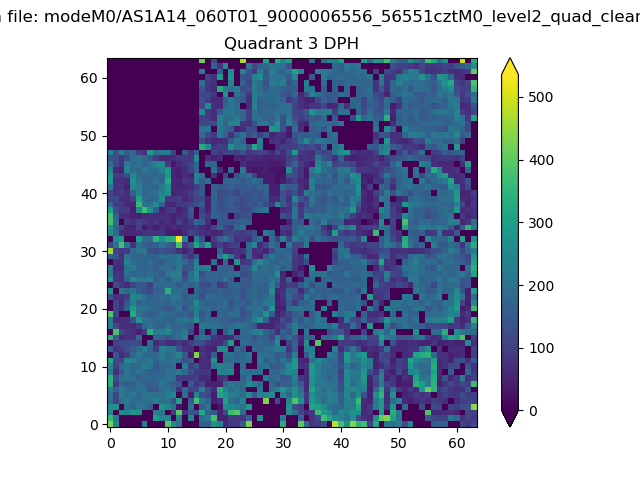 |
 |
Quadrant C |
| Plot type | Count rate plots | Images |
|---|---|---|
| Comparison with Poisson distribution Blue bars denote a histogram of data divided into 1 sec bins. Red curve is a Poisson curve with rate = median count rate of data. |
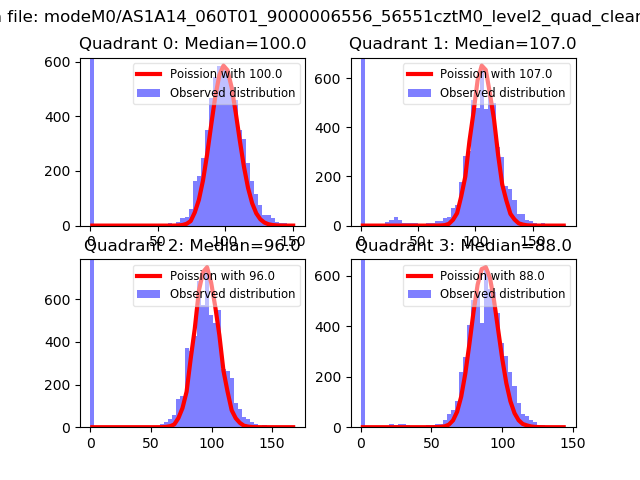 |
 |
| Quadrant-wise count rates Data is divided into 100 sec bins |
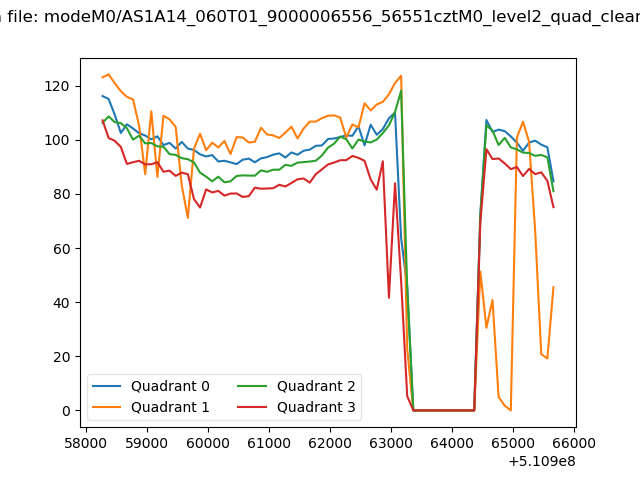 |
|
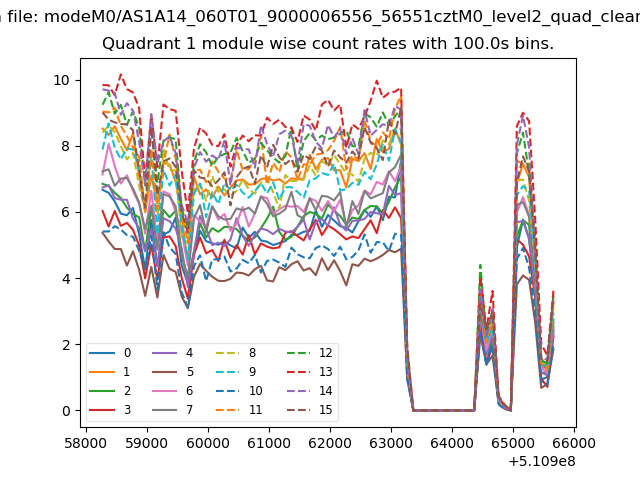
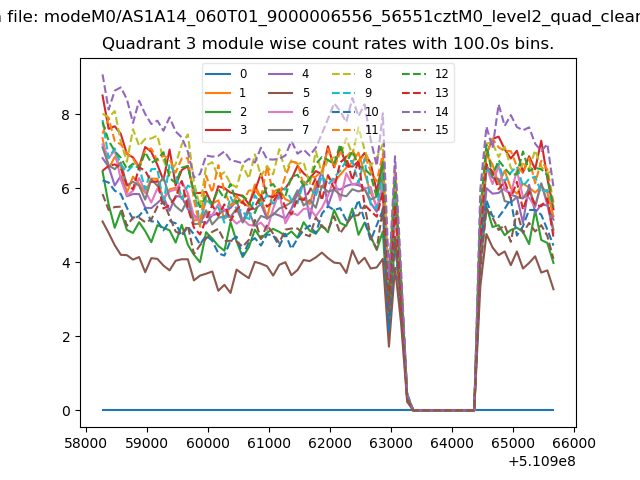
| Module-wise count rates for Quadrant A Data is divided into 100 sec bins |
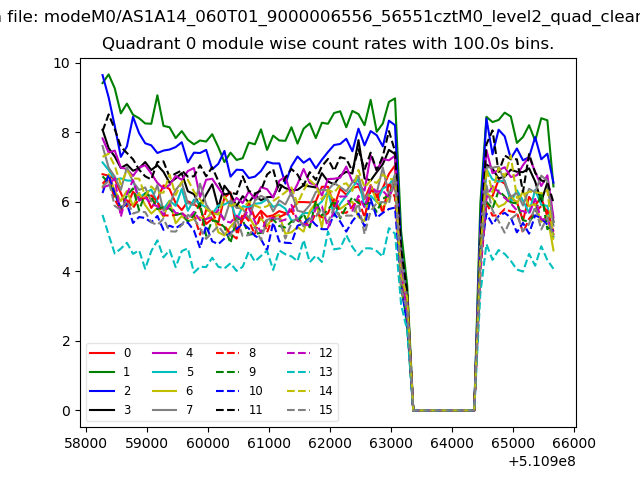 |
 |
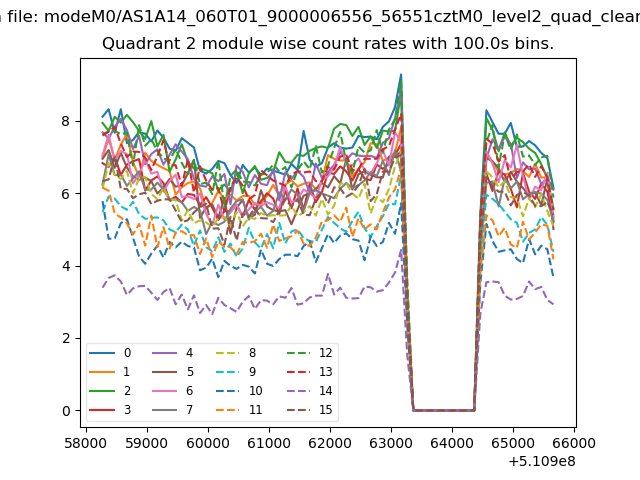
| Module-wise count rates for Quadrant B Data is divided into 100 sec bins |
 |
 |
| Module-wise count rates for Quadrant C Data is divided into 100 sec bins |
 |
 |
| Module-wise count rates for Quadrant D Data is divided into 100 sec bins |
 |
 |
| Parameter | Plot |
|---|---|
| CZT HV Monitor | 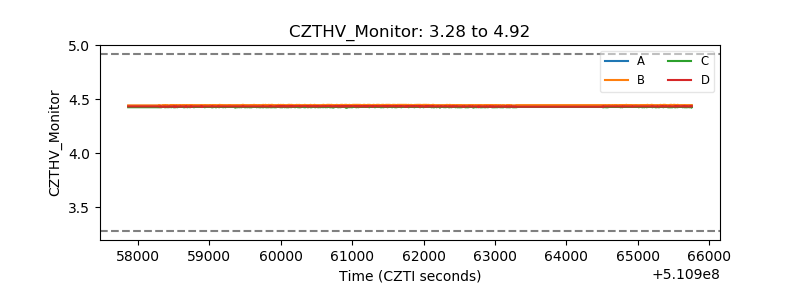 |
| D_VDD | 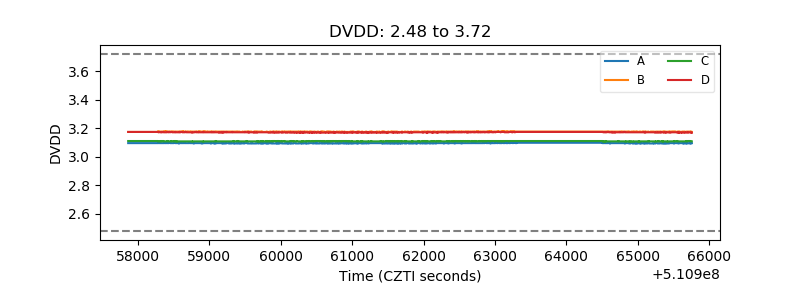 |
| Temperature 1 | 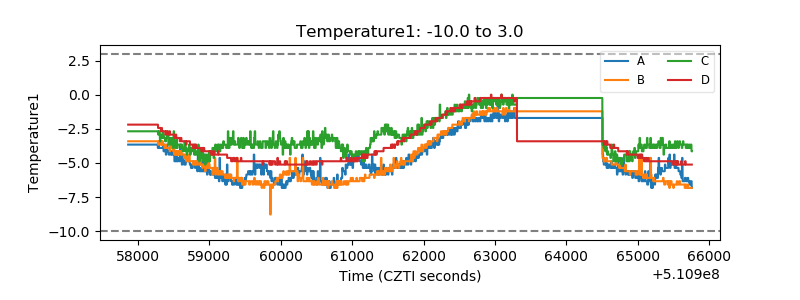 |
| Veto HV Monitor | 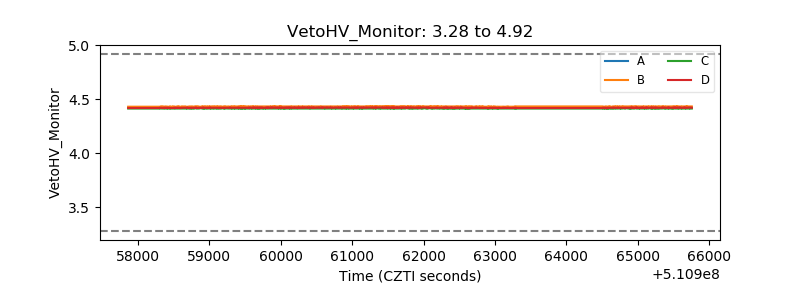 |
| Veto LLD | 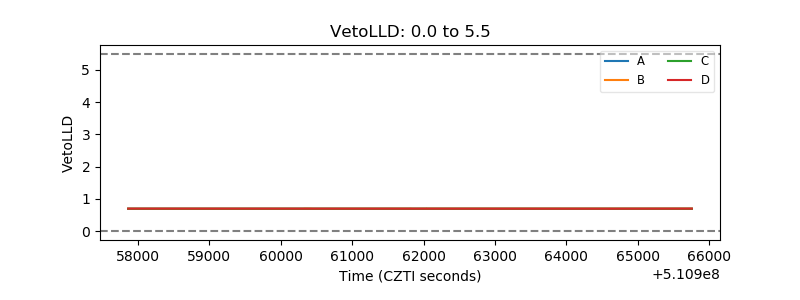 |
| Alpha Counter | 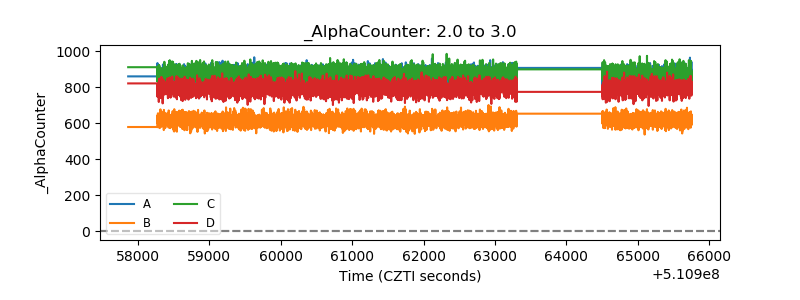 |
| _CPM_Rate | 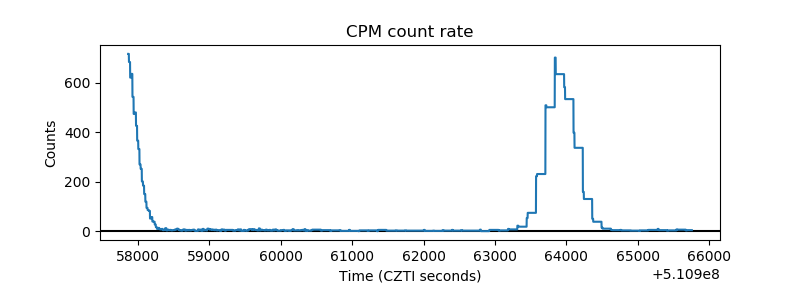 |
| CZT Counter | 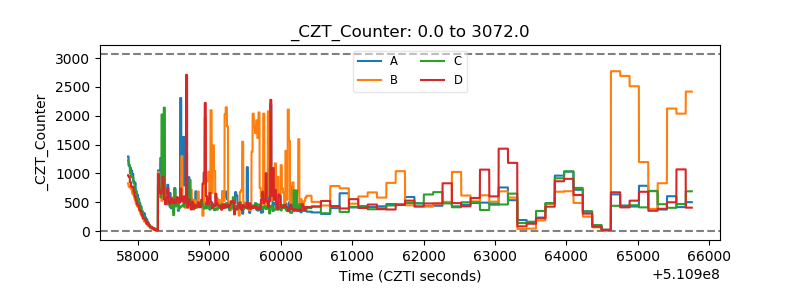 |
| +2.5 Volts monitor | 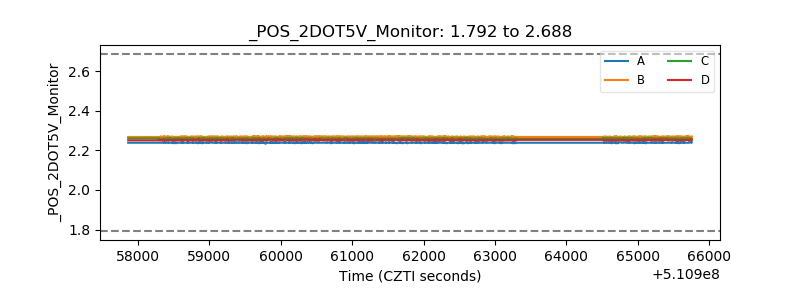 |
| +5 Volts monitor | 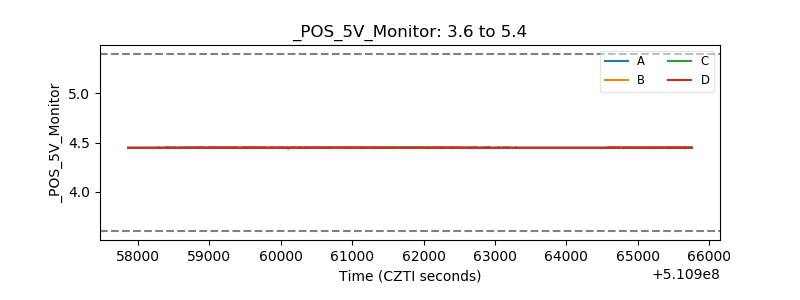 |
| _ROLL_ROT | 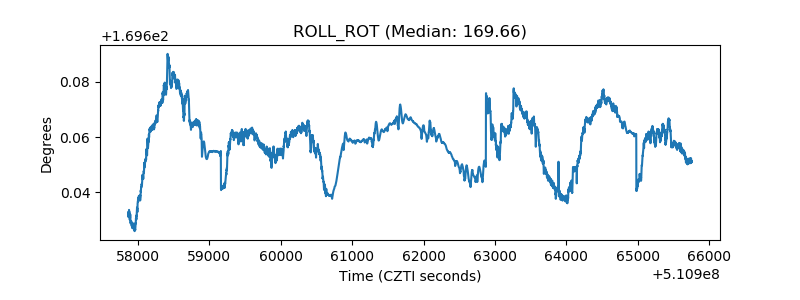 |
| _Roll_DEC | 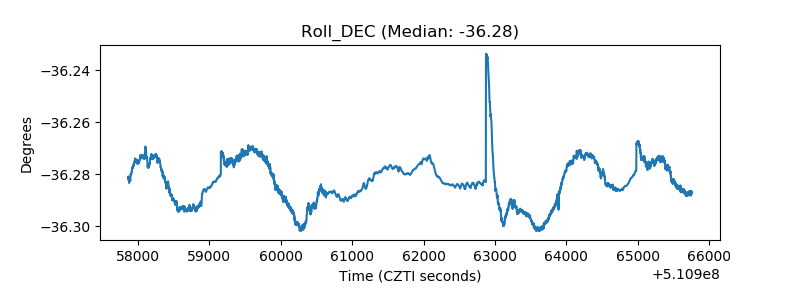 |
| _Roll_RA | 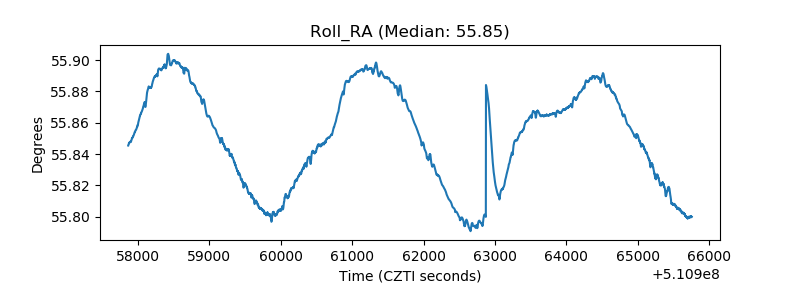 |
| Veto Counter | 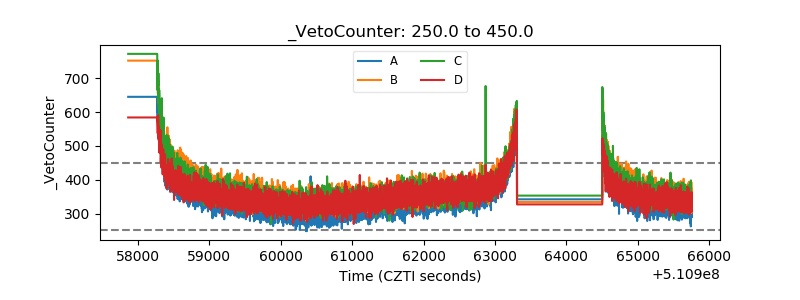 |